
Solana Price Forecast: SOL enters survival mode on losing key support level
Por Vishal Dixit
Data de Publicação: 24 Feb 2026 | Data de Modificação: 24 Feb 2026


ARTIGOS POPULARES

Solana (SOL) trades below $80 at press time on Tuesday, extending its 6% drop from Monday amid increased sell pressure as the market leader, Bitcoin (BTC), dropped below $64,000.
- Solana declines below $80 on Tuesday after Monday’s 6% fall, marking the third consecutive day of losses.
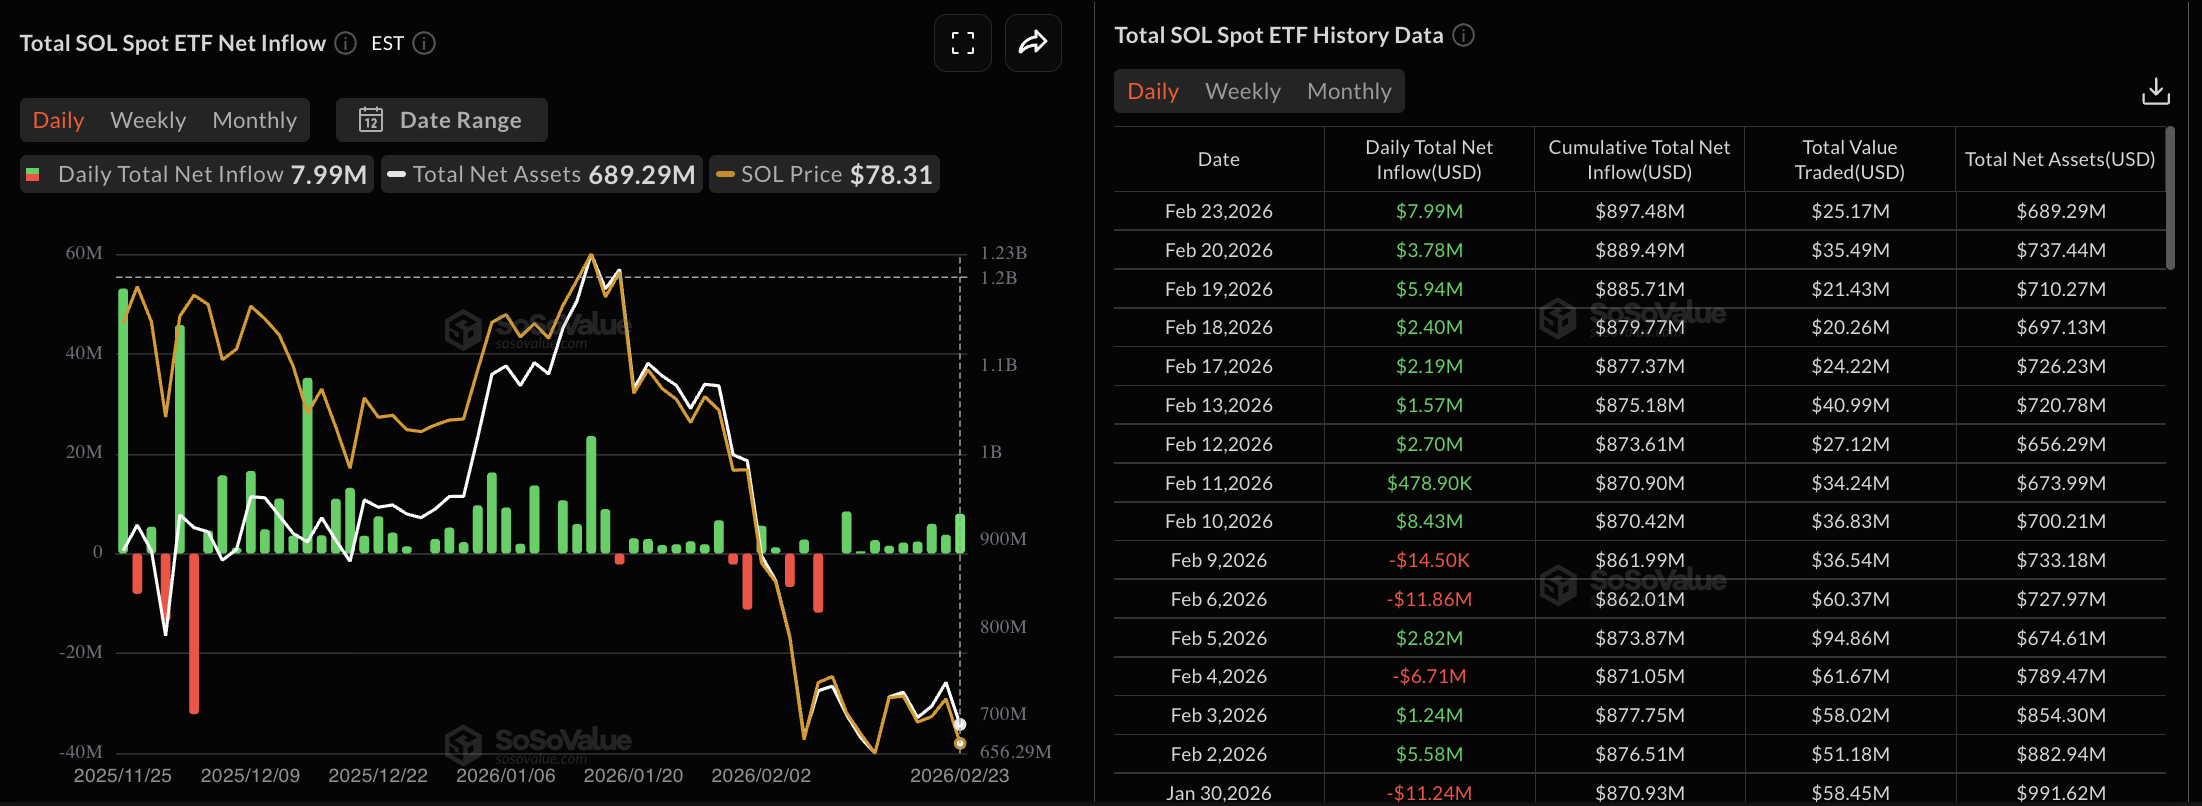
- US spot SOL ETFs record their ninth consecutive day of inflows, totaling roughly $8 million on Monday.
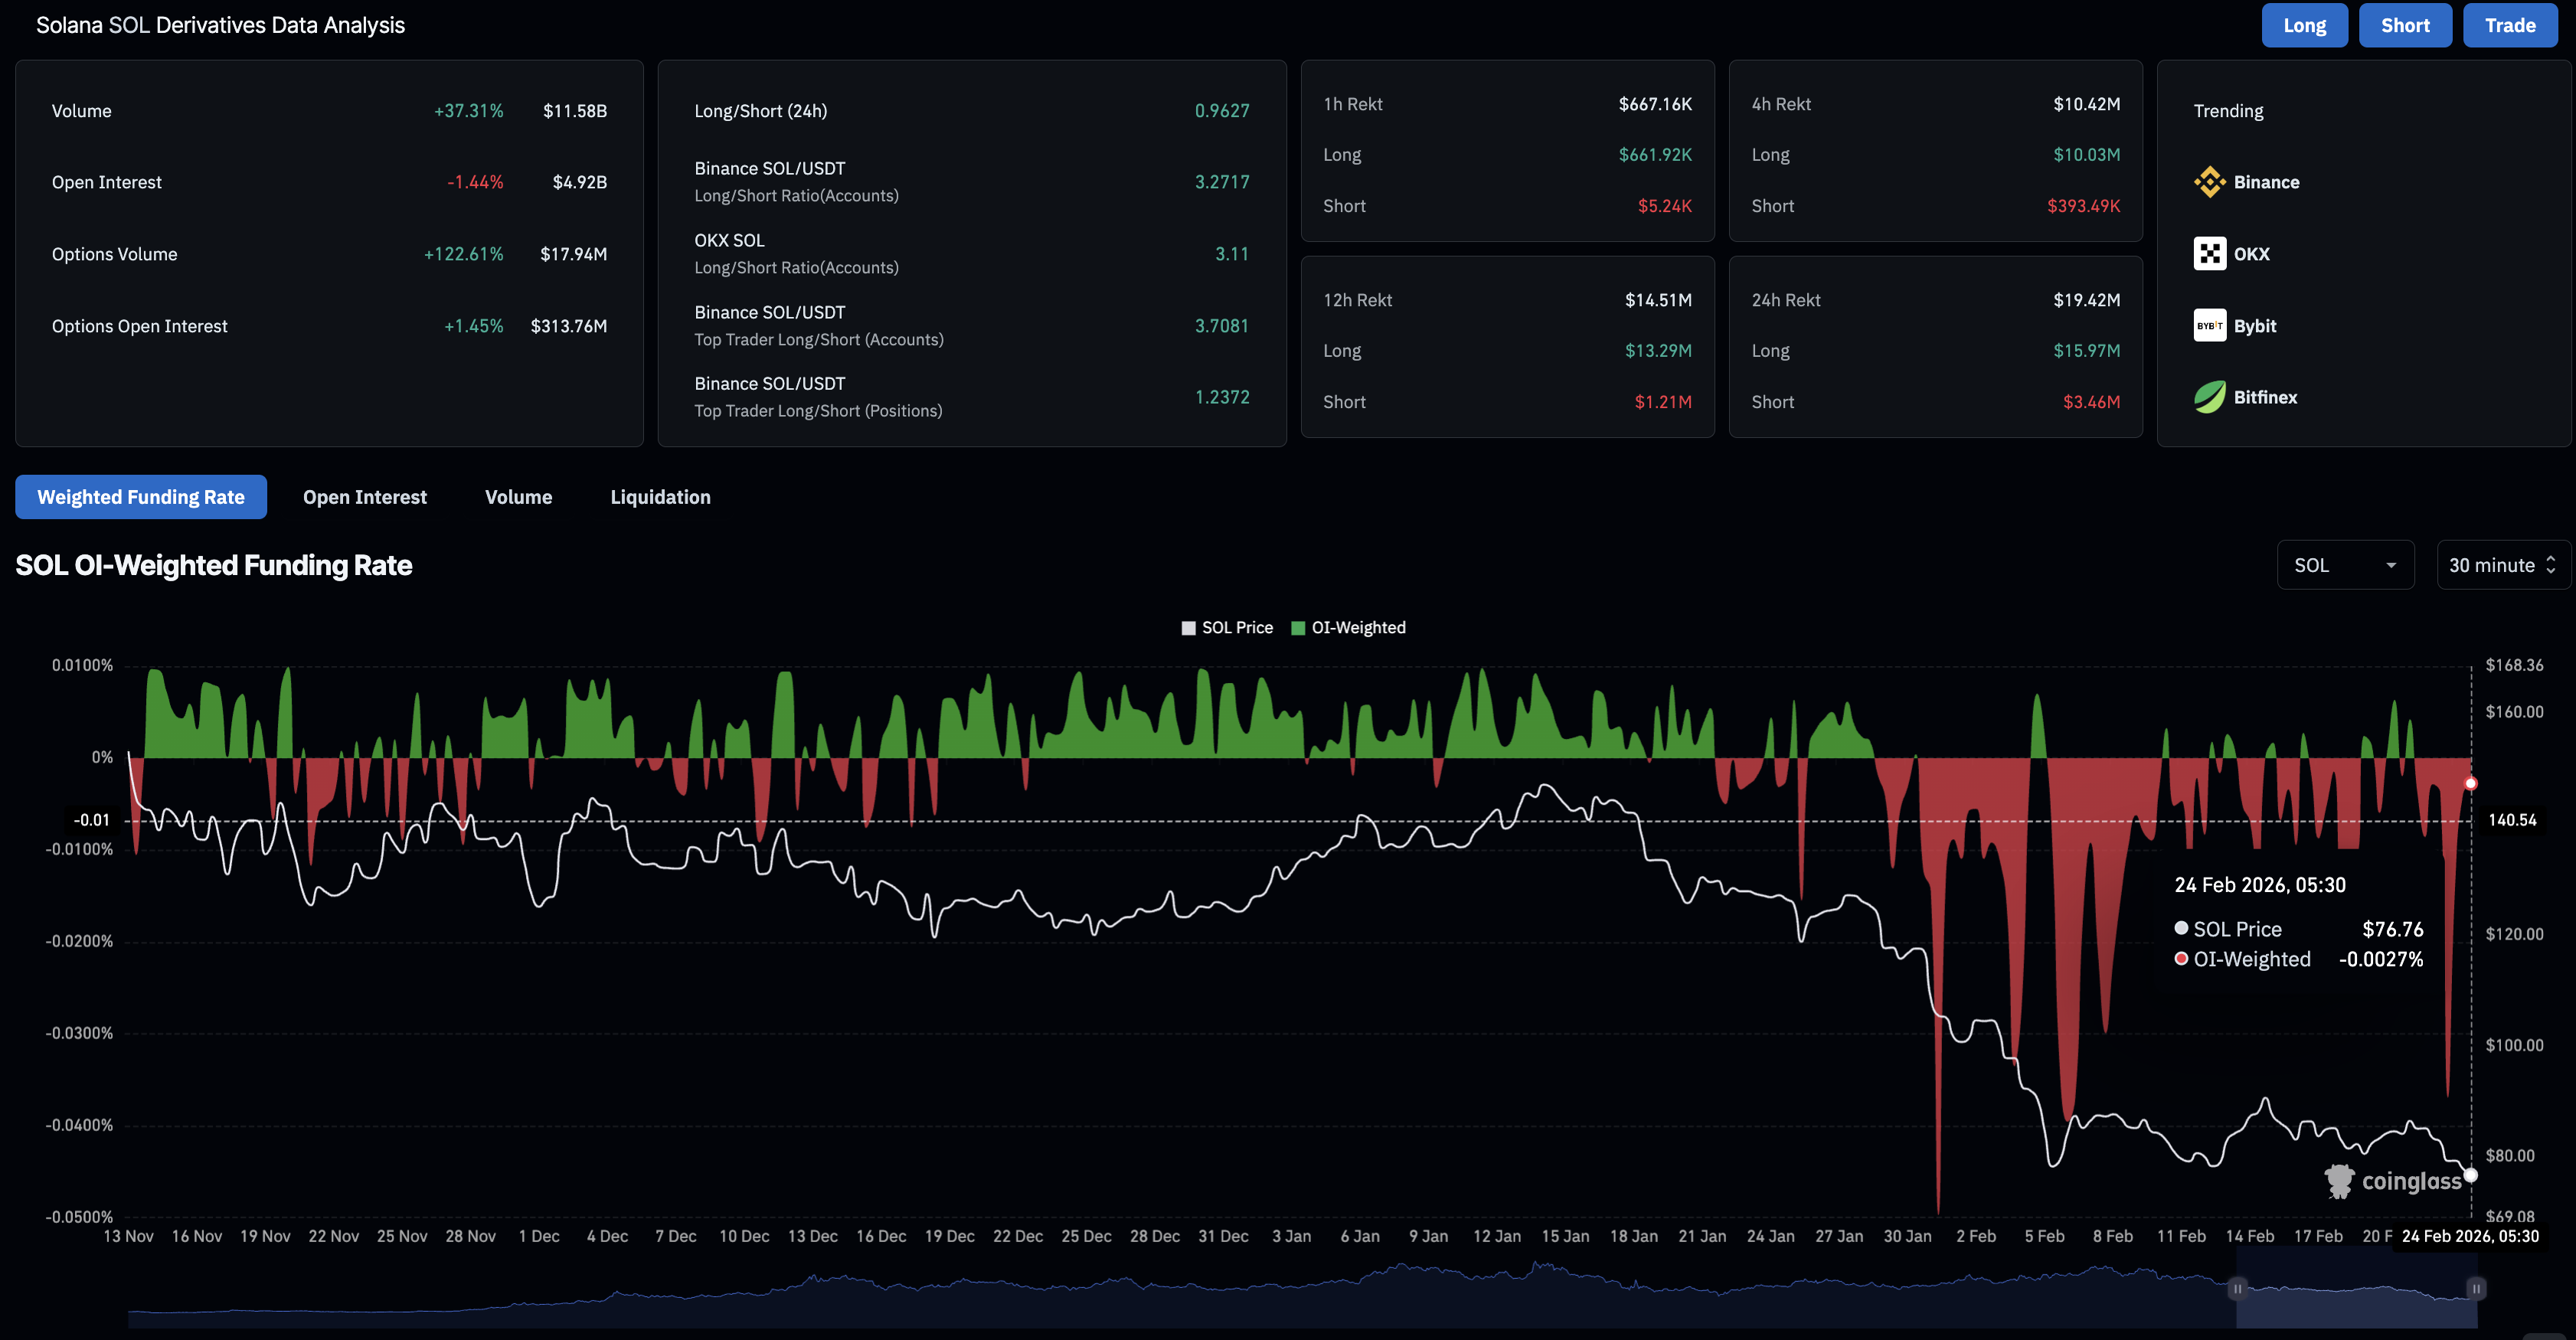
- Derivatives market data reflects a bearish tilt, as rising long liquidations push the long-to-short ratio below 1.
Solana (SOL) trades below $80 at press time on Tuesday, extending its 6% drop from Monday amid increased sell pressure as the market leader, Bitcoin (BTC), dropped below $64,000. The institutional support holds for Solana with Exchange Traded Funds (ETFs) expanding exposure, while the derivatives market succumbs to market fear. The technical outlook for Solana focuses on a key support level near $75, which caps downside risk toward $67.
Institutions favor Solana amid market downturn
Solana remains a consistent choice for institutional investors despite the broader market stress. US spot Solana ETFs recorded $7.99 million in inflows on Monday, extending the accumulation spree for the ninth consecutive trading session.
On the derivatives side, retail sentiment suggests a bearish bias. CoinGlass data shows SOL Open Interest (OI) at $4.92 billion on Tuesday, down 1.44% over the last 24 hours, suggesting risk-off sentiment among traders. The long liquidation over the same time period accounts for $15.97 million, significantly higher than the short liquidations of $3.46 million. Declining OI amid increased long liquidations suggests that the bullish positional buildup in Solana futures was hit, driving the traders to the sidelines.
The wipeout of long positions dropped the long-to-short ratio to 0.9627, which indicates a greater number of short positions left active. Additionally, the funding rate remains negative at -0.0027%, reaffirming the bias that traders are leaning toward holding short positions.
Technical Analysis: Will Solana extend its fall below $70?
Solana is extending its decline below $80 at press time on Tuesday, resulting in its third consecutive day of losses. SOL remains below the 50- and 200-day Exponential Moving Averages (EMAs), with both slopes lower, indicating a bearish bias.
Solana approaches the 23.6% trend-based Fibonacci retracement level at $75.74, measured from the January 13 high at $148.74 to the February 15 high at $91.26, including the February 6 low at $67.50.
If Solana clears below this support level, it could extend the decline to the February 6 low at $67.50, followed by the 50% trend-based Fibonacci retracement level at $61.48.
The technical indicators on the daily chart suggest that the short-term recovery is losing strength. The Moving Average Convergence Divergence (MACD) reverses toward the signal line while both remain below zero, and positive histograms contract, suggesting fading bullish momentum. At the same time, the Relative Strength Index (RSI) is at 31, stretched to the downside, and shows nearly oversold conditions.
On the upside, a potential rebound from this key support could challenge the February 15 high at $91.26, followed by a higher resistance at the 50-day EMA at $102.90.
(The technical analysis of this story was written with the help of an AI tool.)

Mais de um milhão de usuários confiam na FXStreet para dados de mercado em tempo real, ferramentas de gráficos, insights de especialistas e notícias de Forex. Seu calendário econômico abrangente e webinars educacionais ajudam os traders a se manterem informados e tomarem decisões calculadas. A FXStreet conta com uma equipe de cerca de 60 profissionais, divididos entre a sede em Barcelona e diversas regiões globais.
Ler mais


