
Tezos Price Prediction: XTZ recovery tests triangle breakout, targeting $0.40
Por Vishal Dixit
Atualizado: 28 Apr 2026


ARTIGOS POPULARES
Tezos (XTZ) extends gains for the second consecutive day above $0.3800 at press time on Tuesday, testing grounds above the 50-day Exponential Moving Average (EMA) at $0.3736. XTZ derivatives signal rising retail demand with a surge in futures Open Interest, anticipating further upside.
- Tezos extends gains on Tuesday above the 50-day EMA, testing grounds above a key resistance trendline.
- Privacy coin regains retail demand as XTZ derivatives see a buildup in positions.
- XTZ price should hold a daily close above $0.38 to confirm triangle breakout, which could target 100-day EMA at $0.40.
Tezos (XTZ) extends gains for the second consecutive day above $0.3800 at press time on Tuesday, testing grounds above the 50-day Exponential Moving Average (EMA) at $0.3736. XTZ derivatives signal rising retail demand with a surge in futures Open Interest, anticipating further upside. Tezos targets the 100-day EMA at $0.4046 as the initial resistance to break for a sustained recovery.
Tezos gains retail strength
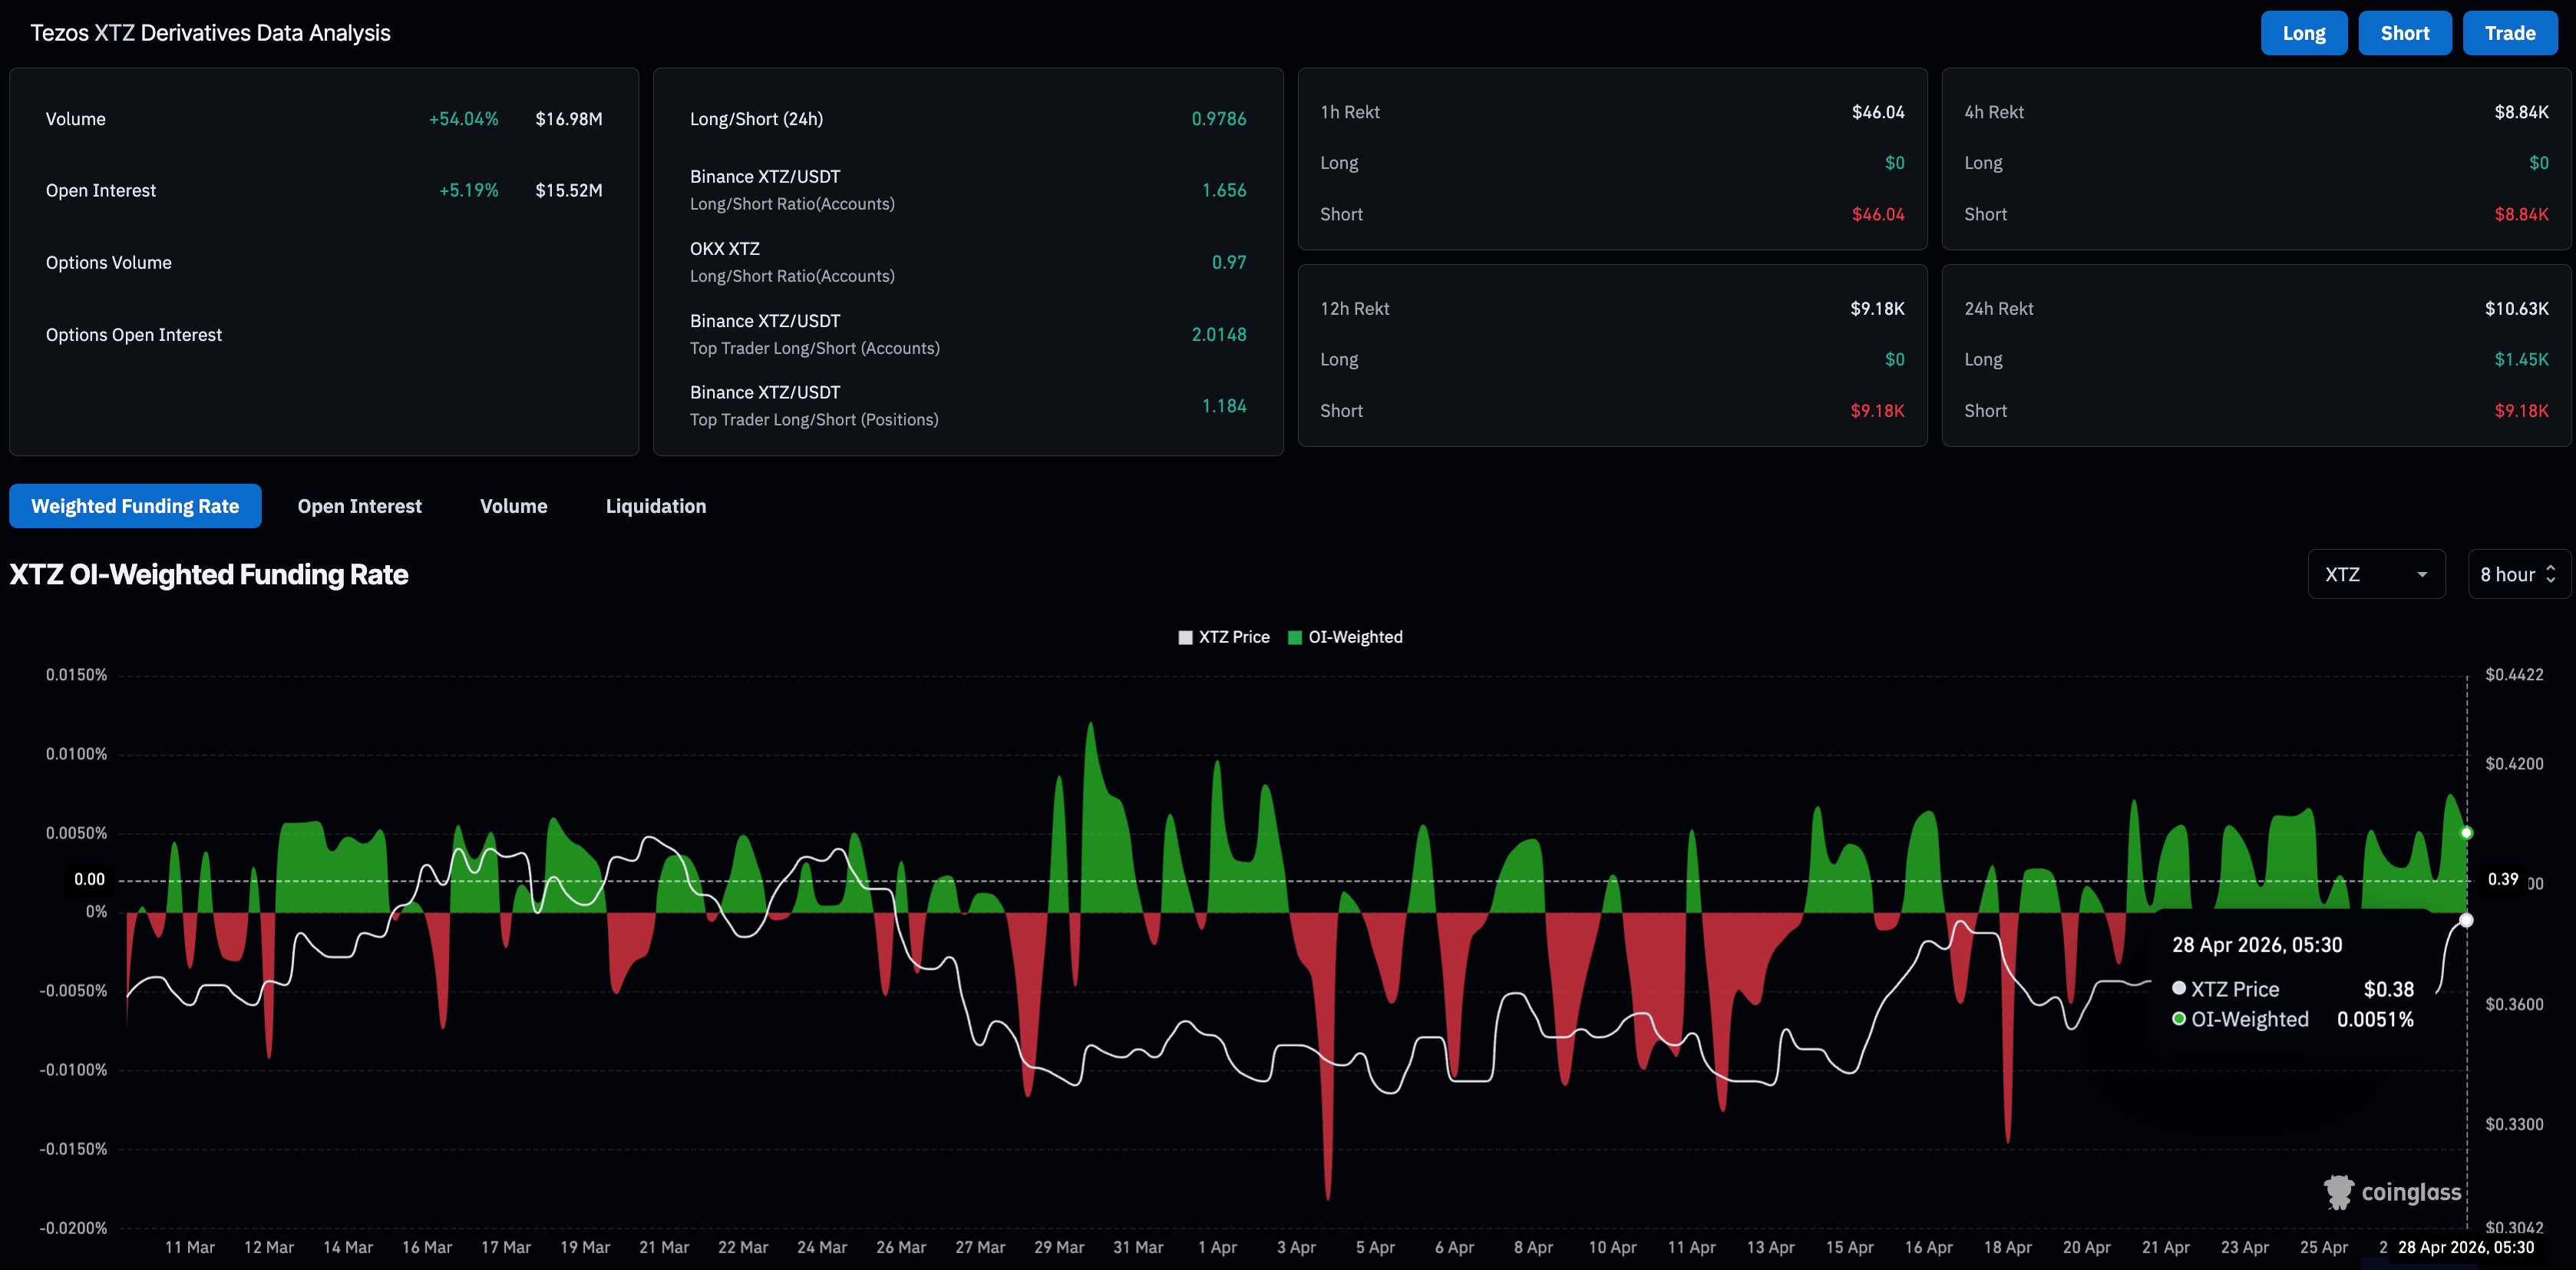
The short-term recovery in Tezos rebuilds retail confidence in the privacy coin, leading to increased leverage-linked trading activity. CoinGlass data shows the XTZ futures Open Interest (OI) is up over 5% in the last 24 hours to $15.52 million, indicating increased positional setup as risk-on sentiment renews among traders.
The positive funding rate of 0.0051% reaffirms the bullish sentiment among traders, who are willing to take long positions at a premium.
Technical outlook: Will Tezos surpass $0.40?
Tezos holds above the 50-day EMA at $0.3736 and has pushed through the former downward resistance trendline around $0.3770, hinting at a mild bullish tilt. A decisive close above this level could be capped by the 100-day EMA at $0.4046. However, a clean pass above this zone could open the path toward the 200-day EMA near $0.4619.
Momentum aligns with this constructive bias, as the Relative Strength Index (RSI) at 58 rises above the midline on the daily chart, with more room on the upside before reaching the overbought threshold. Meanwhile, the Moving Average Convergence Divergence (MACD) rises in positive territory with its signal line as positive histogram bars expand, suggesting that buyers retain the near-term initiative.
On the downside, immediate support is seen at the reclaimed downward trendline break area around $0.3770, followed by the 50-day EMA at $0.3736.
(The technical analysis of this story was written with the help of an AI tool.)

Mais de um milhão de usuários confiam na FXStreet para dados de mercado em tempo real, ferramentas de gráficos, insights de especialistas e notícias de Forex. Seu calendário econômico abrangente e webinars educacionais ajudam os traders a se manterem informados e tomarem decisões calculadas. A FXStreet conta com uma equipe de cerca de 60 profissionais, divididos entre a sede em Barcelona e diversas regiões globais.
Ler mais


