
Top 3 Price Prediction: Bitcoin, Ethereum, Ripple – BTC nears key support, ETH weakens, XRP slips below key EMA
Por Manish Chhetri
Atualizado: 29 Apr 2026


ARTIGOS POPULARES

Bitcoin (BTC) price is nearing key support at $75,648 on Wednesday, after two consecutive days of pullbacks this week.
- Bitcoin price nears the key 100-day EMA at $75,648, if it holds, it supports a recovery.
- Ethereum price weakens as momentum indicators flash early bearish signals.
- XRP extends correction after closing below its key 50-day EMA at $1.41 earlier this week.
Bitcoin (BTC) price is nearing key support at $75,648 on Wednesday, after two consecutive days of pullbacks this week. Ethereum (ETH) and Ripple (XRP) followed BTC’s footsteps and corrected slightly, with ETH flashing early bearish signals in its momentum indicators, while XRP slipped below its key support zone. The price action of the top three cryptocurrencies suggests traders are becoming cautious in the short term, with key support levels now likely to determine whether the broader bullish structure remains intact or a deeper correction unfolds.
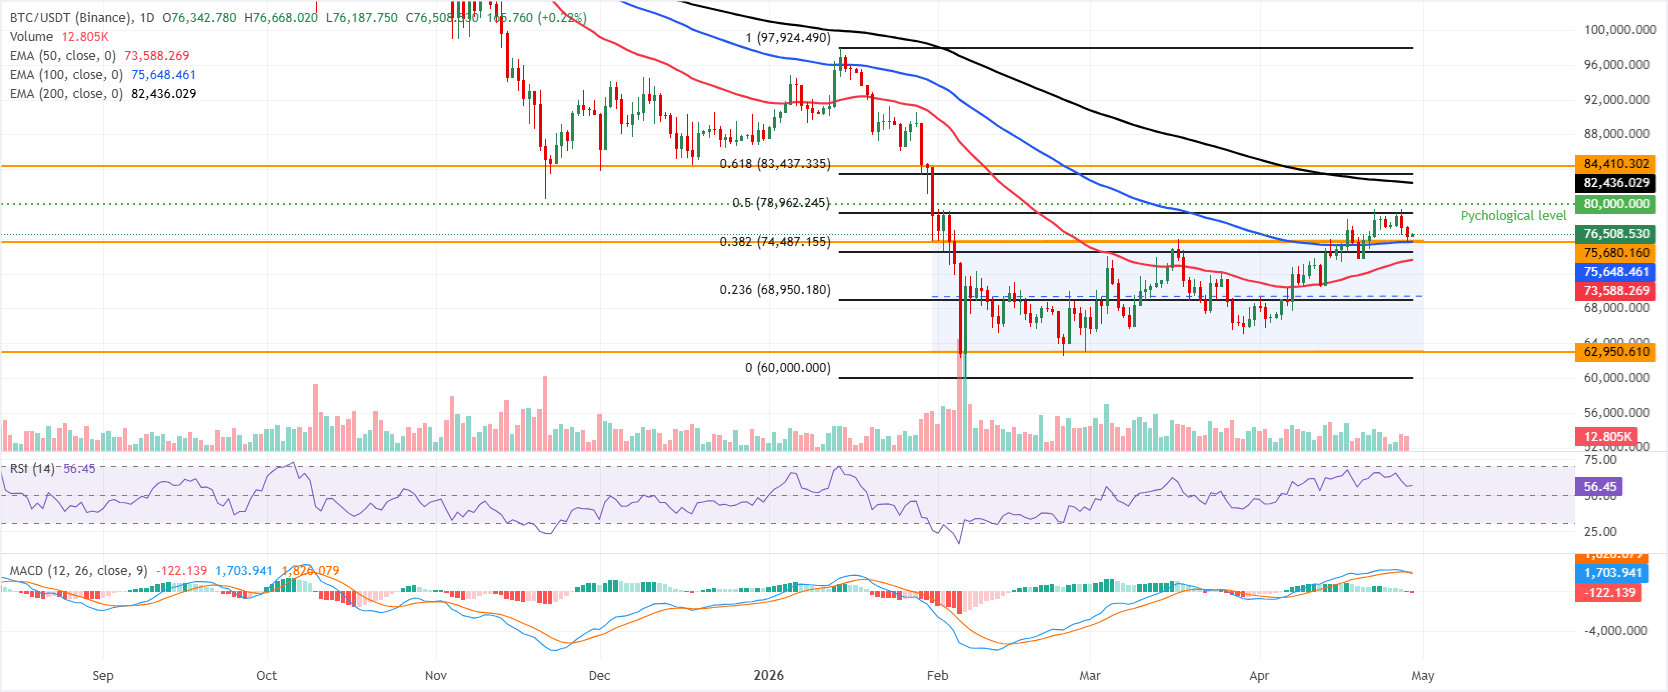
Bitcoin nears 100-day EMA at $75,648
Bitcoin price is trading at $76,508 on Wednesday, holding a constructive bullish bias as it sits above the 50-day and 100-day Exponential Moving Averages (EMAs) at roughly $73,588 and $75,648, and has also pushed above the upper boundary of the parallel channel near $75,680.
The Relative Strength Index (RSI) around 56 suggests moderate positive momentum, though the Moving Average Convergence Divergence (MACD) has slipped back below zero, hinting that upside may be slowing as price approaches a dense band of overhead resistance.
On the downside, immediate support is seen at the former channel top near $75,680, reinforced by the 100-day EMA at $75,648, with the 38.2% Fibonacci retracement (drawn from January high to the February low) at $74,487 and the 50-day EMA near $73,588 providing a deeper cushion before the 23.6% retracement at $68,950 and the channel floor around $62,950.
On the topside, initial resistance emerges at the 50% retracement near $78,962, followed by the psychological $80,000 barrier, while further north, the 200-day EMA around $82,436 aligns with the 61.8% retracement at $83,437 and the horizontal cap near $84,410 to define a major supply zone that bulls would need to clear to extend the broader uptrend.
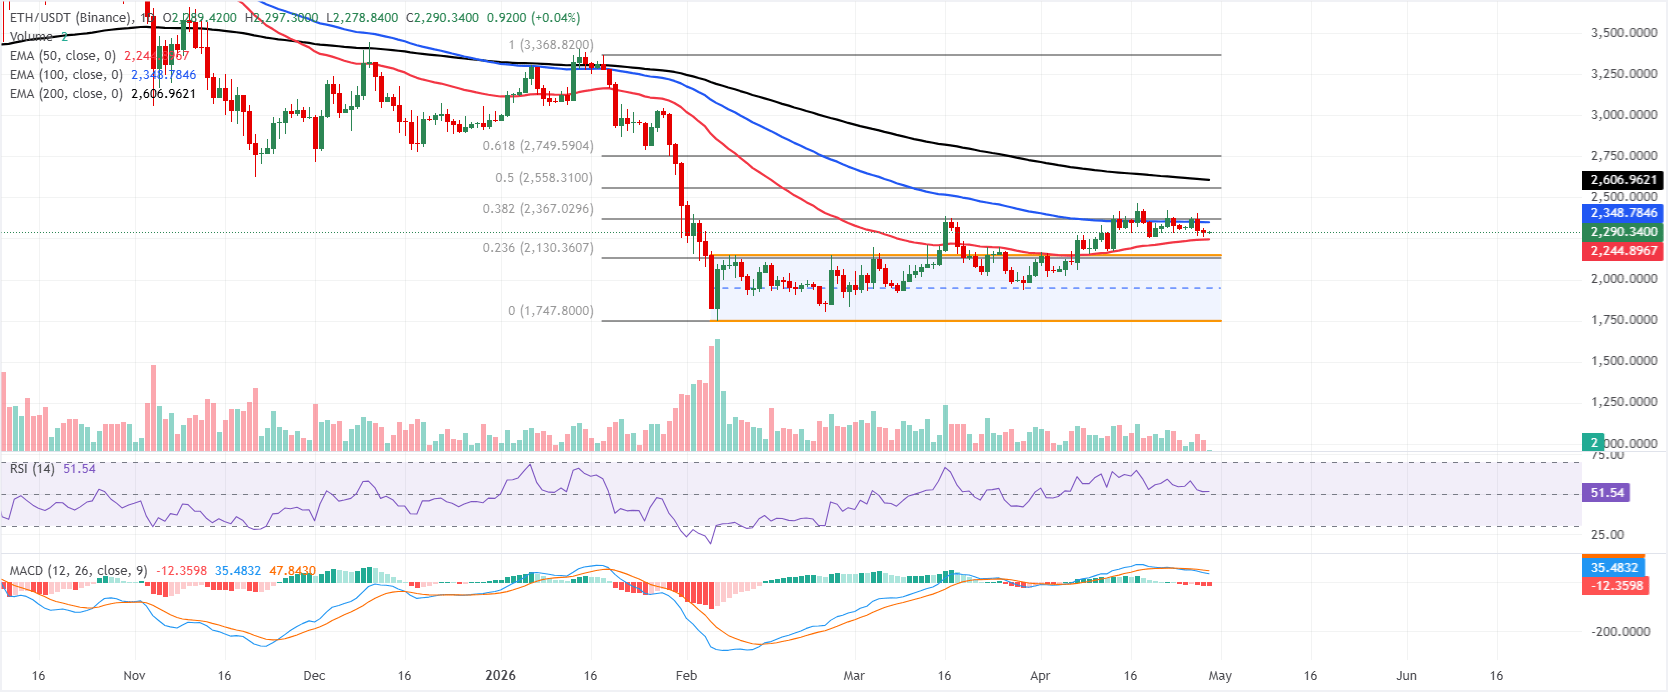
Ethereum flashes early bearish signals
Ethereum is trading at $2,290 on Wednesday, maintaining a neutral-to-slightly bullish tone as it stays above the 50-day EMA at $2,244 while still trading beneath the 100-day EMA at $2,348. This configuration suggests the shorter-term trend supports the recent rebound, but the broader recovery remains capped by medium-term resistance.
The RSI hovers around 52, suggesting balanced momentum, while the MACD remains in negative territory, reinforcing the idea of a tentative advance rather than a decisive breakout.
On the topside, immediate resistance emerges at the 100-day EMA around $2,348, followed by the 38.2% Fibonacci retracement of the latest swing at approximately $2,367; a daily close above this cluster would open the way toward the 50% retracement near $2,558 and the 200-day EMA around $2,606, with the 61.8% level at $2,749 as a more distant barrier.
On the downside, initial support is provided by the 50-day EMA at $2,244, ahead of the upper boundary of the horizontal parallel channel near $2,148, while further weakness could expose the 23.6% Fibonacci level at $2,130, before the channel floor around $1,747.
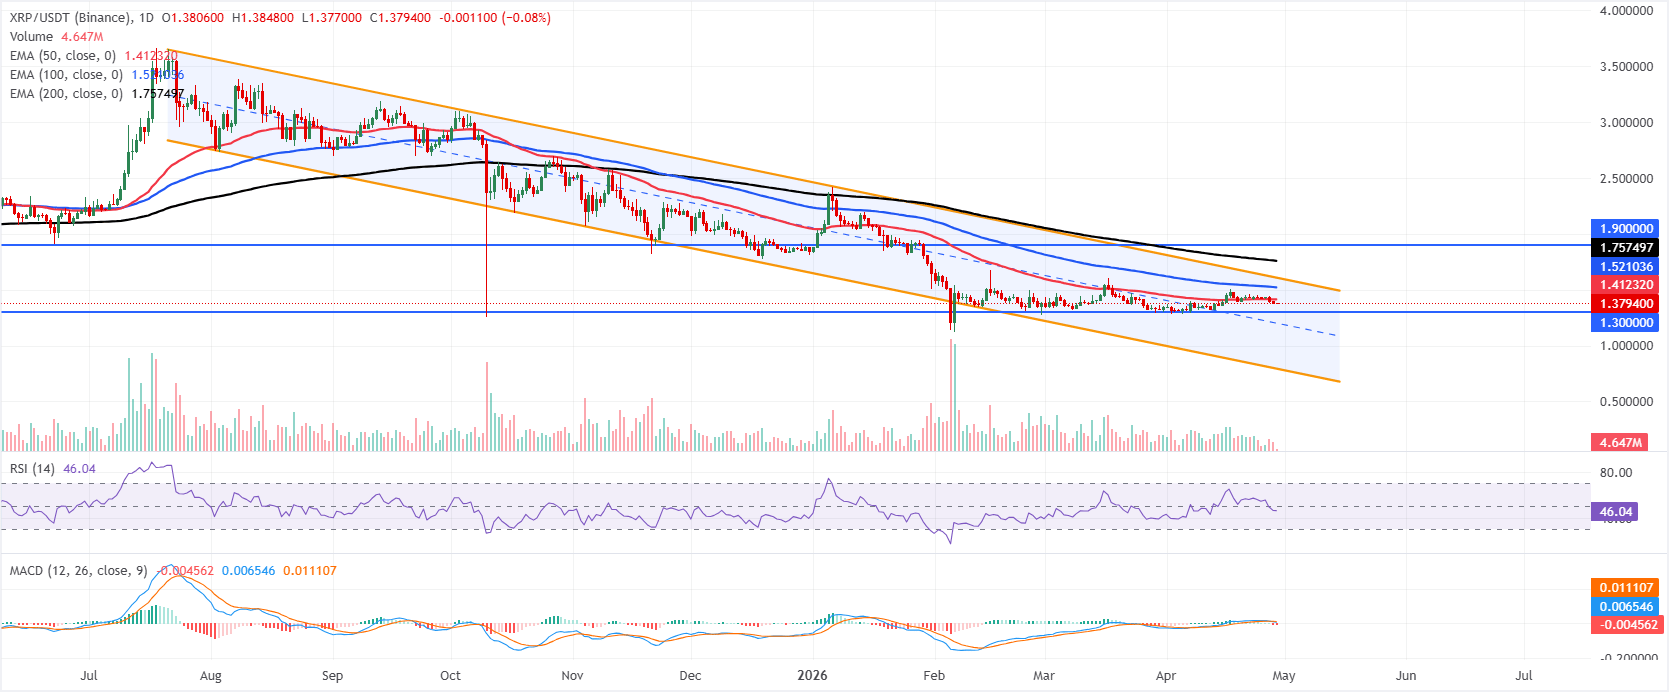
XRP slips below key 50-day EMA support
XRP is trading at $1.37 on Wednesday, keeping a bearish near-term bias as price holds within a broader downward parallel channel and below the main EMAs. The 50-day EMA at $1.41, the 100-day EMA at $1.52, and the 200-day EMA at $1.75 all sit overhead as layered dynamic resistance, suggesting rallies remain corrective within the broader decline.
Momentum backs this capped tone, with the RSI hovering around a neutral 46 and the MACD slipping further into negative territory, suggesting upside attempts could continue to fade against these EMA barriers.
On the downside, initial support emerges at the horizontal level near $1.30, where buyers previously showed interest, ahead of the parallel channel’s lower boundary around $0.79 as a more significant structural floor.
On the topside, immediate resistance is seen at the 50-day EMA around $1.41, followed by the 100-day EMA near $1.52 and the channel’s upper boundary close to $1.60; above that, the 200-day EMA at $1.75 and the horizontal cap at $1.90 form a distant supply zone that would need to be reclaimed to ease the prevailing bearish pressure.
(The technical analysis of this story was written with the help of an AI tool.)
Cryptocurrency prices FAQs
Token launches influence demand and adoption among market participants. Listings on crypto exchanges deepen the liquidity for an asset and add new participants to an asset’s network. This is typically bullish for a digital asset.
A hack is an event in which an attacker captures a large volume of the asset from a DeFi bridge or hot wallet of an exchange or any other crypto platform via exploits, bugs or other methods. The exploiter then transfers these tokens out of the exchange platforms to ultimately sell or swap the assets for other cryptocurrencies or stablecoins. Such events often involve an en masse panic triggering a sell-off in the affected assets.
Macroeconomic events like the US Federal Reserve’s decision on interest rates influence crypto assets mainly through the direct impact they have on the US Dollar. An increase in interest rate typically negatively influences Bitcoin and altcoin prices, and vice versa. If the US Dollar index declines, risk assets and associated leverage for trading gets cheaper, in turn driving crypto prices higher.
Halvings are typically considered bullish events as they slash the block reward in half for miners, constricting the supply of the asset. At consistent demand if the supply reduces, the asset’s price climbs.

Mais de um milhão de usuários confiam na FXStreet para dados de mercado em tempo real, ferramentas de gráficos, insights de especialistas e notícias de Forex. Seu calendário econômico abrangente e webinars educacionais ajudam os traders a se manterem informados e tomarem decisões calculadas. A FXStreet conta com uma equipe de cerca de 60 profissionais, divididos entre a sede em Barcelona e diversas regiões globais.
Ler mais


