
Top Crypto Gainers: Pippin rally logs over 75% gains, Aster and Kaia push higher
Por Vishal Dixit
Data de Publicação: 12 Feb 2026 | Data de Modificação: 12 Feb 2026


ARTIGOS POPULARES
Altcoins, such as Pippin (PIPPIN), Aster (ASTER) and Kaia (KAIA) continue to trade in the green, defying the broader market pullback as Bitcoin (BTC) dropped to below $68,000. PIPPIN continues to rally and ASTER and KAIA show short-term recovery with possibilities of a breakout rally.
- Pippin is up over nearly 4% so far on Thursday, extending the weekly gains to over 75% with three consecutive days of recovery.
- Aster edges higher by 3% on Thursday, extending the 6% gains from the previous day to challenge a critical resistance level.
- Kaia gains over 2% on Thursday, targeting the 200-period EMA at $0.0600 on the 4-hour chart.
Altcoins, such as Pippin (PIPPIN), Aster (ASTER) and Kaia (KAIA) continue to trade in the green, defying the broader market pullback as Bitcoin (BTC) dropped to below $68,000. PIPPIN continues to rally and ASTER and KAIA show short-term recovery with possibilities of a breakout rally.
Pippin extends the rally
Pippin shows a steady recovery following the 15% rebound on Friday, resulting in more than 75% gains so far this week. At the time of writing, PIPPIN is up nearly 4% on Thursday, surpassing the $0.5000 psychological mark.
On its third consecutive day of recovery, PIPPIN targets the 61.8% Fibonacci retracement level at $0.5045, measured from the December 24 high at $0.7200 to the February 5 low at $0.1559. The overhead targets lie at the 78.6% Fibonacci retracement level at $0.5993, followed by the $0.7200 peak from December 16.
The meme coin is trading significantly above the upward-sloping 50-day and 200-day Exponential Moving Averages (EMAs) in a bullish alignment, which supports the buy-side bias. A decisive close above the $0.5306 resistance, which has previously capped gains since mid-December, could extend the Pippin rally.
The technical indicators on the daily chart suggest rising bullish momentum: the Relative Strength Index (RSI) at 67 approaches the overbought zone, and the Moving Average Convergence Divergence (MACD) rises above the zero line as the histogram expands.
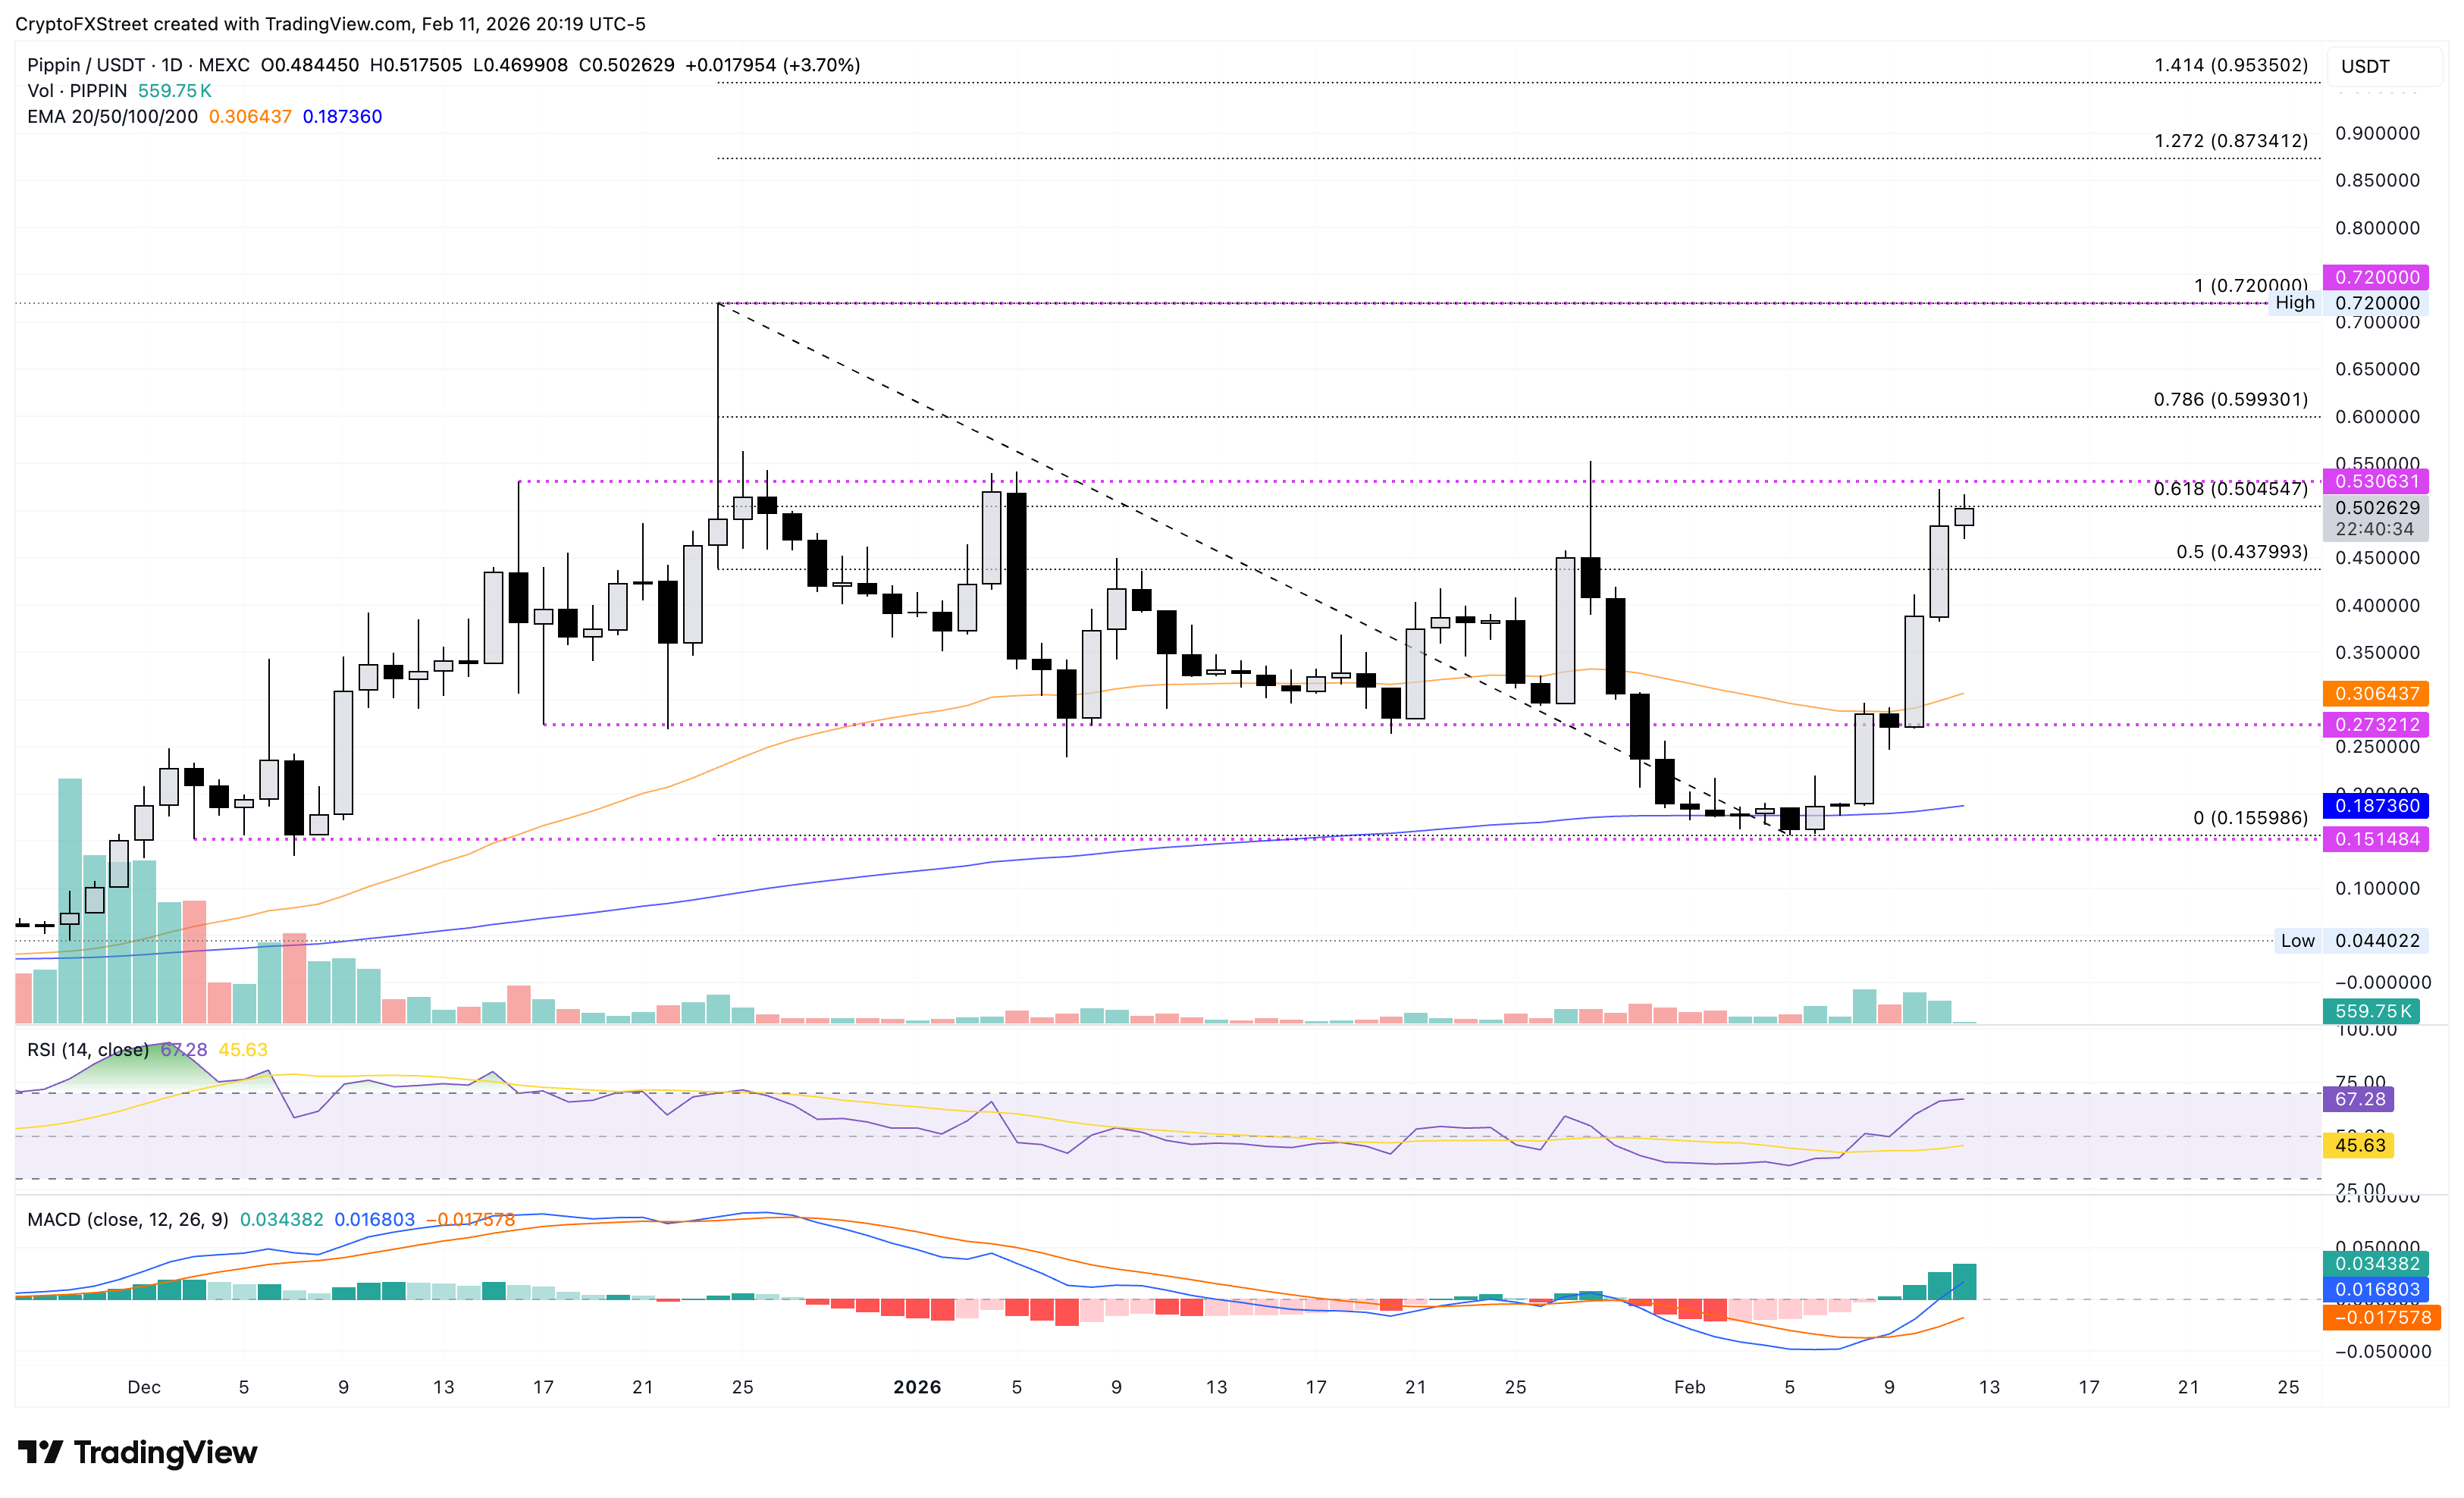
On the downside, the crucial support remains at the 50% retracement level at $0.4379.
Aster challenges a crucial resistance zone
Aster has maintained a steady recovery since hitting its all-time low of $0.403 on February 6, resulting in over 50% gains in the last six days. The perpetual-focused exchange token trades above $0.700 at press time on Thursday, with 3% gains so far on the day.
Aster challenges the R1 pivot point at $0.718 on the 4-hour chart after bouncing off the 200-period EMA at $0.640. A decisive close above this level could extend its rally to the R2 pivot point at $0.812.
Technical indicators on the 4-hour chart support the likelihood of a potential breakout rally, as the RSI at 69 hovers near the overbought boundary, while the MACD and signal line indicate a steady recovery, suggesting a surge in bullish momentum.
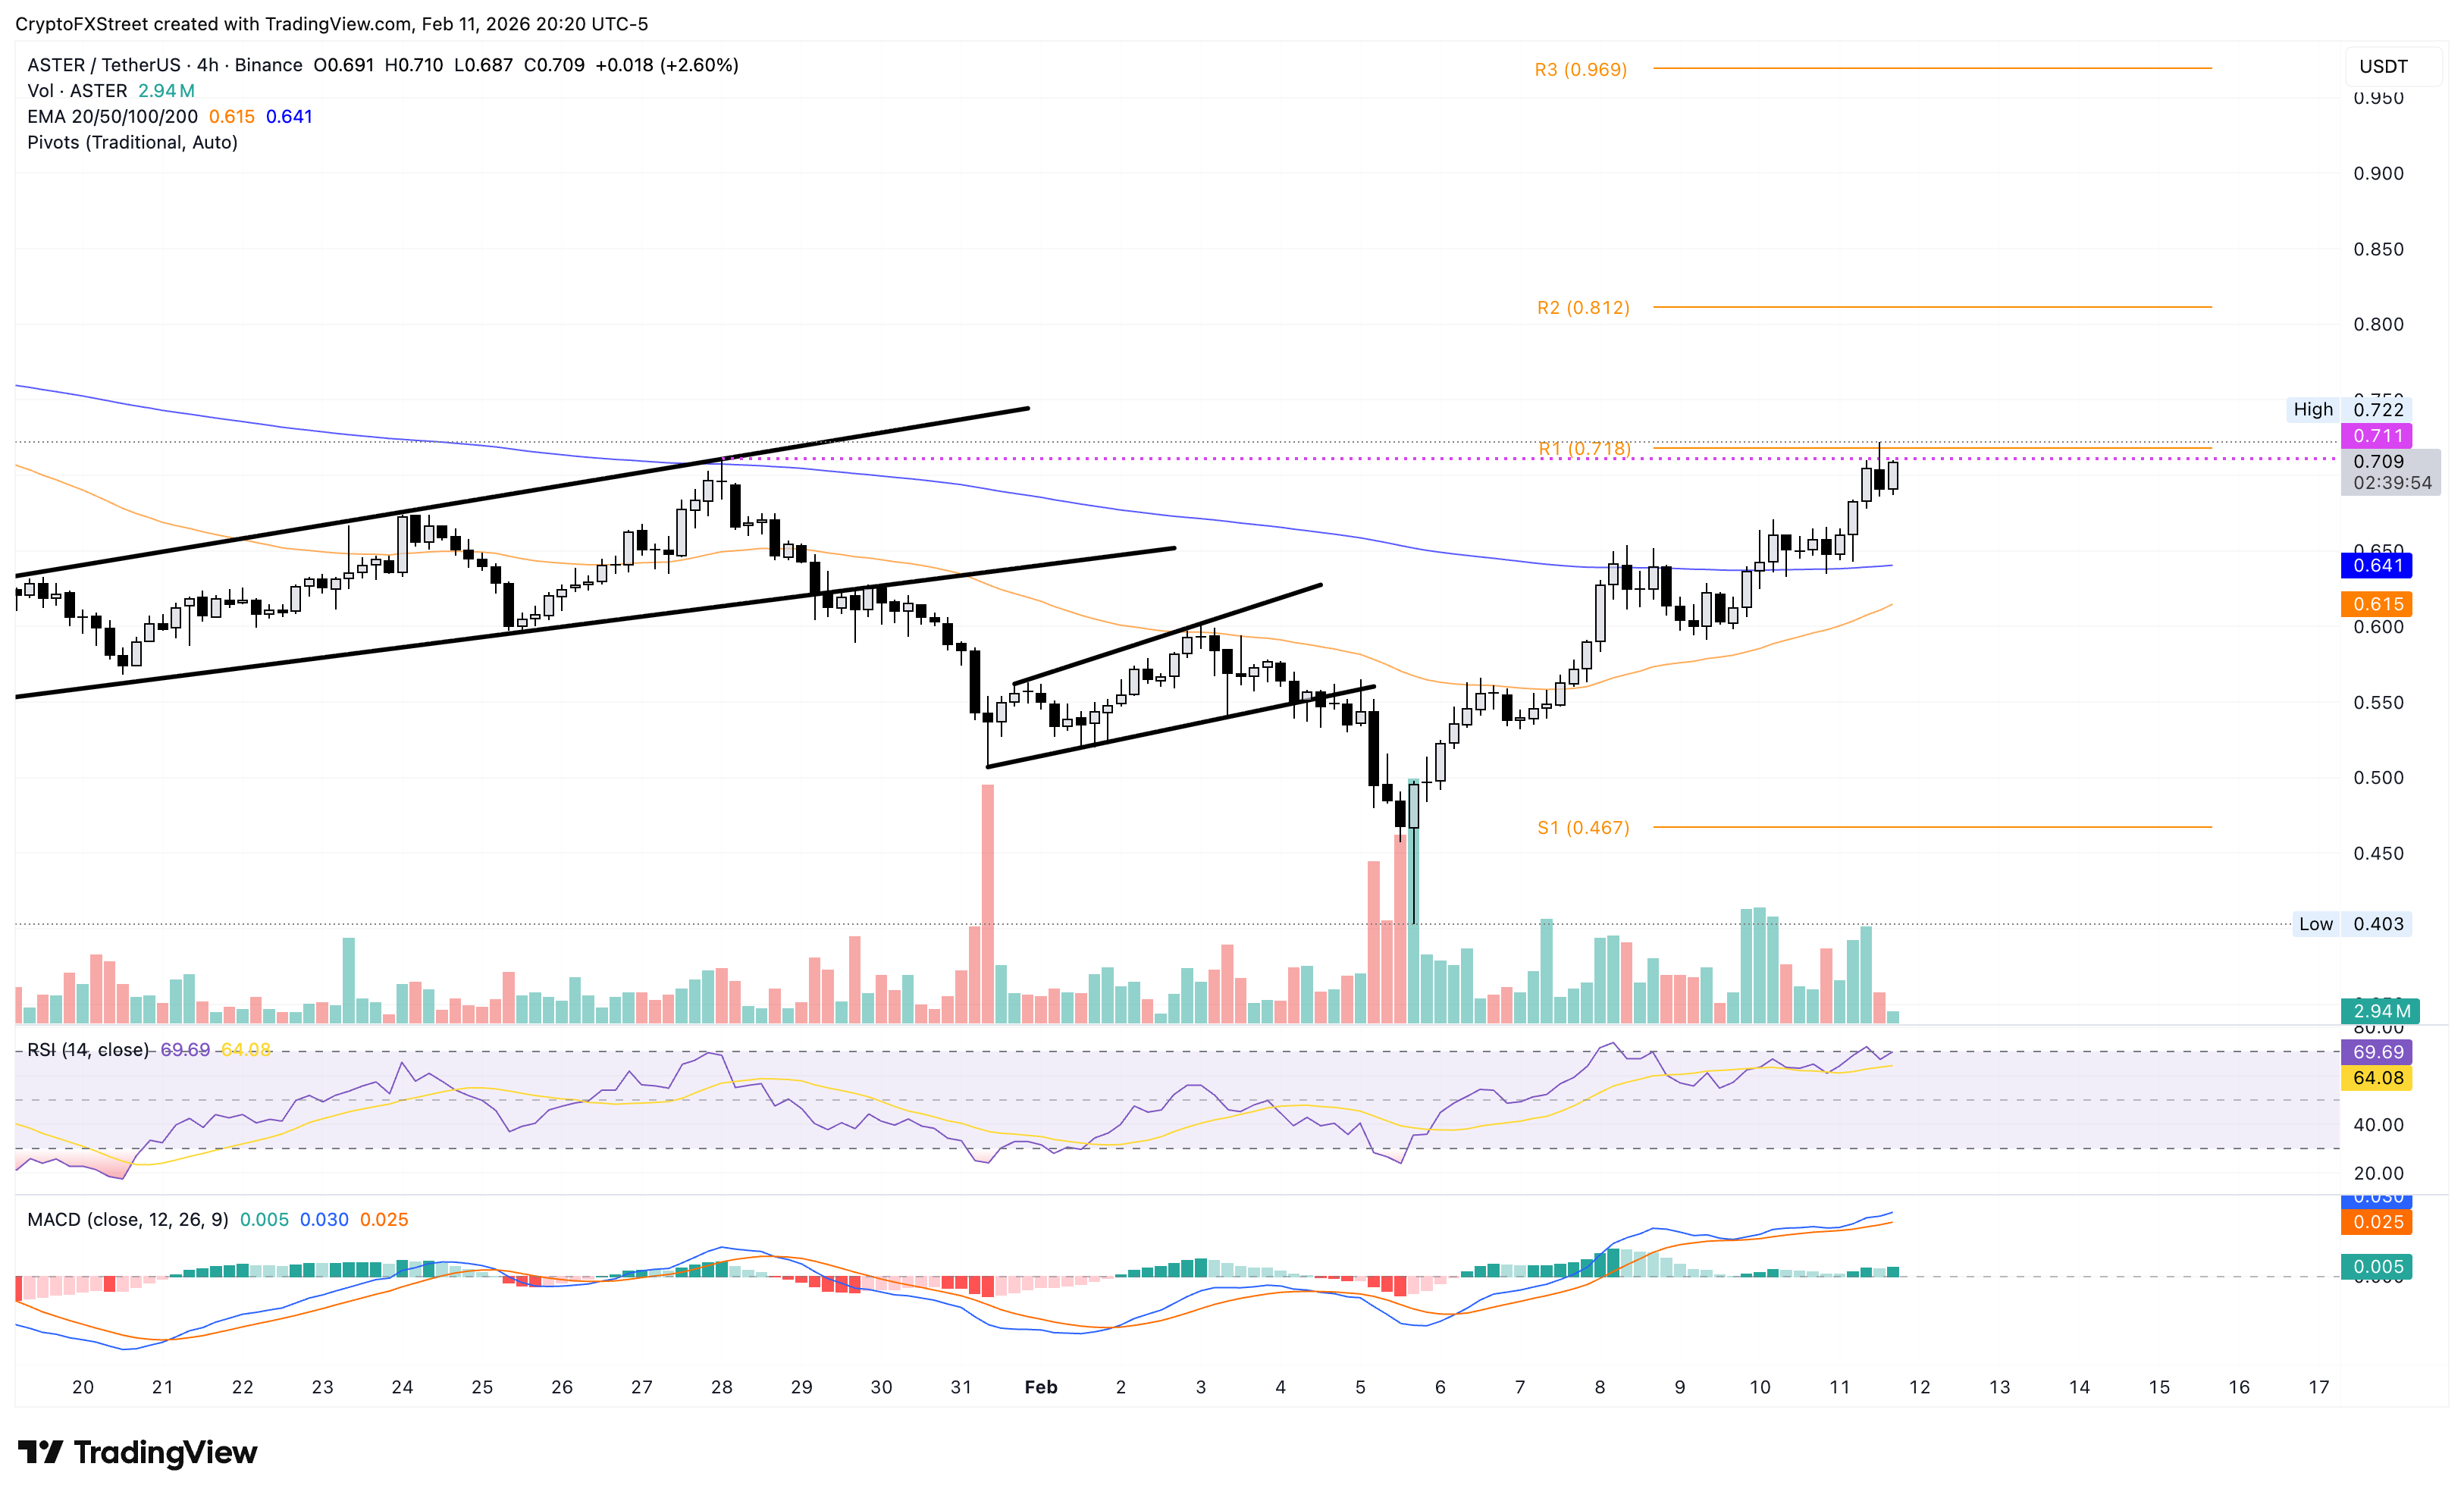
On the flip side, the crucial support remains the 200-period EMA at $0.640, followed by the 50-period EMA at $0.614.
Kaia breakout rally stands at a crucial crossroads
Kaia breaks out of a falling wedge pattern on the 4-hour chart formed since early February, reflecting an upside release of the trapped momentum. KAIA is up over 2% at the time of writing on Thursday, crossing above its 50-period EMA on the same chart at $0.0558.
A decisive close above this level could extend the recovery to the 200-period EMA at $0.0600, which serves as the immediate resistance. Beyond this, the R1 pivot point at $0.0645 could serve as the secondary target.
The RSI at 59 surpasses the midline and approaches the overbought zone, suggesting a rise in buying pressure. Meanwhile, the MACD rises above the zero line as positive histograms expand, suggesting increasing buying pressure.
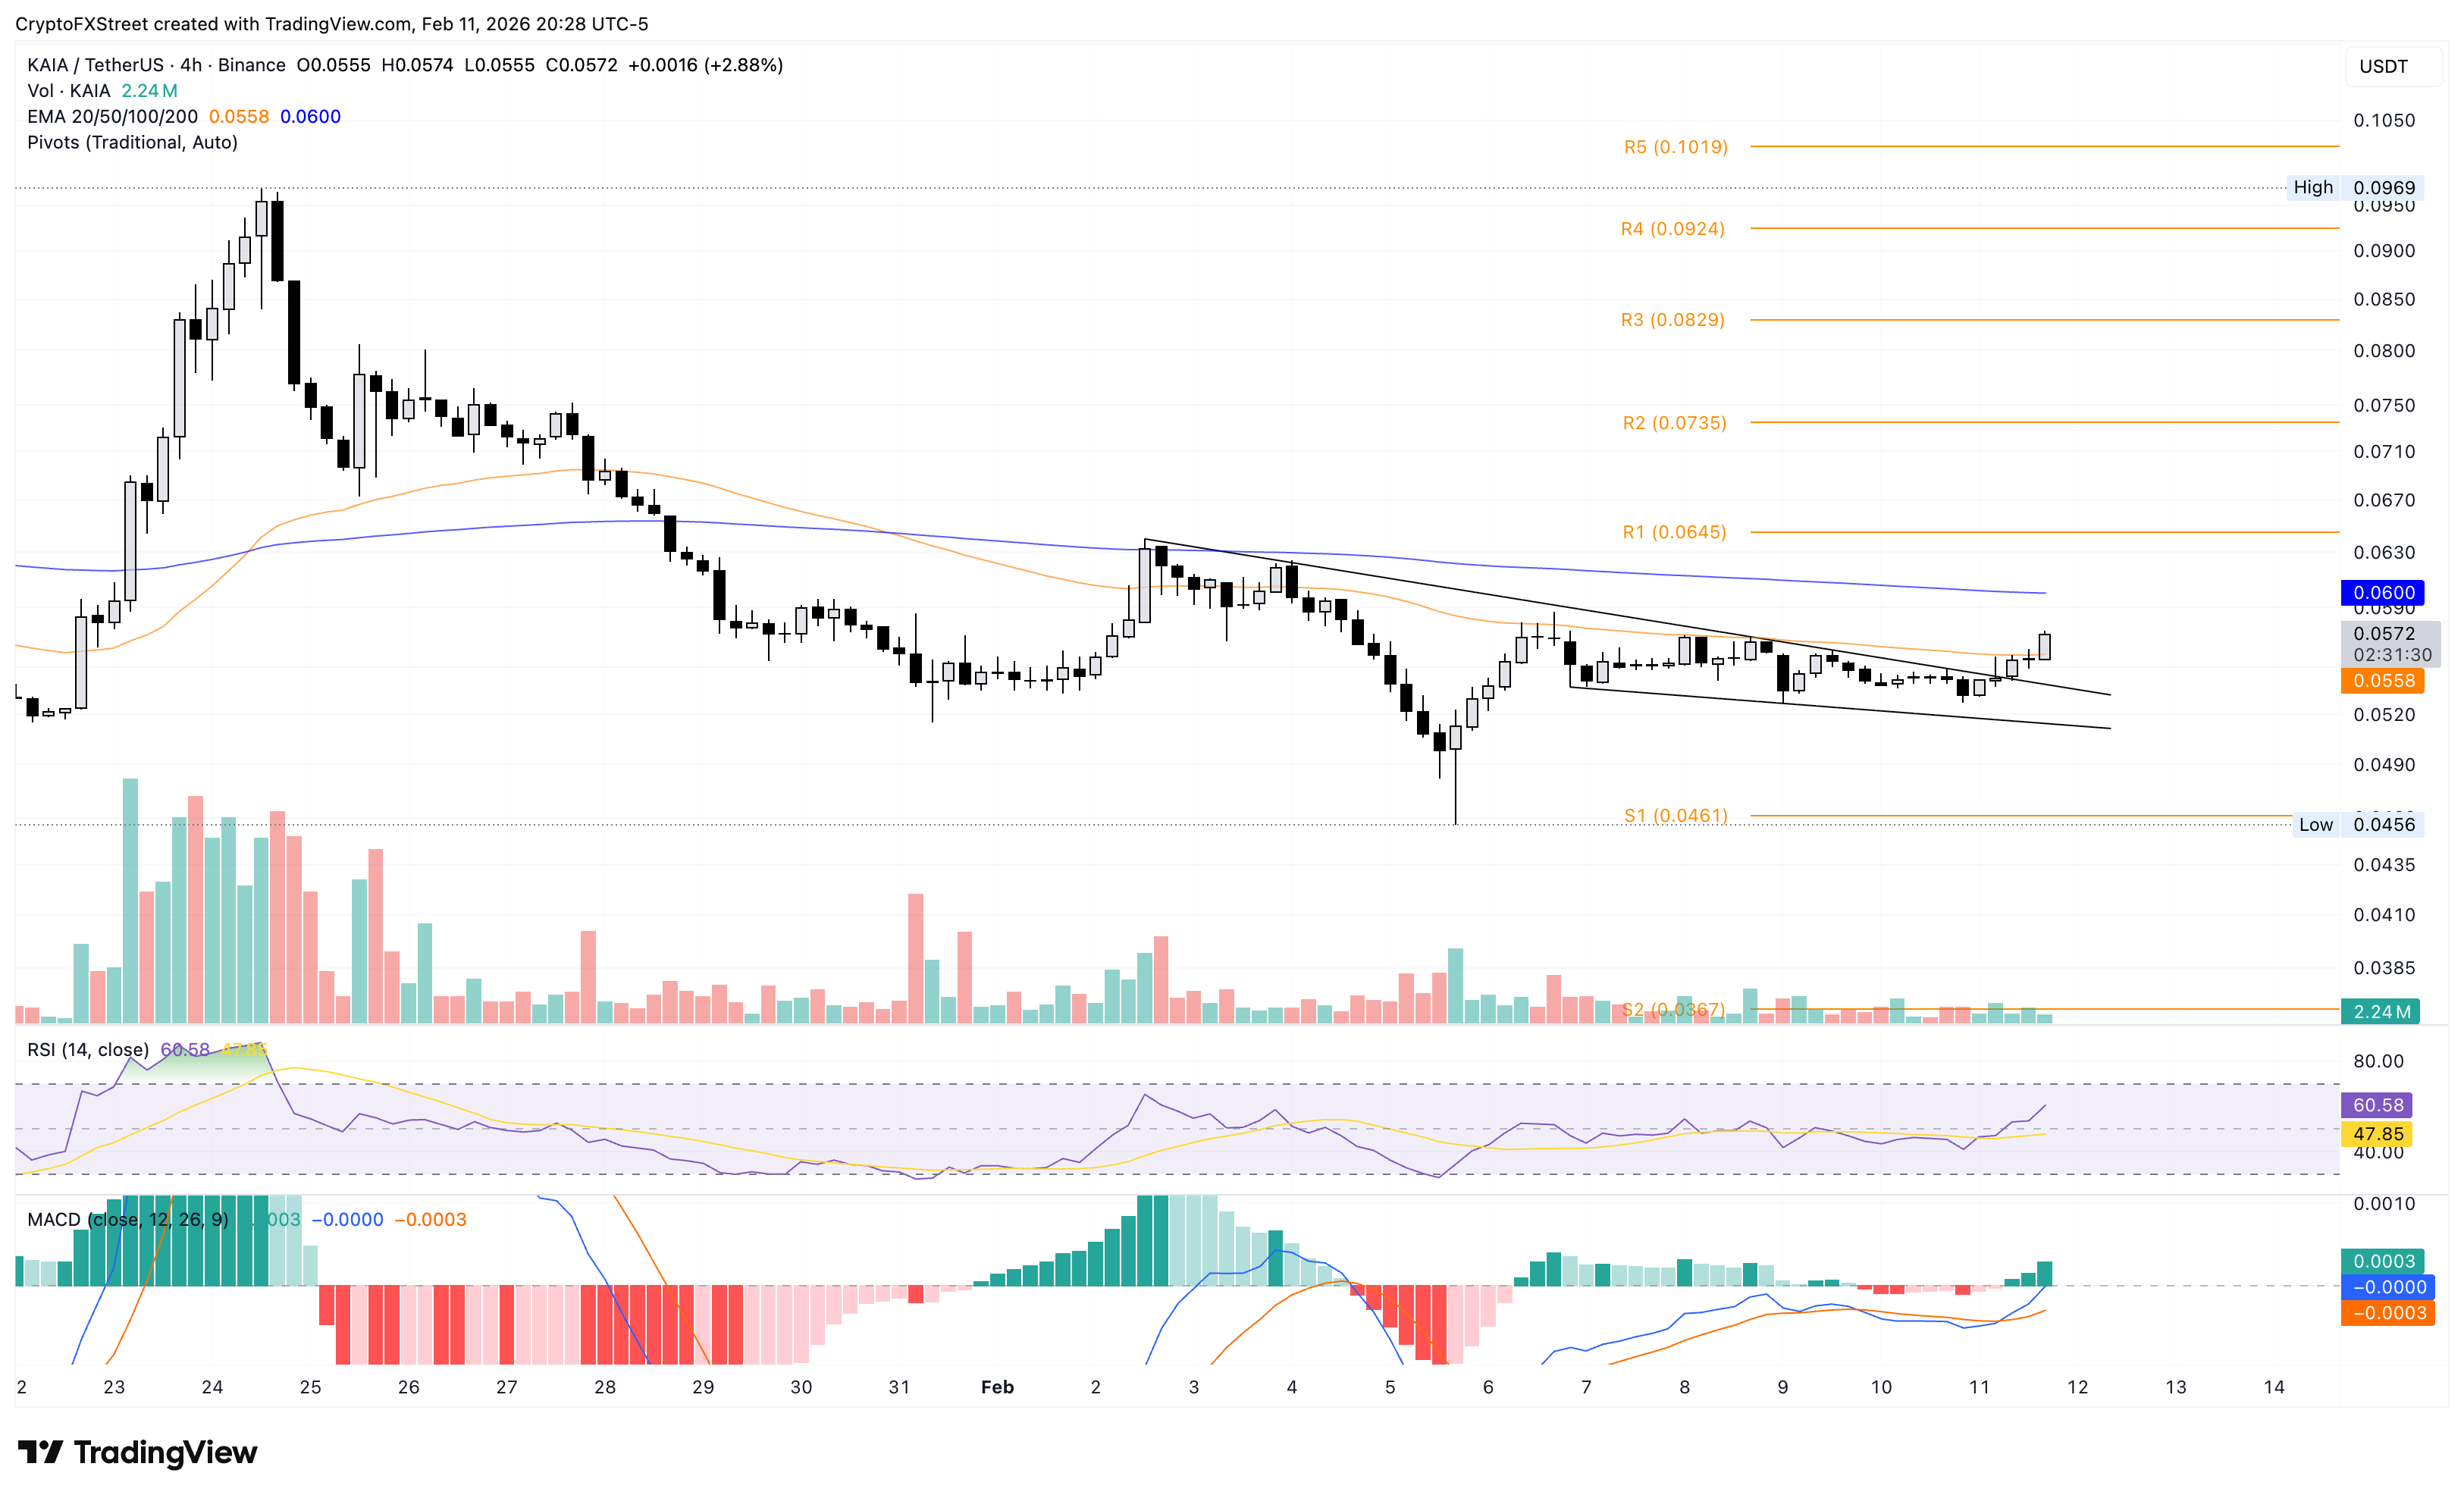
However, if Kaia fails to secure a 4-hour candle close above the 50-period EMA, it could increase downside pressure, likely leading to a retest of the $0.0500 psychological level.

Mais de um milhão de usuários confiam na FXStreet para dados de mercado em tempo real, ferramentas de gráficos, insights de especialistas e notícias de Forex. Seu calendário econômico abrangente e webinars educacionais ajudam os traders a se manterem informados e tomarem decisões calculadas. A FXStreet conta com uma equipe de cerca de 60 profissionais, divididos entre a sede em Barcelona e diversas regiões globais.
Ler mais


