
Top Layer 2 Networks Price Prediction: Mantle, Arbitrum, Optimism
Por Michael Ebiekutan
Data de Publicação: 10 Feb 2026 | Data de Modificação: 10 Feb 2026


ARTIGOS POPULARES

Layer 2 Networks have been in the limelight over the past week following a tweak in Ethereum's rollup-centric roadmap and criticisms from Ethereum co-founder Vitalik Buterin.
- Mantle is likely to test $0.84 if it rises above $0.68.
- ARB could move upwards to $0.171 if it flips $0.126 and the 20-day EMA.
- OP may retest its all-time low at $0.16.
Layer 2 Networks have been in the limelight over the past week following a tweak in Ethereum's rollup-centric roadmap and criticisms from Ethereum co-founder Vitalik Buterin.
The conversation, which sparked a back-and-forth between a few L2 founders and community members, saw a few Layer 2 tokens establishing new lows amid the wider crypto market decline.
Mantle eyes rise above $0.68
Mantle (MNT) is consolidating and attempting to reclaim $0.68 after bouncing off $0.51 last Friday. The Layer-2 token could test $0.84 if it rises above $0.68. However, it faces potential resistance at the 20-day Exponential Moving Average (EMA), which has proven a major hurdle since last December.
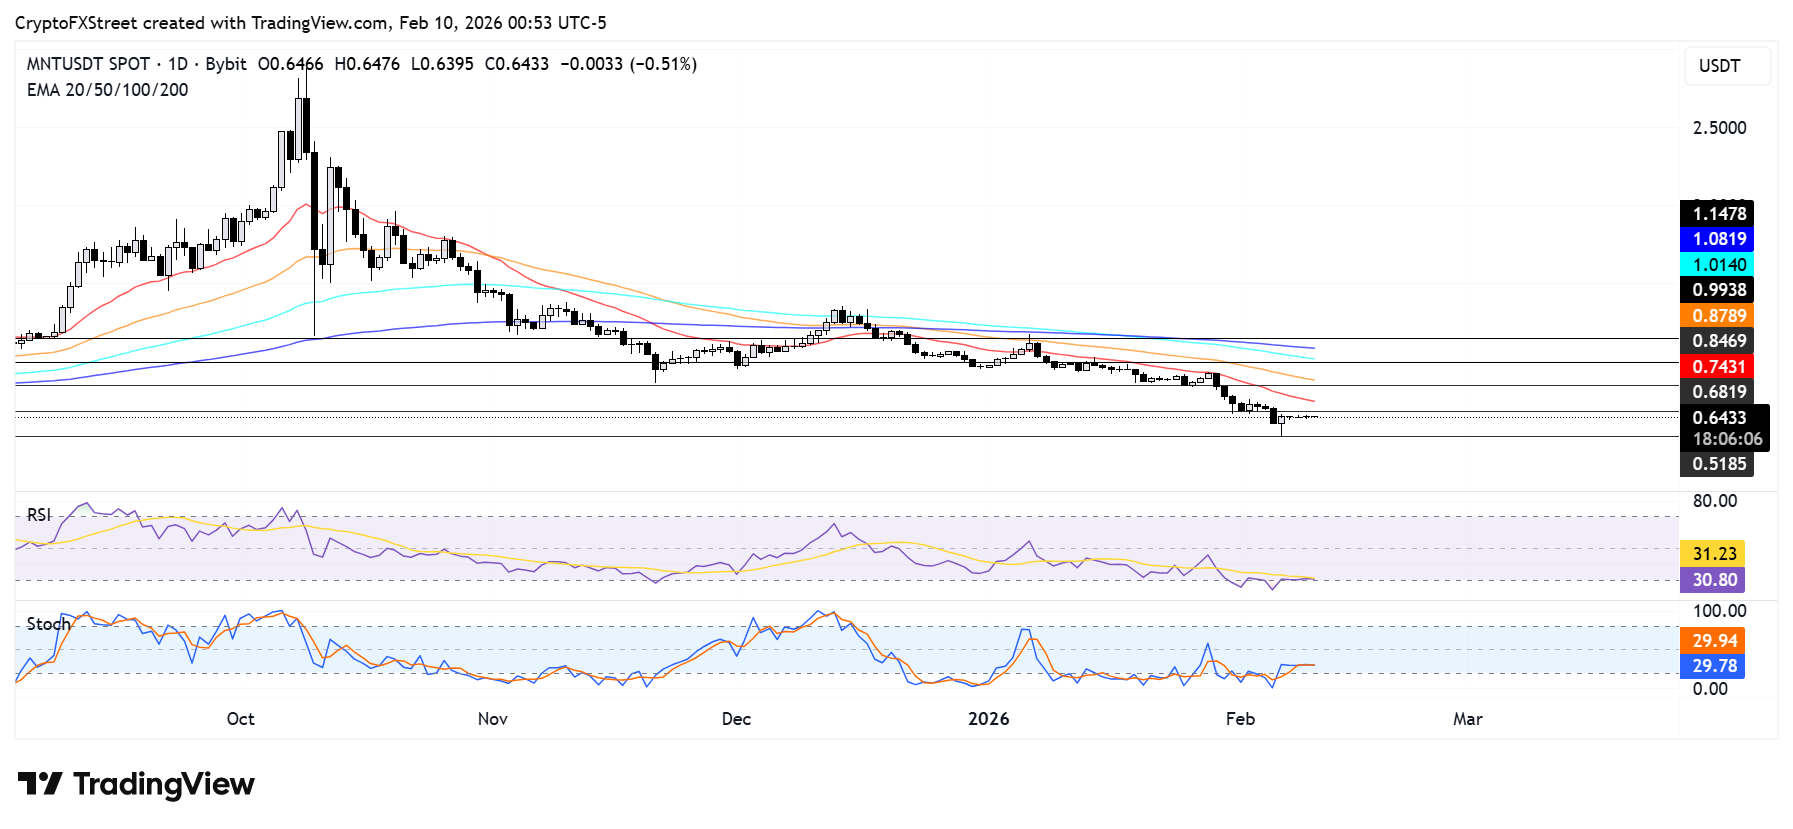
On the downside, MNT could find support at $0.51 if it sees a rejection near $0.68.
The Relative Strength Index (RSI) and Stochastic Oscillator (Stoch) indicators on the daily chart are slightly above their oversold regions, indicating a modest decline in bearish momentum.
MNT is trading at $0.64 on Tuesday, down 0.1% over the past 24 hours at the time of publication.
Arbitrum could see a new low if it breaches $0.096
Arbitrum (ARB) is declining at the time of writing on Tuesday, approaching Friday's low of $0.096, its all-time low. The move comes after seeing a rejection at the $0.126 resistance over the weekend.
ARB could rise to $0.171 if it flips $0.126 and the 20-day EMA. On the downside, a breach of $0.096 could push the token to a new low of $0.063.
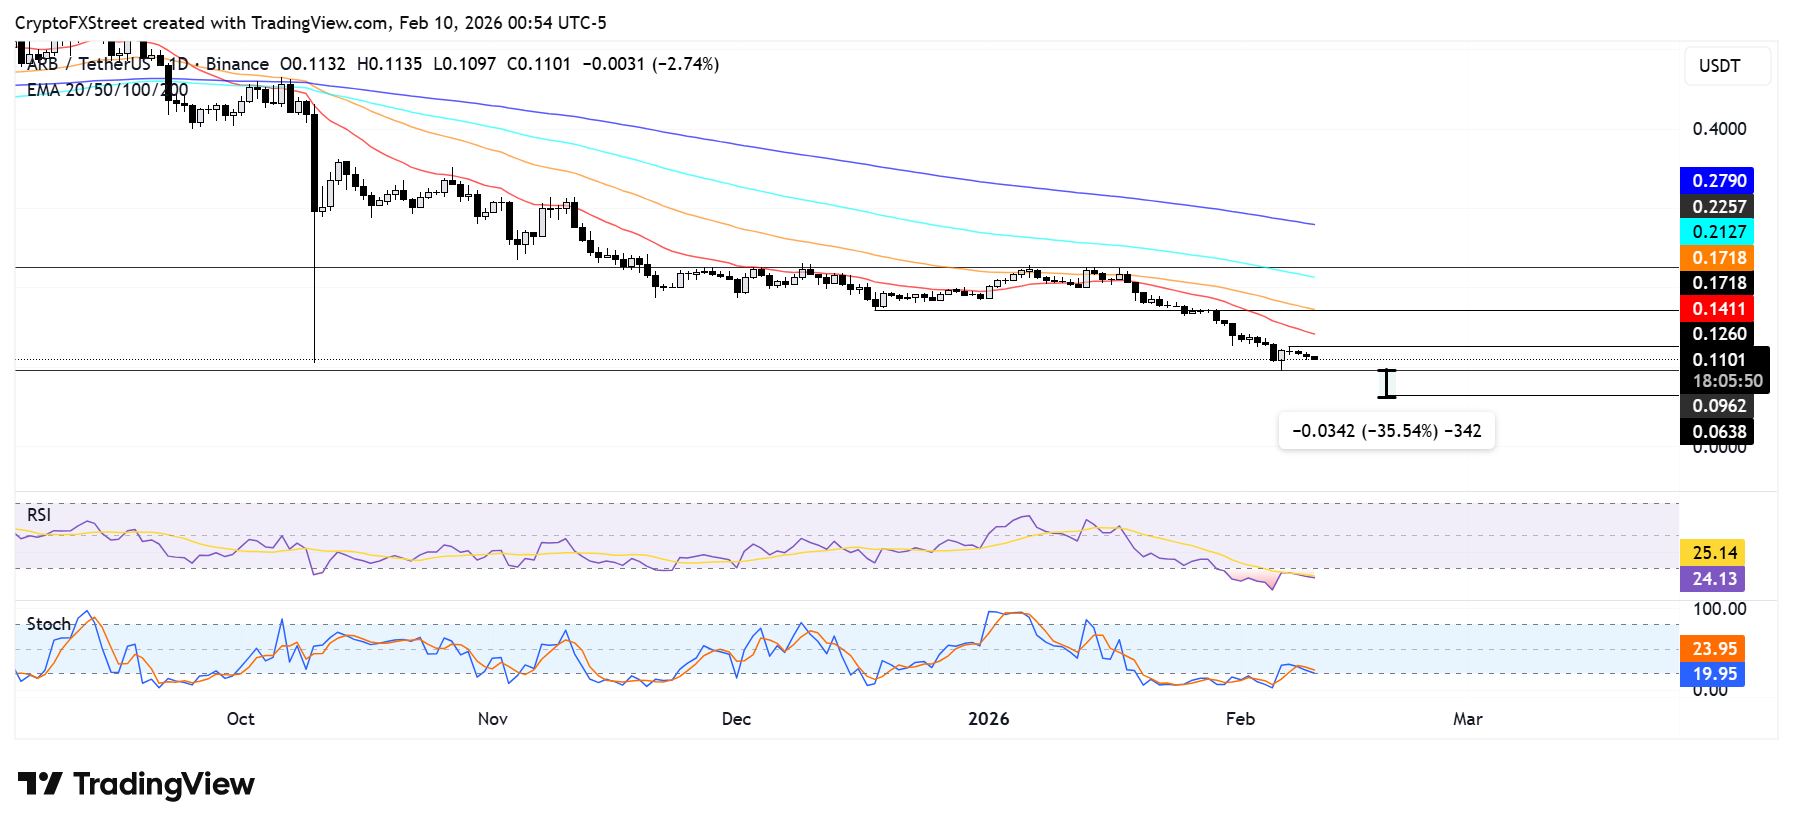
The RSI and Stoch indicators on the daily chart are in oversold territory, indicating a dominant bearish momentum.
ARB is changing hands at $0.11, down nearly 5% over the past 24 hours as of writing.
OP eyes downside after rejection at $0.20
Optimism (OP) is consolidating after seeing a rejection at $0.20 over the weekend. The token is tilted toward the downside and could retest its all-time low at $0.16.
On the upside, OP could rise to test $0.24, just below the 20-day EMA, if it reclaims $0.20.
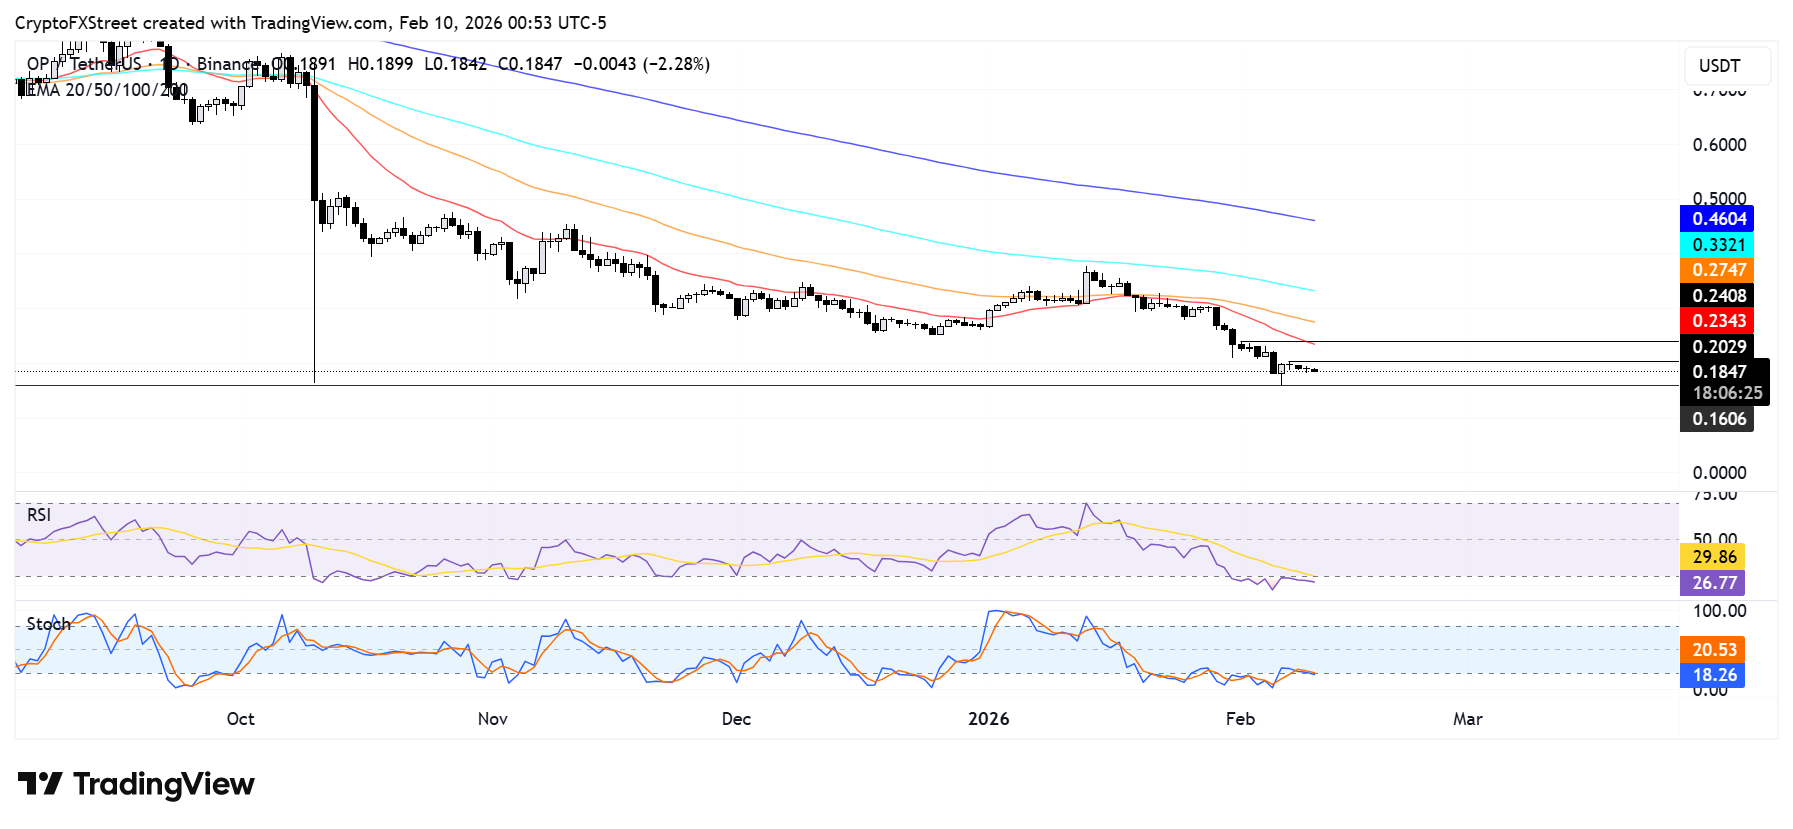
The RSI and Stoch indicators on the daily chart are in oversold conditions, indicating a continued dominance in bearish momentum.
OP is trading around $0.18, down 3% over the past 24 hours at the time of publication.

Mais de um milhão de usuários confiam na FXStreet para dados de mercado em tempo real, ferramentas de gráficos, insights de especialistas e notícias de Forex. Seu calendário econômico abrangente e webinars educacionais ajudam os traders a se manterem informados e tomarem decisões calculadas. A FXStreet conta com uma equipe de cerca de 60 profissionais, divididos entre a sede em Barcelona e diversas regiões globais.
Ler mais


