
USD/CHF Price Forecast: Clears 50-day SMA as bulls target 0.7900
Por Christian Borjon Valencia
Atualizado: 2 Jun 2026


ARTIGOS POPULARES

The USD/CHF edges modestly higher, gaining 0.21% as buyers test the current week’s high of 0.7884 after bouncing off daily lows of 0.7844.
- USD/CHF clears 50-day SMA, strengthening short-term bullish bias.
- RSI remains bullish, signaling buyers retain upside momentum control.
- Break above 0.7900 exposes 0.7958 and 0.8000 resistance.
The USD/CHF edges modestly higher, gaining 0.21% as buyers test the current week’s high of 0.7884 after bouncing off daily lows of 0.7844.
Risk appetite is positive due to the AI hype. In the meantime, the Greenback stages a recovery amid uncertainty over the outcome of US-Iran talks.
USD/CHF Price Forecast: Technical outlook
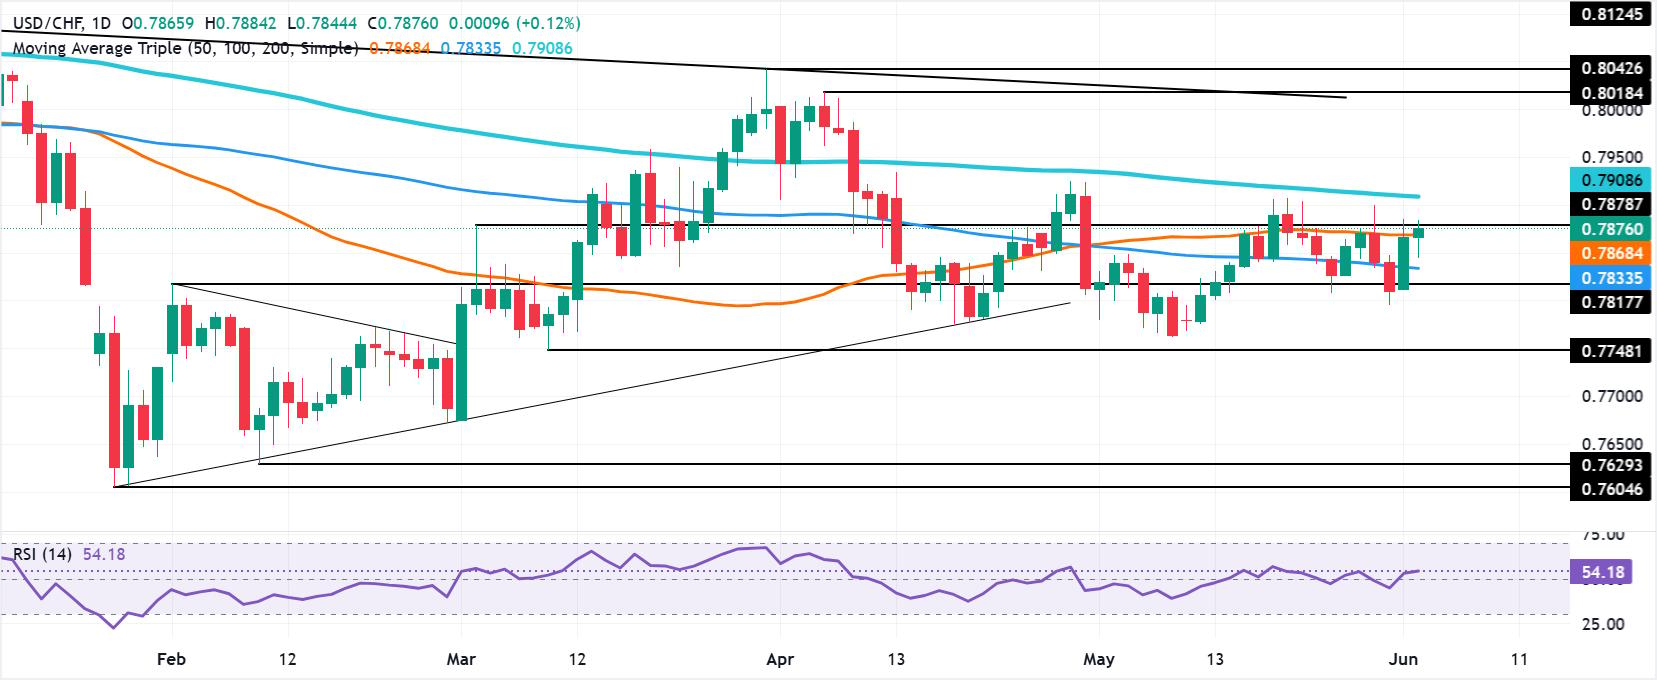
From a technical standpoint, further upside is seen as the pair cleared the 50-day Simple Moving Average (SMA) at 0.7864. Worth noting that the Relative Strength Index (RSI) is bullish, which could open the door for further gains.
If the USD/CHF surpasses the 0.7900 area, a test of the 200-day SMA at 0.7904 is on the cards. Above the latter, the path clears to challenge the March 19 high at 0.7958, ahead of the 0.80 figure.
Conversely, a retracement below the 50-day SMA, and sellers could re-enter the market, pushing the pair towards the 20-day SMA at 0.7834, ahead of the 100-day SMA at 0.7828. The next area of interest would be the 0.7800 mark
USD/CHF Price Chart – Daily
Swiss Franc Price Today
The table below shows the percentage change of Swiss Franc (CHF) against listed major currencies today. Swiss Franc was the strongest against the New Zealand Dollar.
| USD | EUR | GBP | JPY | CAD | AUD | NZD | CHF | |
|---|---|---|---|---|---|---|---|---|
| USD | 0.05% | -0.07% | 0.18% | -0.05% | -0.27% | 0.16% | 0.15% | |
| EUR | -0.05% | -0.11% | 0.11% | -0.11% | -0.32% | 0.12% | 0.09% | |
| GBP | 0.07% | 0.11% | 0.22% | -0.00% | -0.17% | 0.24% | 0.18% | |
| JPY | -0.18% | -0.11% | -0.22% | -0.22% | -0.42% | -0.01% | -0.05% | |
| CAD | 0.05% | 0.11% | 0.00% | 0.22% | -0.21% | 0.21% | 0.16% | |
| AUD | 0.27% | 0.32% | 0.17% | 0.42% | 0.21% | 0.40% | 0.36% | |
| NZD | -0.16% | -0.12% | -0.24% | 0.01% | -0.21% | -0.40% | -0.05% | |
| CHF | -0.15% | -0.09% | -0.18% | 0.05% | -0.16% | -0.36% | 0.05% |
The heat map shows percentage changes of major currencies against each other. The base currency is picked from the left column, while the quote currency is picked from the top row. For example, if you pick the Swiss Franc from the left column and move along the horizontal line to the US Dollar, the percentage change displayed in the box will represent CHF (base)/USD (quote).

Mais de um milhão de usuários confiam na FXStreet para dados de mercado em tempo real, ferramentas de gráficos, insights de especialistas e notícias de Forex. Seu calendário econômico abrangente e webinars educacionais ajudam os traders a se manterem informados e tomarem decisões calculadas. A FXStreet conta com uma equipe de cerca de 60 profissionais, divididos entre a sede em Barcelona e diversas regiões globais.
Ler mais


