
USD/CHF Price Forecast: Slides below 200-day SMA, bears gain steam
Por Christian Borjon Valencia
Atualizado: 8 Apr 2026


ARTIGOS POPULARES

The USD/CHF retreats some 0.85% on Wednesday after failing to clear the April 7 daily high of 0.8010, and as the pair slides beneath the 200-day SMA of 0.7940, as market sentiment gets lifted by a two-week ceasefire in the Middle East conflict.
- USD/CHF drops below 200-day SMA as risk sentiment improves sharply.
- RSI turns lower, signaling growing bearish momentum in near term.
- Failure to reclaim 0.7940 exposes 0.7812 support and deeper downside.
The USD/CHF retreats some 0.85% on Wednesday after failing to clear the April 7 daily high of 0.8010, and as the pair slides beneath the 200-day SMA of 0.7940, as market sentiment gets lifted by a two-week ceasefire in the Middle East conflict. The pair trades at 0.7909 after reaching a high of 0.7980.
USD/CHF Price Forecast: Technical Outlook
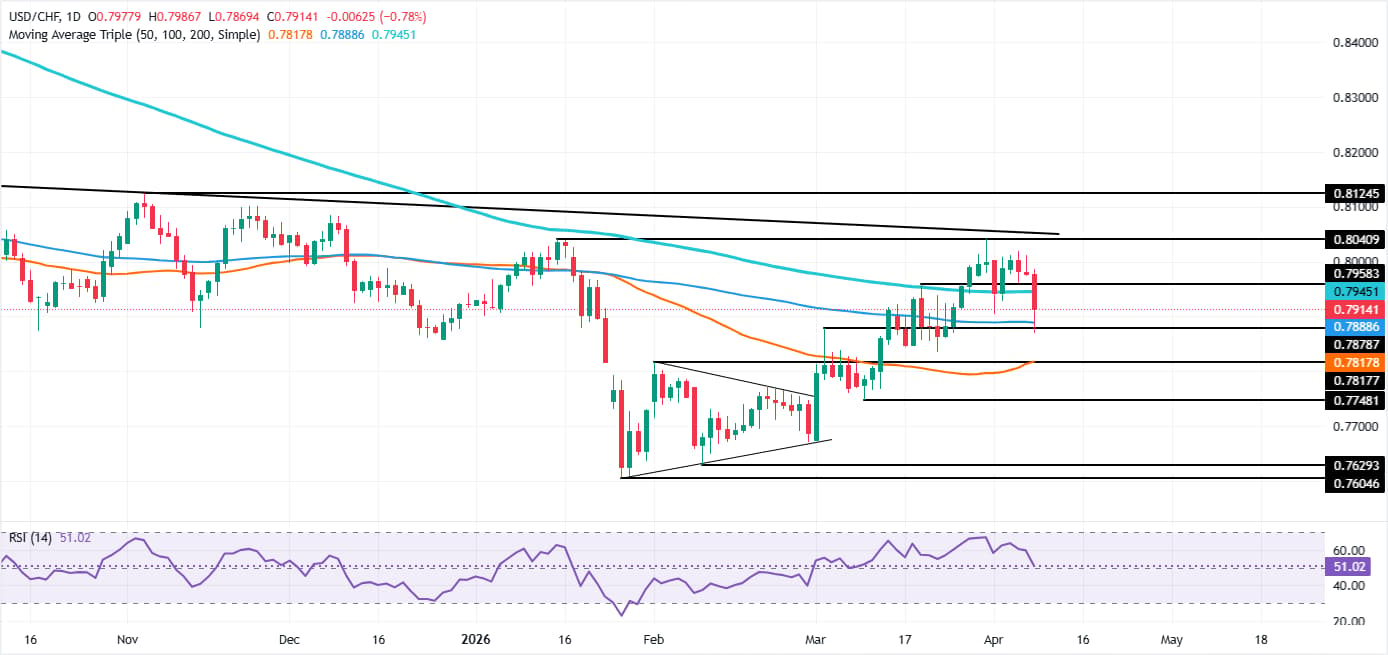
Despite retreating, the USD/CHF remains upward-biased, bouncing off key support at the March 3 daily high, which turned into support at 0.7879, reclaiming the 100-day Simple Moving Average (SMA) at 0.7886, and climbing above 0.7900.
The Relative Strength Index (RSI) is above the neutral level but is plunging and poised to turn bearish, an indication that sellers are gaining momentum. Should price action follow suit the RSI, the USD/CHF could challenge the 50-day SMA at 0.7812 in the short term.
Otherwise, if USD/CHF climbs back above the 200-day SMA at 0.7940, a move back towards 0.8000 is on the cards..
USD/CHF Price Chart — Daily
Swiss Franc Price Today
The table below shows the percentage change of Swiss Franc (CHF) against listed major currencies today. Swiss Franc was the strongest against the US Dollar.
| USD | EUR | GBP | JPY | CAD | AUD | NZD | CHF | |
|---|---|---|---|---|---|---|---|---|
| USD | -0.63% | -0.83% | -0.63% | -0.27% | -0.98% | -1.52% | -0.80% | |
| EUR | 0.63% | -0.21% | 0.00% | 0.36% | -0.35% | -0.94% | -0.19% | |
| GBP | 0.83% | 0.21% | 0.21% | 0.58% | -0.11% | -0.68% | 0.03% | |
| JPY | 0.63% | 0.00% | -0.21% | 0.36% | -0.31% | -0.88% | -0.17% | |
| CAD | 0.27% | -0.36% | -0.58% | -0.36% | -0.68% | -1.24% | -0.54% | |
| AUD | 0.98% | 0.35% | 0.11% | 0.31% | 0.68% | -0.57% | 0.14% | |
| NZD | 1.52% | 0.94% | 0.68% | 0.88% | 1.24% | 0.57% | 0.72% | |
| CHF | 0.80% | 0.19% | -0.03% | 0.17% | 0.54% | -0.14% | -0.72% |
The heat map shows percentage changes of major currencies against each other. The base currency is picked from the left column, while the quote currency is picked from the top row. For example, if you pick the Swiss Franc from the left column and move along the horizontal line to the US Dollar, the percentage change displayed in the box will represent CHF (base)/USD (quote).

Mais de um milhão de usuários confiam na FXStreet para dados de mercado em tempo real, ferramentas de gráficos, insights de especialistas e notícias de Forex. Seu calendário econômico abrangente e webinars educacionais ajudam os traders a se manterem informados e tomarem decisões calculadas. A FXStreet conta com uma equipe de cerca de 60 profissionais, divididos entre a sede em Barcelona e diversas regiões globais.
Ler mais


