
USD/CHF Price Forecast: Slumps below 0.7800 after clash on 50-day SMA
Por Christian Borjon Valencia
Data de Publicação: 5 Mar 2026 | Data de Modificação: 5 Mar 2026


ARTIGOS POPULARES

USD/CHF retreats on Wednesday, down by 0.25% as the pair failed to post a daily close above the 50-day Simple Moving Average (SMA) of 0.7819. The Greenback trimmed some of its Wednesday’s gains on risk aversion.
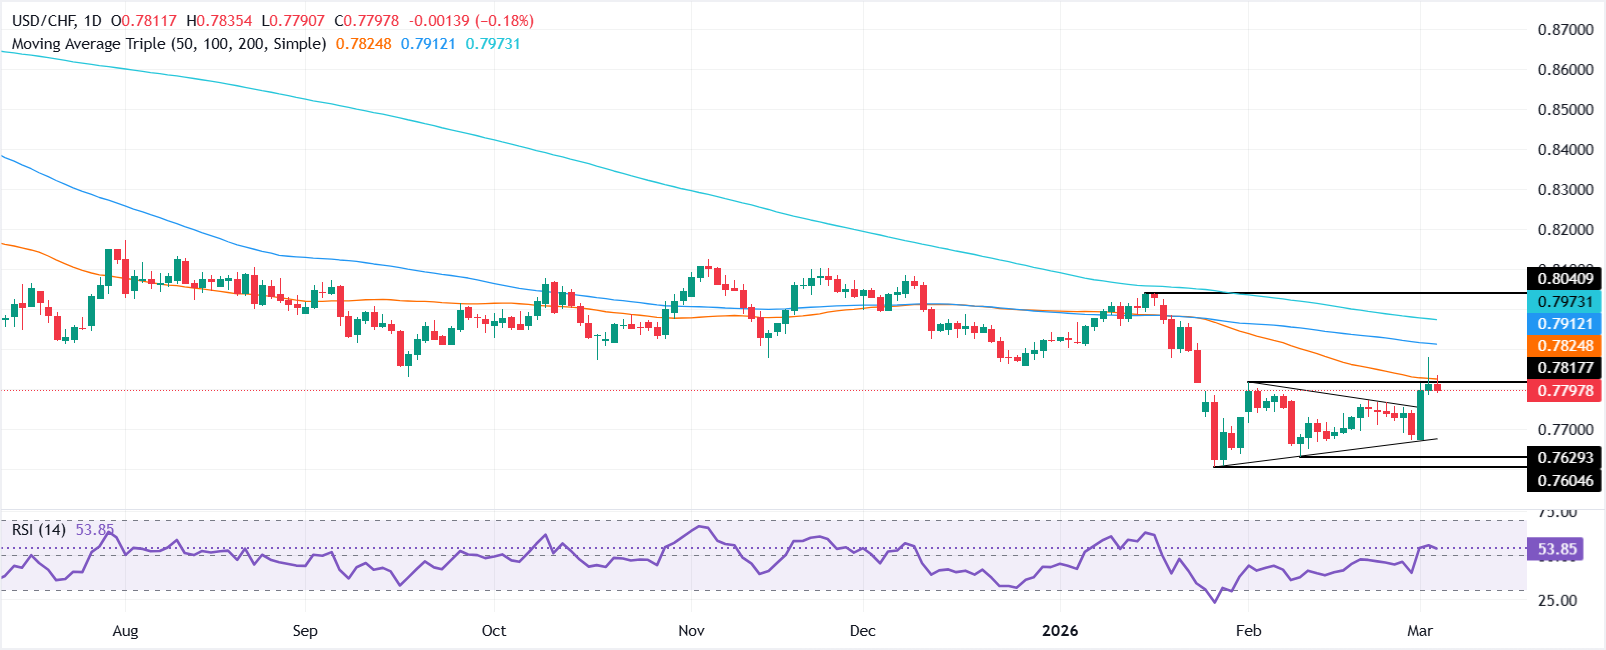
- USD/CHF falls 0.25% as rejection at 50-day SMA near 0.7819 halts rebound.
- A break above 0.7878 would expose the 100-day SMA at 0.7909.
- A drop below 0.7777 could open the door to 0.7700 and 0.7660 support.
USD/CHF retreats on Wednesday, down by 0.25% as the pair failed to post a daily close above the 50-day Simple Moving Average (SMA) of 0.7819. The Greenback trimmed some of its Wednesday’s gains on risk aversion. The pair trades below the 0.7800 figure, poised to remain glued to 'the figure' waiting for a fresh catalyst.
USD/CHF Price Forecast: Technical outlook
Price action suggests the USD/CHF downtrend remains in place, unless buyers push prices higher. The successive series of lower highs and lower lows is intact, but a challenge to the Tuesday daily high of 0.7878 would open the door to test immediate resistance at the 100-day SMA at 0.7909.
The Relative Strength Index (RSI) is bullish, but it has turned downwards, aiming for the RSI’s neutral level. This and USD/CHF’s second daily close below the 50-day SMA clears the path for a pullback.
On the downside, if the pair hurdles the Tuesday low of 0.7784, sellers could opt to challenge the 0.7700 figure. On further weakness, a key support trendline emerges at around 0.7660-0.7680.
USD/CHF Price Chart – Daily
US Dollar Price This week
The table below shows the percentage change of US Dollar (USD) against listed major currencies this week. US Dollar was the strongest against the Swiss Franc.
| USD | EUR | GBP | JPY | CAD | AUD | NZD | CHF | |
|---|---|---|---|---|---|---|---|---|
| USD | 1.20% | 0.49% | 0.71% | 0.15% | -0.31% | 0.28% | 1.60% | |
| EUR | -1.20% | -0.72% | -0.51% | -1.04% | -1.49% | -0.88% | 0.39% | |
| GBP | -0.49% | 0.72% | 0.00% | -0.33% | -0.79% | -0.18% | 1.10% | |
| JPY | -0.71% | 0.51% | 0.00% | -0.50% | -0.96% | -0.27% | 0.92% | |
| CAD | -0.15% | 1.04% | 0.33% | 0.50% | -0.50% | 0.22% | 1.43% | |
| AUD | 0.31% | 1.49% | 0.79% | 0.96% | 0.50% | 0.61% | 1.91% | |
| NZD | -0.28% | 0.88% | 0.18% | 0.27% | -0.22% | -0.61% | 1.29% | |
| CHF | -1.60% | -0.39% | -1.10% | -0.92% | -1.43% | -1.91% | -1.29% |
The heat map shows percentage changes of major currencies against each other. The base currency is picked from the left column, while the quote currency is picked from the top row. For example, if you pick the US Dollar from the left column and move along the horizontal line to the Japanese Yen, the percentage change displayed in the box will represent USD (base)/JPY (quote).

Mais de um milhão de usuários confiam na FXStreet para dados de mercado em tempo real, ferramentas de gráficos, insights de especialistas e notícias de Forex. Seu calendário econômico abrangente e webinars educacionais ajudam os traders a se manterem informados e tomarem decisões calculadas. A FXStreet conta com uma equipe de cerca de 60 profissionais, divididos entre a sede em Barcelona e diversas regiões globais.
Ler mais


