
USD/JPY Price Forecast: Rangebound below 159.50 as RSI momentum fades
Por Christian Borjon Valencia
Atualizado: 21 May 2026


ARTIGOS POPULARES

USD/JPY hovers at around 159.00, virtually unchanged, amid traders' fears that Japanese authorities might intervene in the FX markets. At the time of writing, the pair trades unchanged at around 159.02.
- USD/JPY remains trapped between 158.60 and 159.40 range.
- RSI flattens in bullish territory, signaling stalled upside momentum.
- Break below 159.00 exposes 158.78 and 158.15 supports.
USD/JPY hovers at around 159.00, virtually unchanged, amid traders' fears that Japanese authorities might intervene in the FX markets. At the time of writing, the pair trades unchanged at around 159.02.
USD/JPY Price Forecast: Technical outlook
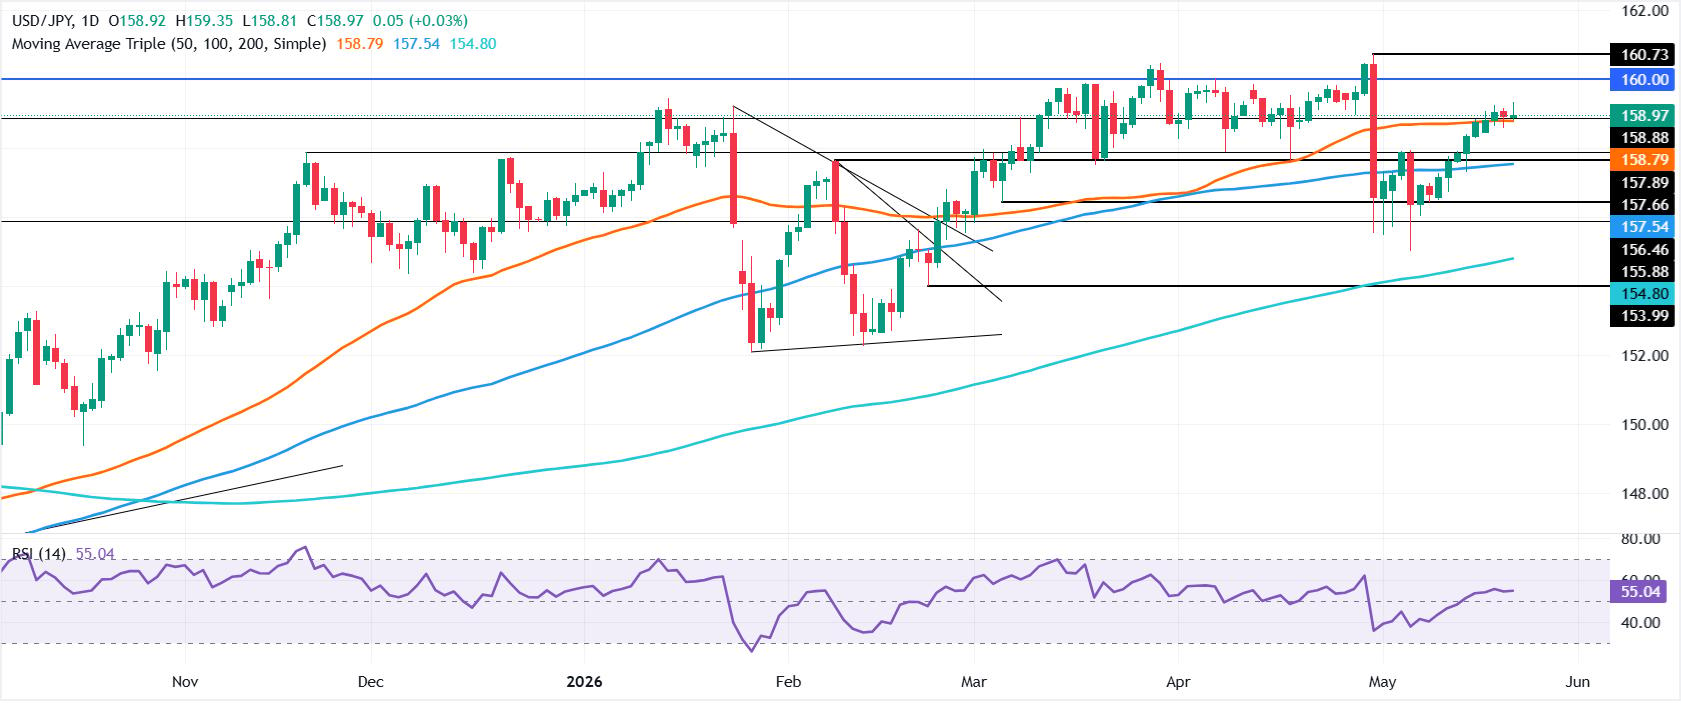
Price action remains contained within the 158.60-159.40 area, with buyers reluctant to push higher past 159.50 towards the 160.00 milestone. The confirmation of this is the Relative Strength Index (RSI) in bullish territory, but with a flattish slope during the last four trading days.
If bulls reclaim 159.50, look for a move towards the 159.75 psychological area, ahead of 160.00. Past this, the next resistance is the yearly peak at 160.73.
On the flip side, if sellers push the USD/JPY below 159.00, a move towards the 50-day Simple Moving Average (SMA) at 158.78 is on the cards. Once hurdled, the next stop would be the 20-day SMA at 158.15, followed by 158.00. On further weakness, a move towards the 100-day SMA at 157.56 is on the cards.
USD/JPY Price Chart – Daily
Japanese Yen Price This week
The table below shows the percentage change of Japanese Yen (JPY) against listed major currencies this week. Japanese Yen was the strongest against the Canadian Dollar.
| USD | EUR | GBP | JPY | CAD | AUD | NZD | CHF | |
|---|---|---|---|---|---|---|---|---|
| USD | 0.03% | -0.81% | 0.14% | 0.18% | -0.01% | -0.54% | -0.01% | |
| EUR | -0.03% | -0.86% | 0.18% | 0.14% | -0.06% | -0.51% | -0.06% | |
| GBP | 0.81% | 0.86% | 0.98% | 1.00% | 0.81% | 0.35% | 0.77% | |
| JPY | -0.14% | -0.18% | -0.98% | -0.01% | -0.23% | -0.74% | -0.19% | |
| CAD | -0.18% | -0.14% | -1.00% | 0.01% | -0.21% | -0.73% | -0.22% | |
| AUD | 0.01% | 0.06% | -0.81% | 0.23% | 0.21% | -0.45% | 0.08% | |
| NZD | 0.54% | 0.51% | -0.35% | 0.74% | 0.73% | 0.45% | 0.42% | |
| CHF | 0.00% | 0.06% | -0.77% | 0.19% | 0.22% | -0.08% | -0.42% |
The heat map shows percentage changes of major currencies against each other. The base currency is picked from the left column, while the quote currency is picked from the top row. For example, if you pick the Japanese Yen from the left column and move along the horizontal line to the US Dollar, the percentage change displayed in the box will represent JPY (base)/USD (quote).

Mais de um milhão de usuários confiam na FXStreet para dados de mercado em tempo real, ferramentas de gráficos, insights de especialistas e notícias de Forex. Seu calendário econômico abrangente e webinars educacionais ajudam os traders a se manterem informados e tomarem decisões calculadas. A FXStreet conta com uma equipe de cerca de 60 profissionais, divididos entre a sede em Barcelona e diversas regiões globais.
Ler mais


