
USD/JPY Price Forecast: Rebounds towards 159.00 as bulls target 160.00
Por Christian Borjon Valencia
Data de Publicação: 24 Mar 2026 | Data de Modificação: 24 Mar 2026


ARTIGOS POPULARES

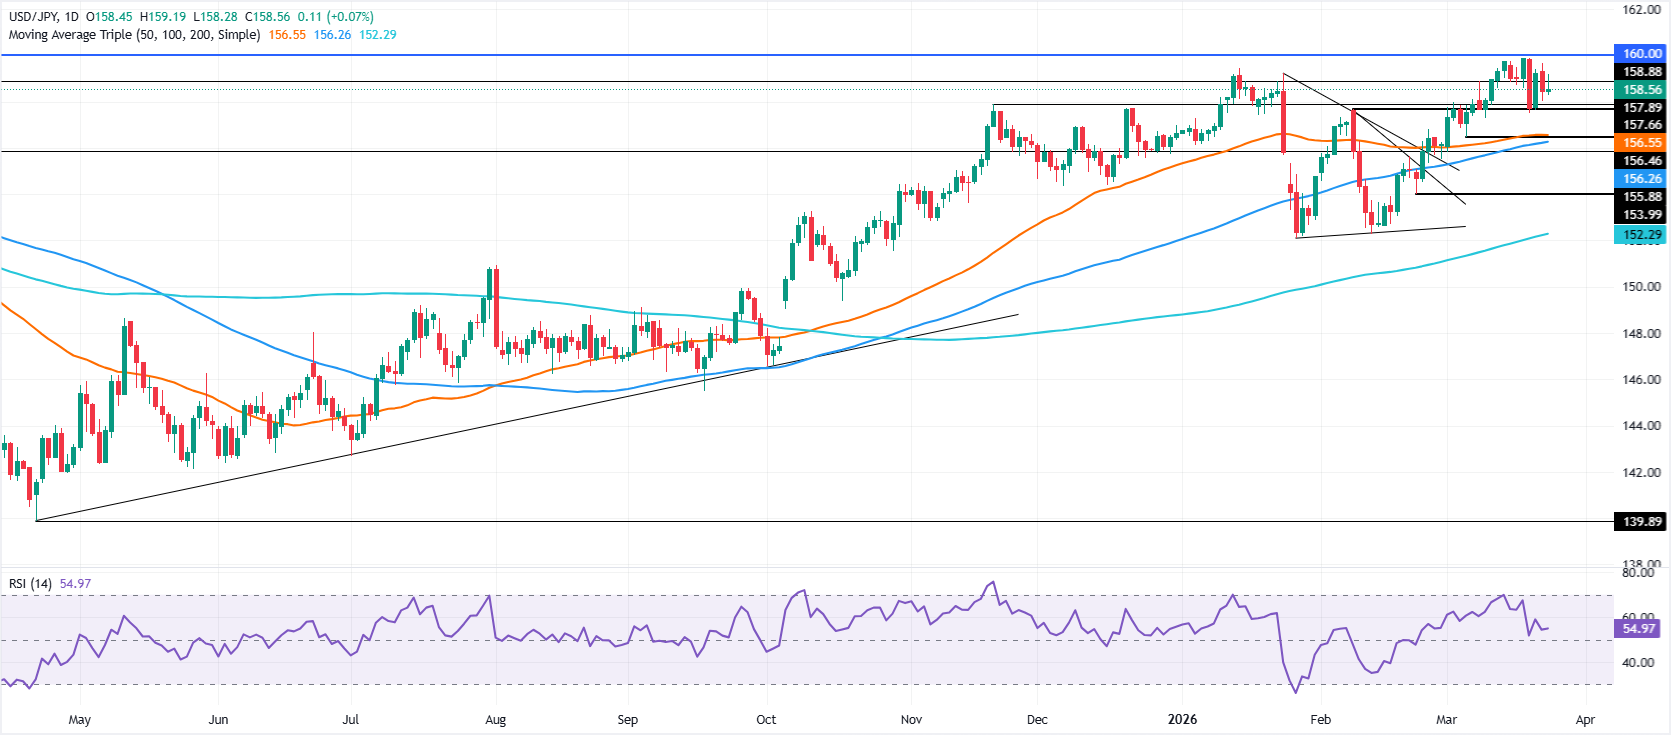
The USD/JPY resumes its upward trajectory after testing the 20-day Simple Moving Average (SMA) at 158.10 on Monday, rising towards 159.00, posting gains of over 0.14%.
- USD/JPY rebounds from 20-day SMA, resuming short-term bullish trajectory
- RSI turns higher above 50, signaling renewed upside momentum strength
- Break above 159.00 opens path toward 159.50 and 160.00 levels
The USD/JPY resumes its upward trajectory after testing the 20-day Simple Moving Average (SMA) at 158.10 on Monday, rising towards 159.00, posting gains of over 0.14%.
USD/JPY Price Forecast: Technical Outlook
The USD/JPY remains bullish-biased, even though Monday’s reversal opened the door to testing lower prices, such as the March 5 pivot low at 156.45. A day ago, bullish momentum was fading, but as of writing, the Relative Strength Index (RSI) is aiming higher, above its neutral 50-neutral level.
If USD/JPY ends the day above 159.00, expect a test of 159.50, followed by 160.00. Nevertheless, fears of a possible intervention by Japanese authorities could keep the pair trading sideways.
On the downside, the USD/JPY first support would be the 20-day SMA at 158.10. A breach of the latter will expose 157.50, followed by the 157.00 figure, and the March 5 cycle low at 156.45. Once those two levels are taken out, the next support is the 100-day SMA at 156.20.
USD/JPY Price Chart – Daily
Japanese Yen Price This week
The table below shows the percentage change of Japanese Yen (JPY) against listed major currencies this week. Japanese Yen was the strongest against the Canadian Dollar.
| USD | EUR | GBP | JPY | CAD | AUD | NZD | CHF | |
|---|---|---|---|---|---|---|---|---|
| USD | -0.70% | -0.83% | -0.52% | 0.20% | -0.11% | -0.45% | -0.08% | |
| EUR | 0.70% | -0.12% | 0.18% | 0.92% | 0.58% | 0.27% | 0.63% | |
| GBP | 0.83% | 0.12% | 0.26% | 1.04% | 0.73% | 0.38% | 0.68% | |
| JPY | 0.52% | -0.18% | -0.26% | 0.70% | 0.41% | 0.05% | 0.35% | |
| CAD | -0.20% | -0.92% | -1.04% | -0.70% | -0.29% | -0.65% | -0.29% | |
| AUD | 0.11% | -0.58% | -0.73% | -0.41% | 0.29% | -0.34% | -0.04% | |
| NZD | 0.45% | -0.27% | -0.38% | -0.05% | 0.65% | 0.34% | 0.30% | |
| CHF | 0.08% | -0.63% | -0.68% | -0.35% | 0.29% | 0.04% | -0.30% |
The heat map shows percentage changes of major currencies against each other. The base currency is picked from the left column, while the quote currency is picked from the top row. For example, if you pick the Japanese Yen from the left column and move along the horizontal line to the US Dollar, the percentage change displayed in the box will represent JPY (base)/USD (quote).

Mais de um milhão de usuários confiam na FXStreet para dados de mercado em tempo real, ferramentas de gráficos, insights de especialistas e notícias de Forex. Seu calendário econômico abrangente e webinars educacionais ajudam os traders a se manterem informados e tomarem decisões calculadas. A FXStreet conta com uma equipe de cerca de 60 profissionais, divididos entre a sede em Barcelona e diversas regiões globais.
Ler mais


