
USD/JPY Price Forecast: Stalls near intervention area as bulls eye 160.00
Por Christian Borjon Valencia
Atualizado: 19 May 2026


ARTIGOS POPULARES

USD/JPY rally extends for the seventh straight day, up 0.10% to a 12-day high of 159.25, despite growing fears of Japanese authorities intervening in FX markets. At the time of writing, the pair trades near 159.00.
- USD/JPY extends seven-day rally but stalls near intervention zone.
- RSI remains bullish, signaling upside momentum despite 160.00 intervention fears.
- Break above 159.52 exposes 160.00 and 160.72 resistance levels.
USD/JPY rally extends for the seventh straight day, up 0.10% to a 12-day high of 159.25, despite growing fears of Japanese authorities intervening in FX markets. At the time of writing, the pair trades near 159.00.
USD/JPY Price Forecast: Technical outlook
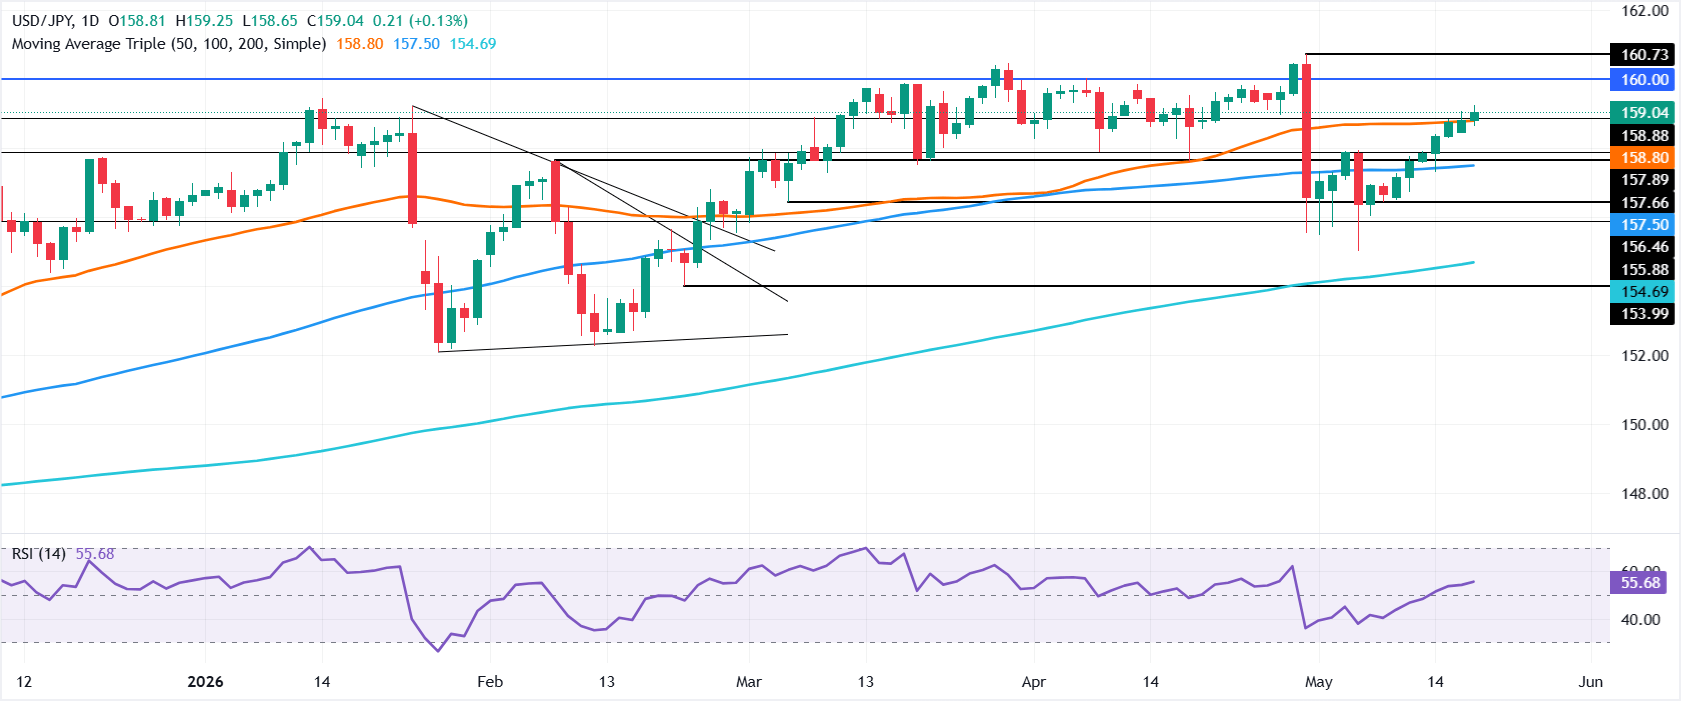
Despite recovering, USD/JPY is poised to consolidate, capped by the line in the sand “intervention zone” around 159.00-160.00, which opens the door for sellers to step in and push the pair lower.
Momentum is bullish as depicted by the Relative Strength Index (RSI) an indication that further upside is seen.
If USD/JPY clears the April 29 daily low-turned-resistance at 159.52, traders can challenge the 160.00 mark. On further strength, the next resistance is the yearly high at 160.72.
Conversely, if USD/JPY slides past the 159.00 mark, it clears the path to the next area of interest, being the 50-day SMA at 158.80, followed by the 20-day SMA at 158.23. If those levels are taken out, the next stop would be 158.00, followed by the 100-day SMA at 157.49.
USD/JPY Price Chart – Daily
Japanese Yen Price Today
The table below shows the percentage change of Japanese Yen (JPY) against listed major currencies today. Japanese Yen was the strongest against the Australian Dollar.
| USD | EUR | GBP | JPY | CAD | AUD | NZD | CHF | |
|---|---|---|---|---|---|---|---|---|
| USD | 0.45% | 0.25% | 0.13% | 0.09% | 0.85% | 0.66% | 0.59% | |
| EUR | -0.45% | -0.19% | -0.30% | -0.36% | 0.41% | 0.22% | 0.14% | |
| GBP | -0.25% | 0.19% | -0.11% | -0.16% | 0.60% | 0.42% | 0.34% | |
| JPY | -0.13% | 0.30% | 0.11% | -0.06% | 0.71% | 0.55% | 0.45% | |
| CAD | -0.09% | 0.36% | 0.16% | 0.06% | 0.77% | 0.59% | 0.51% | |
| AUD | -0.85% | -0.41% | -0.60% | -0.71% | -0.77% | -0.17% | -0.26% | |
| NZD | -0.66% | -0.22% | -0.42% | -0.55% | -0.59% | 0.17% | -0.09% | |
| CHF | -0.59% | -0.14% | -0.34% | -0.45% | -0.51% | 0.26% | 0.09% |
The heat map shows percentage changes of major currencies against each other. The base currency is picked from the left column, while the quote currency is picked from the top row. For example, if you pick the Japanese Yen from the left column and move along the horizontal line to the US Dollar, the percentage change displayed in the box will represent JPY (base)/USD (quote).

Mais de um milhão de usuários confiam na FXStreet para dados de mercado em tempo real, ferramentas de gráficos, insights de especialistas e notícias de Forex. Seu calendário econômico abrangente e webinars educacionais ajudam os traders a se manterem informados e tomarem decisões calculadas. A FXStreet conta com uma equipe de cerca de 60 profissionais, divididos entre a sede em Barcelona e diversas regiões globais.
Ler mais


