
Zcash Price Forecast: ZEC tests breakout rally after five-month decline
Por Vishal Dixit
Atualizado: 7 Apr 2026


ARTIGOS POPULARES

Zcash (ZEC) is up 4% at press time on Tuesday, attempting to break above a resistance trendline and reverse the prevailing five-month decline. A double-digit surge in ZEC futures Open Interest (OI) in the last 24 hours signals renewed retail strength for the privacy coin.
- Zcash extends gains on Tuesday to test an upside breakout of a resistance trendline, which could reverse the prevailing five-month decline.
- Open Interest has increased by double-digits in 24 hours, signaling a surge in demand for the privacy coin.
- The technical outlook is mildly bullish as the focus shifts to the overhead cluster of the 100-day and 200-day EMAs.
Zcash (ZEC) is up 4% at press time on Tuesday, attempting to break above a resistance trendline and reverse the prevailing five-month decline. A double-digit surge in ZEC futures Open Interest (OI) in the last 24 hours signals renewed retail strength for the privacy coin.
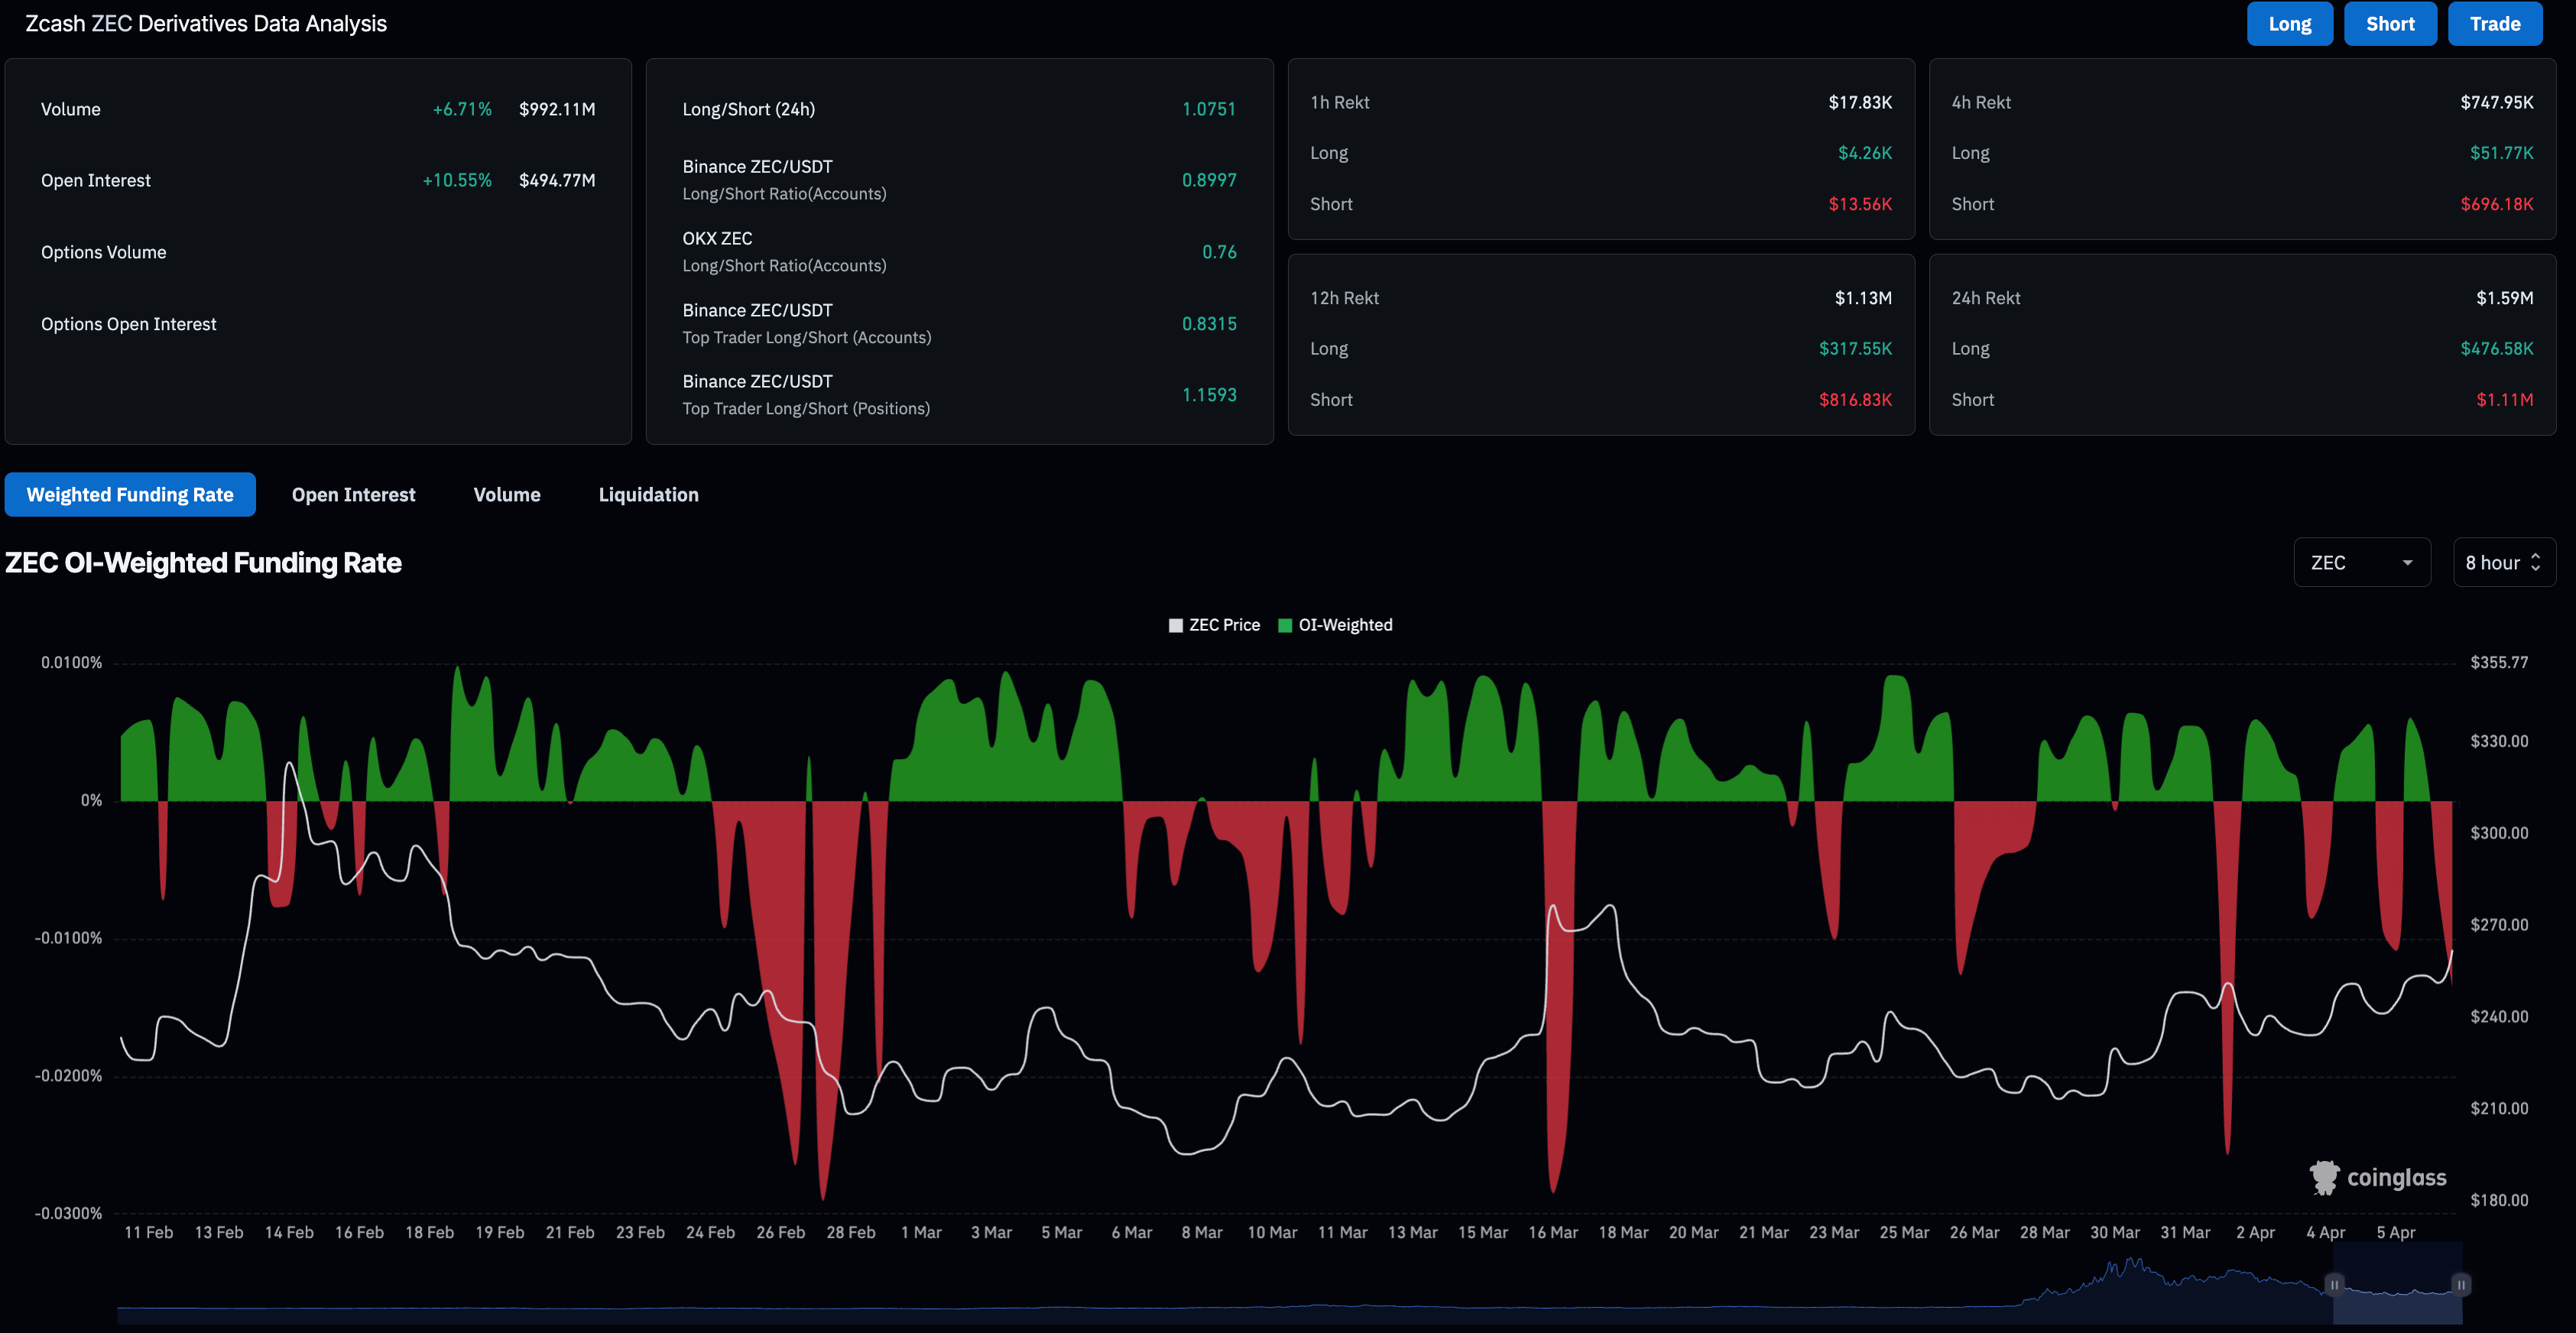
Zcash derivatives market heats up
Zcash is gaining retail momentum amid broader market volatility ahead of the looming US-Iran deadline. CoinGlass data shows ZEC futures Open Interest (OI) is at $494.77 million, up over 10% in the last 24 hours, indicating a risk-on sentiment among retail traders that is driving a positional buildup.
Total liquidations over the same period amount to $1.59 million, led by $1.11 million in short liquidations. Additionally, the 24-hour long-to-short ratio is 1.0751, suggesting that long positions outnumber short positions, consistent with buy-side dominance.
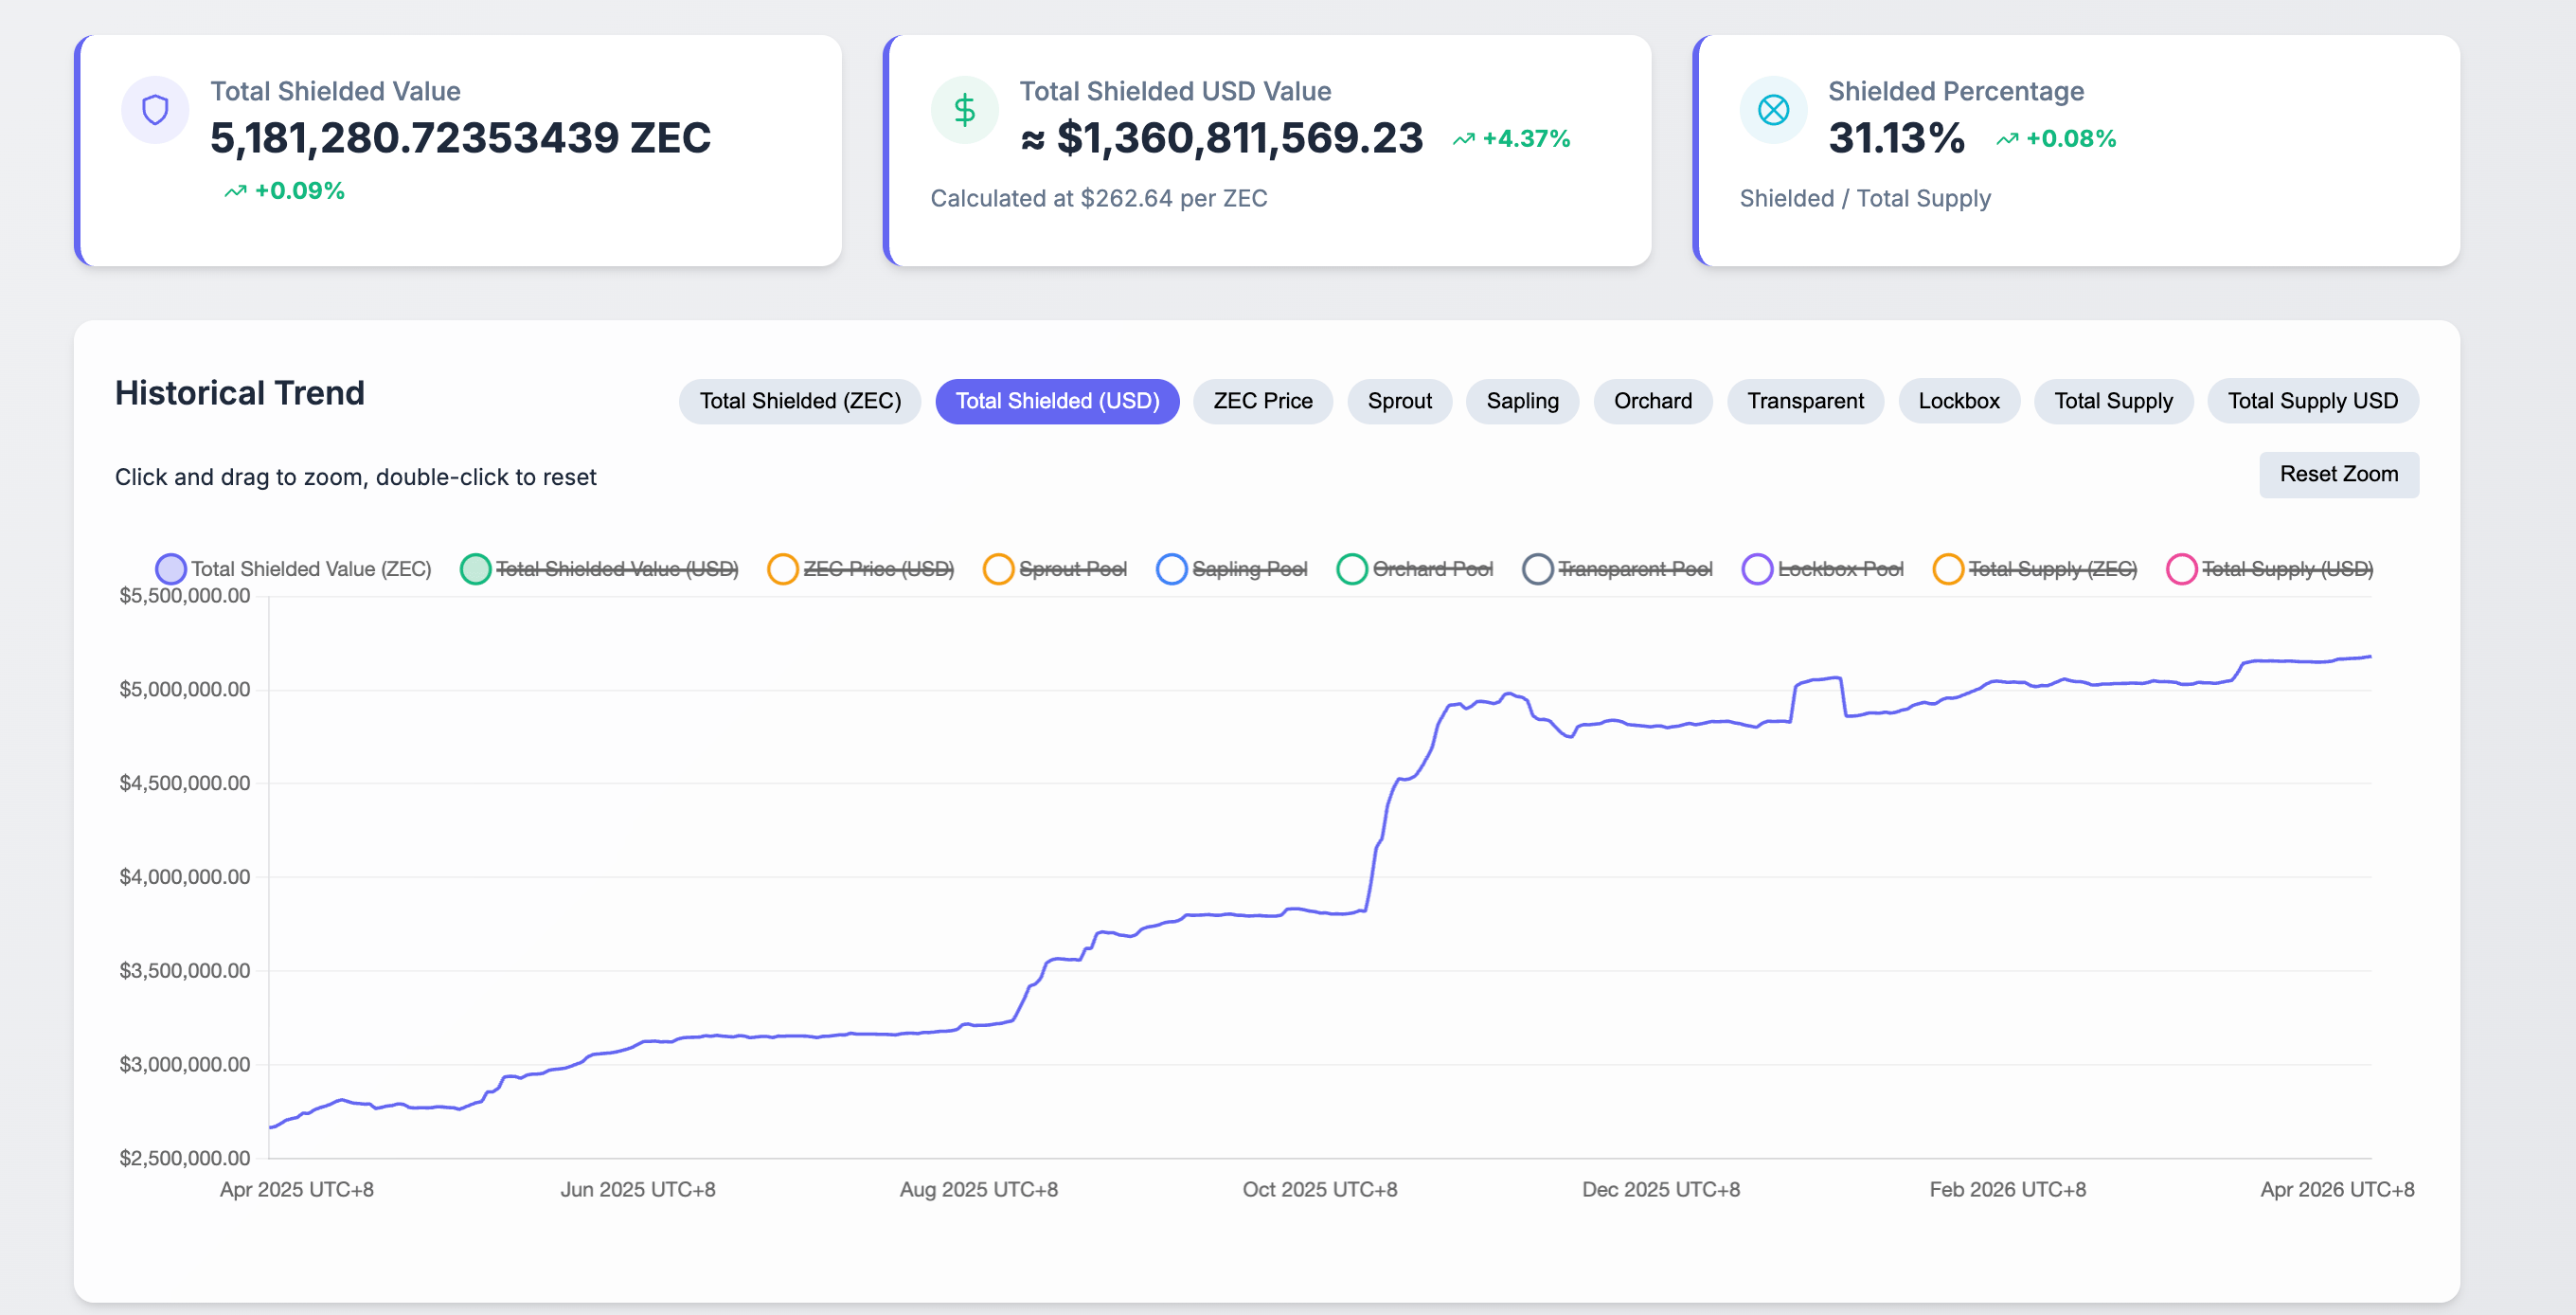
On the network side, adoption of Zcash for privacy via shielded ZEC tokens has plateaued. According to Zkp.baby, shielded ZEC tokens account for 31.13% of the total supply, and a surge in adoption could drive spot prices higher.
Will Zcash recovery lead to a breakout rally?
Zcash extends gains above the $250 psychological level and the 50-day Exponential Moving Average (EMA) at $248 at press time on Tuesday. Still, ZEC trades beneath the 100- and 200-day EMAs, signaling an emerging recovery within a broader corrective context.
The near-term bias tilts mildly bullish as the privacy coin tests a descending resistance trendline near $260. A daily close above this level would expose the 100-day and 200-day EMA clustered at $273 and $276, respectively. If ZEC surpasses these dynamic resistances, it could test the February 14 high at $333 and expose higher levels.
The Moving Average Convergence Divergence (MACD) holds above its signal line and the zero mark on the daily chart, with expanding positive histogram bars, suggesting strengthening upside momentum. Meanwhile, the Relative Strength Index (RSI) at 59 shows firm but not overbought bullish pressure.
Looking down, the key support for ZEC lies at the 50-day EMA at $248, followed by the support trendline at $202.
(The technical analysis of this story was written with the help of an AI tool.)

Mais de um milhão de usuários confiam na FXStreet para dados de mercado em tempo real, ferramentas de gráficos, insights de especialistas e notícias de Forex. Seu calendário econômico abrangente e webinars educacionais ajudam os traders a se manterem informados e tomarem decisões calculadas. A FXStreet conta com uma equipe de cerca de 60 profissionais, divididos entre a sede em Barcelona e diversas regiões globais.
Ler mais


