
Trade The World
BNB Price Forecast: BNB slips below $855 as bearish on-chain signals and momentum indicators turn negative
Por Manish Chhetri
Data de Publicação: 16 Dec 2025 | Data de Modificação: 16 Dec 2025


POPULAR ARTICLES

BNB (BNB), formerly known as Binance Coin, continues to trade down around $855 at the time of writing on Tuesday, after a slight decline the previous day.
- BNB trades in red on Tuesday after a slight decline the previous day.
- Bearish sentiment strengthens amid rising retail activity, increased sell-side dominance, and negative funding rates.
- Technical indicators signal weakening momentum, suggesting bears are gaining traction.
BNB (BNB), formerly known as Binance Coin, continues to trade down around $855 at the time of writing on Tuesday, after a slight decline the previous day. Bearish sentiment further strengthens as BNB’s on-chain and derivatives data show rising retail activity, increasing sell-side dominance, and funding rates turning negative. On the technical side, downside risks are growing, keeping traders cautious in the near term.
Rising retail activity and negative funding rates weigh on BNB
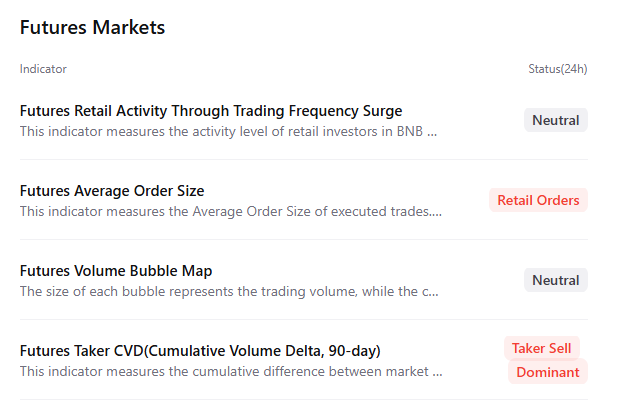
CryptoQuant’s Futures Market summary data show that BNB’s Futures Average Order Size indicator — which tracks the average size of executed BNB futures trades — has risen, signaling increased retail activity in the market that does not bode well for the BNB price.
In addition, the Futures Taker CVD (Cumulative Volume Delta) for BNB indicates a sell-dominant phase, further supporting the bearish thesis.
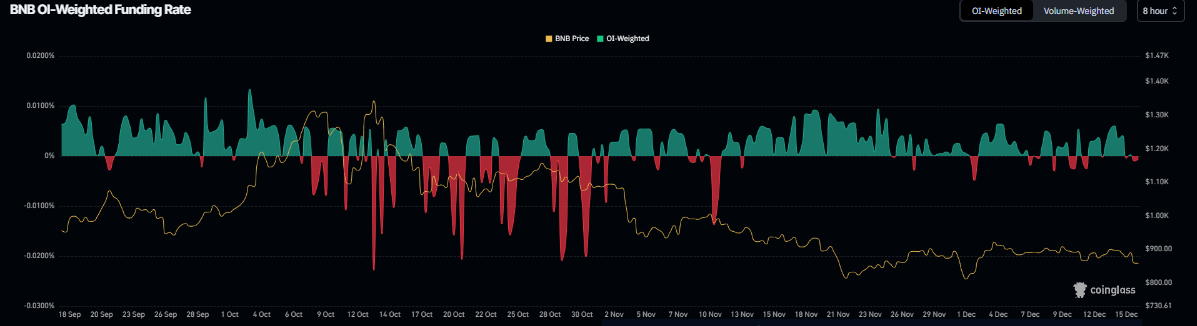
Coinglass’s OI-Weighted Funding Rate data show that the number of traders betting that the price of BNB will slide further exceeds those anticipating a price increase.
The metric flipped to a negative rate on Monday, reading -0.006% on Tuesday, suggesting that shorts are paying longs. Historically, when the funding rates have flipped negative, BNB prices have fallen sharply.
BNB Price Forecast: BNB momentum indicators show early signs of weakness
BNB price was rejected from the descending trendline (drawn by connecting multiple highs since mid-October) on December 9 and declined by nearly 5%, retesting the daily support at $844 on Monday. As of Tuesday, BNB is trading red at around $853.
If BNB continues its correction and closes below $844 on a daily basis, it could extend the decline toward the weekly support at $709.29.
The Relative Strength Index (RSI) on the daily reads 39, below its neutral level of 50 and pointing downward, indicating bearish momentum is increasing. Moreover, the Moving Average Convergence Divergence (MACD) lines are converging, and a flip to a bearish crossover would further support the bearish outlook.
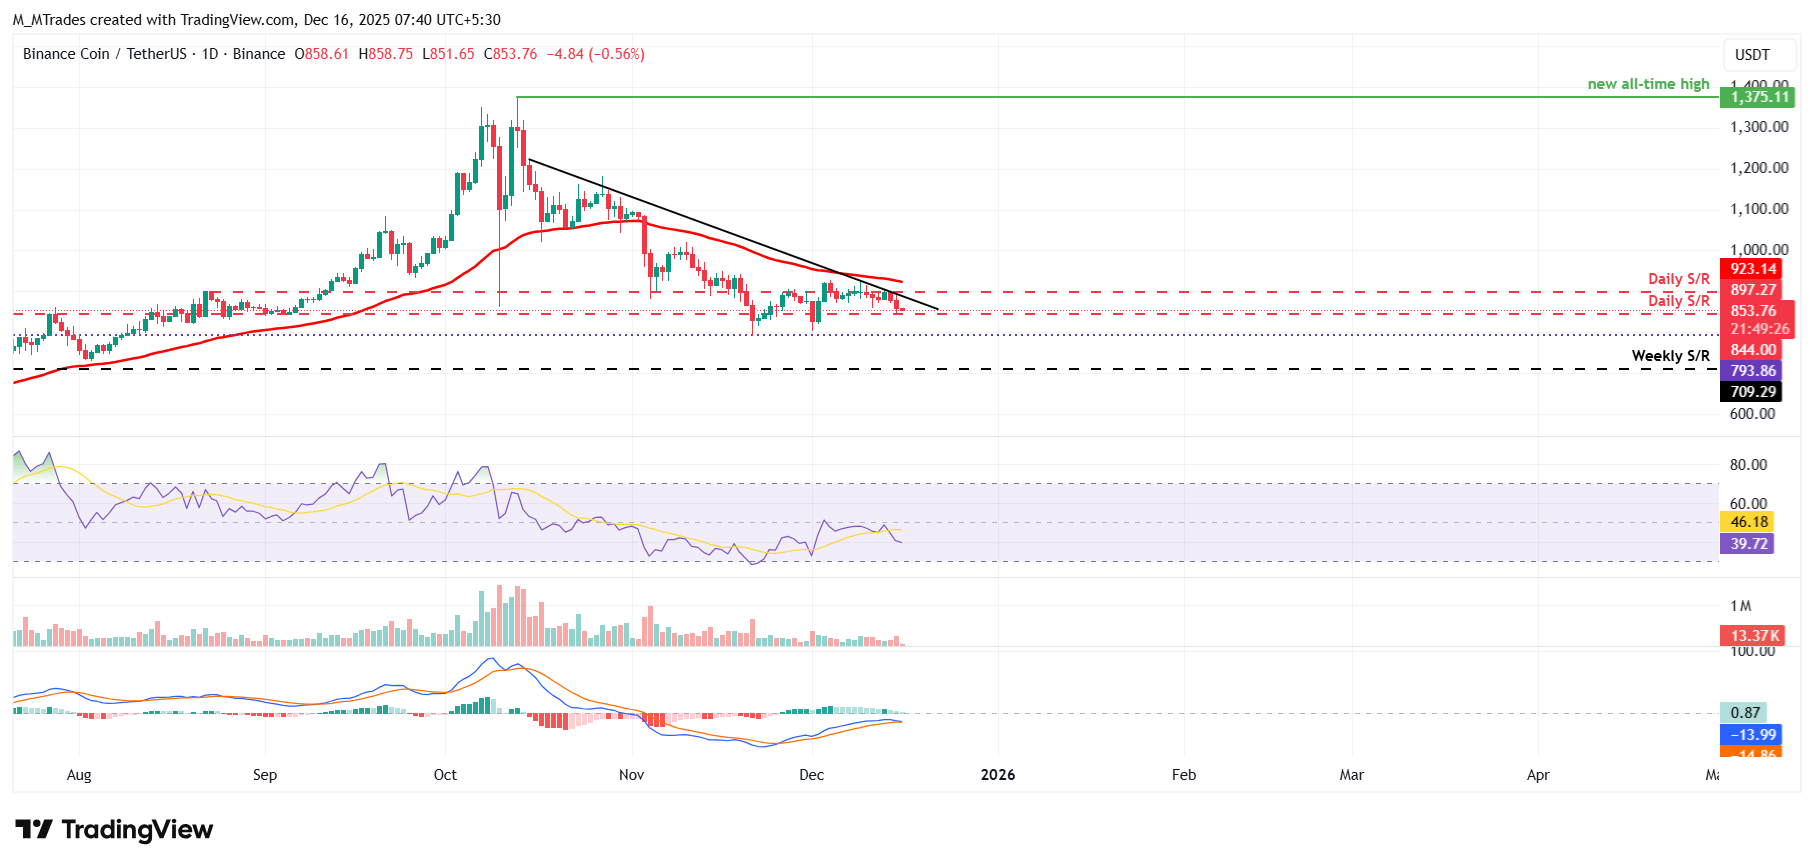
Looking up, if BNB recovers, it could extend the recovery toward the 50-day Exponential Moving Average (EMA) at $923.14.

FXStreet
Mais de um milhão de usuários confiam na FXStreet para dados de mercado em tempo real, ferramentas de gráficos, insights de especialistas e notícias de Forex. Seu calendário econômico abrangente e webinars educacionais ajudam os traders a se manterem informados e tomarem decisões calculadas. A FXStreet conta com uma equipe de cerca de 60 profissionais, divididos entre a sede em Barcelona e diversas regiões globais.
Read More


