
Trade The World
Chainlink Price Forecast: Chainlink reserve expansion counters retail selling
Por Vishal Dixit
Data de Publicação: 24 Oct 2025 | Data de Modificação: 24 Oct 2025


POPULAR ARTICLES

Chainlink (LINK) stalls above $17 at press time on Friday after a 2% recovery on Thursday, driven by the buyback of 63,481 LINK tokens. Technically, Chainlink stands at a crossroads, while muted retail interest tilts it bearish.
- Chainlink holds above $17 after a 2% recovery on Thursday, fueled by a buyback of over 63,000 LINK tokens.
- Derivatives data shows muted interest in Chainlink, indicating a risk-off sentiment among investors.
- The technical outlook for Chainlink remains divided as momentum wanes and recovery stalls.
Chainlink (LINK) stalls above $17 at press time on Friday after a 2% recovery on Thursday, driven by the buyback of 63,481 LINK tokens. Technically, Chainlink stands at a crossroads, while muted retail interest tilts it bearish.
Chainlink Reserve buyback fails to boost retail demand
Chainlink Reserve is funded by revenue from off-chain and on-chain services, which reduces the supply of LINK available in the market, thereby driving demand higher. However, the recent buyback of 63,481 LINK on Thursday, the second-largest inflow since inception, has served as a buffer, preventing further losses. As of Friday, the Chainlink Reserve holds 586,641 LINK tokens, worth $10.2 million.
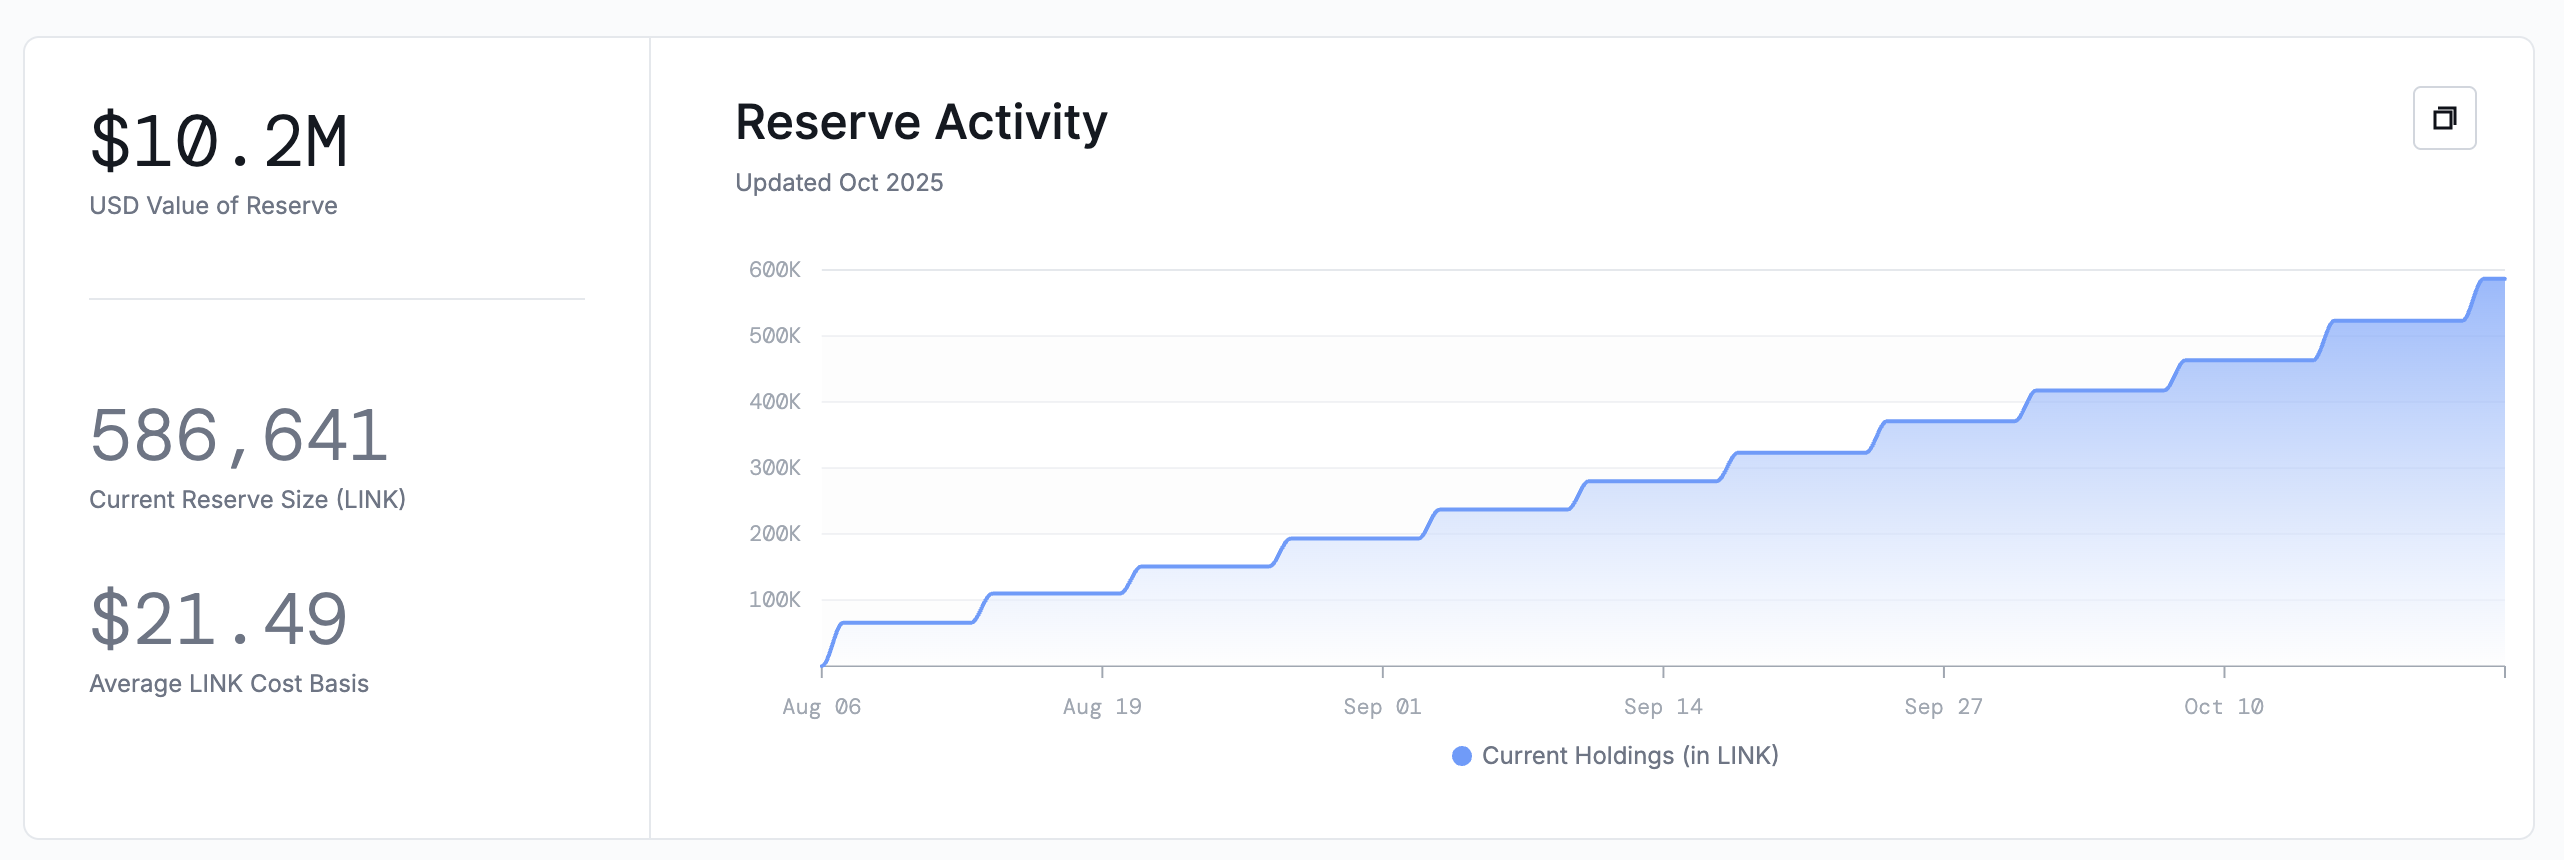
Chainlink Reserve. Source: Chainlink
Amid the buyback, the retail demand for Chainlink smolders according to CoinGlass’ LINK futures Open Interest data, stalling at $654.04 million. The sideways trend in LINK OI after the October 10 crash suggests an extended risk-off sentiment, with traders avoiding increased leverage or adding new long positions.
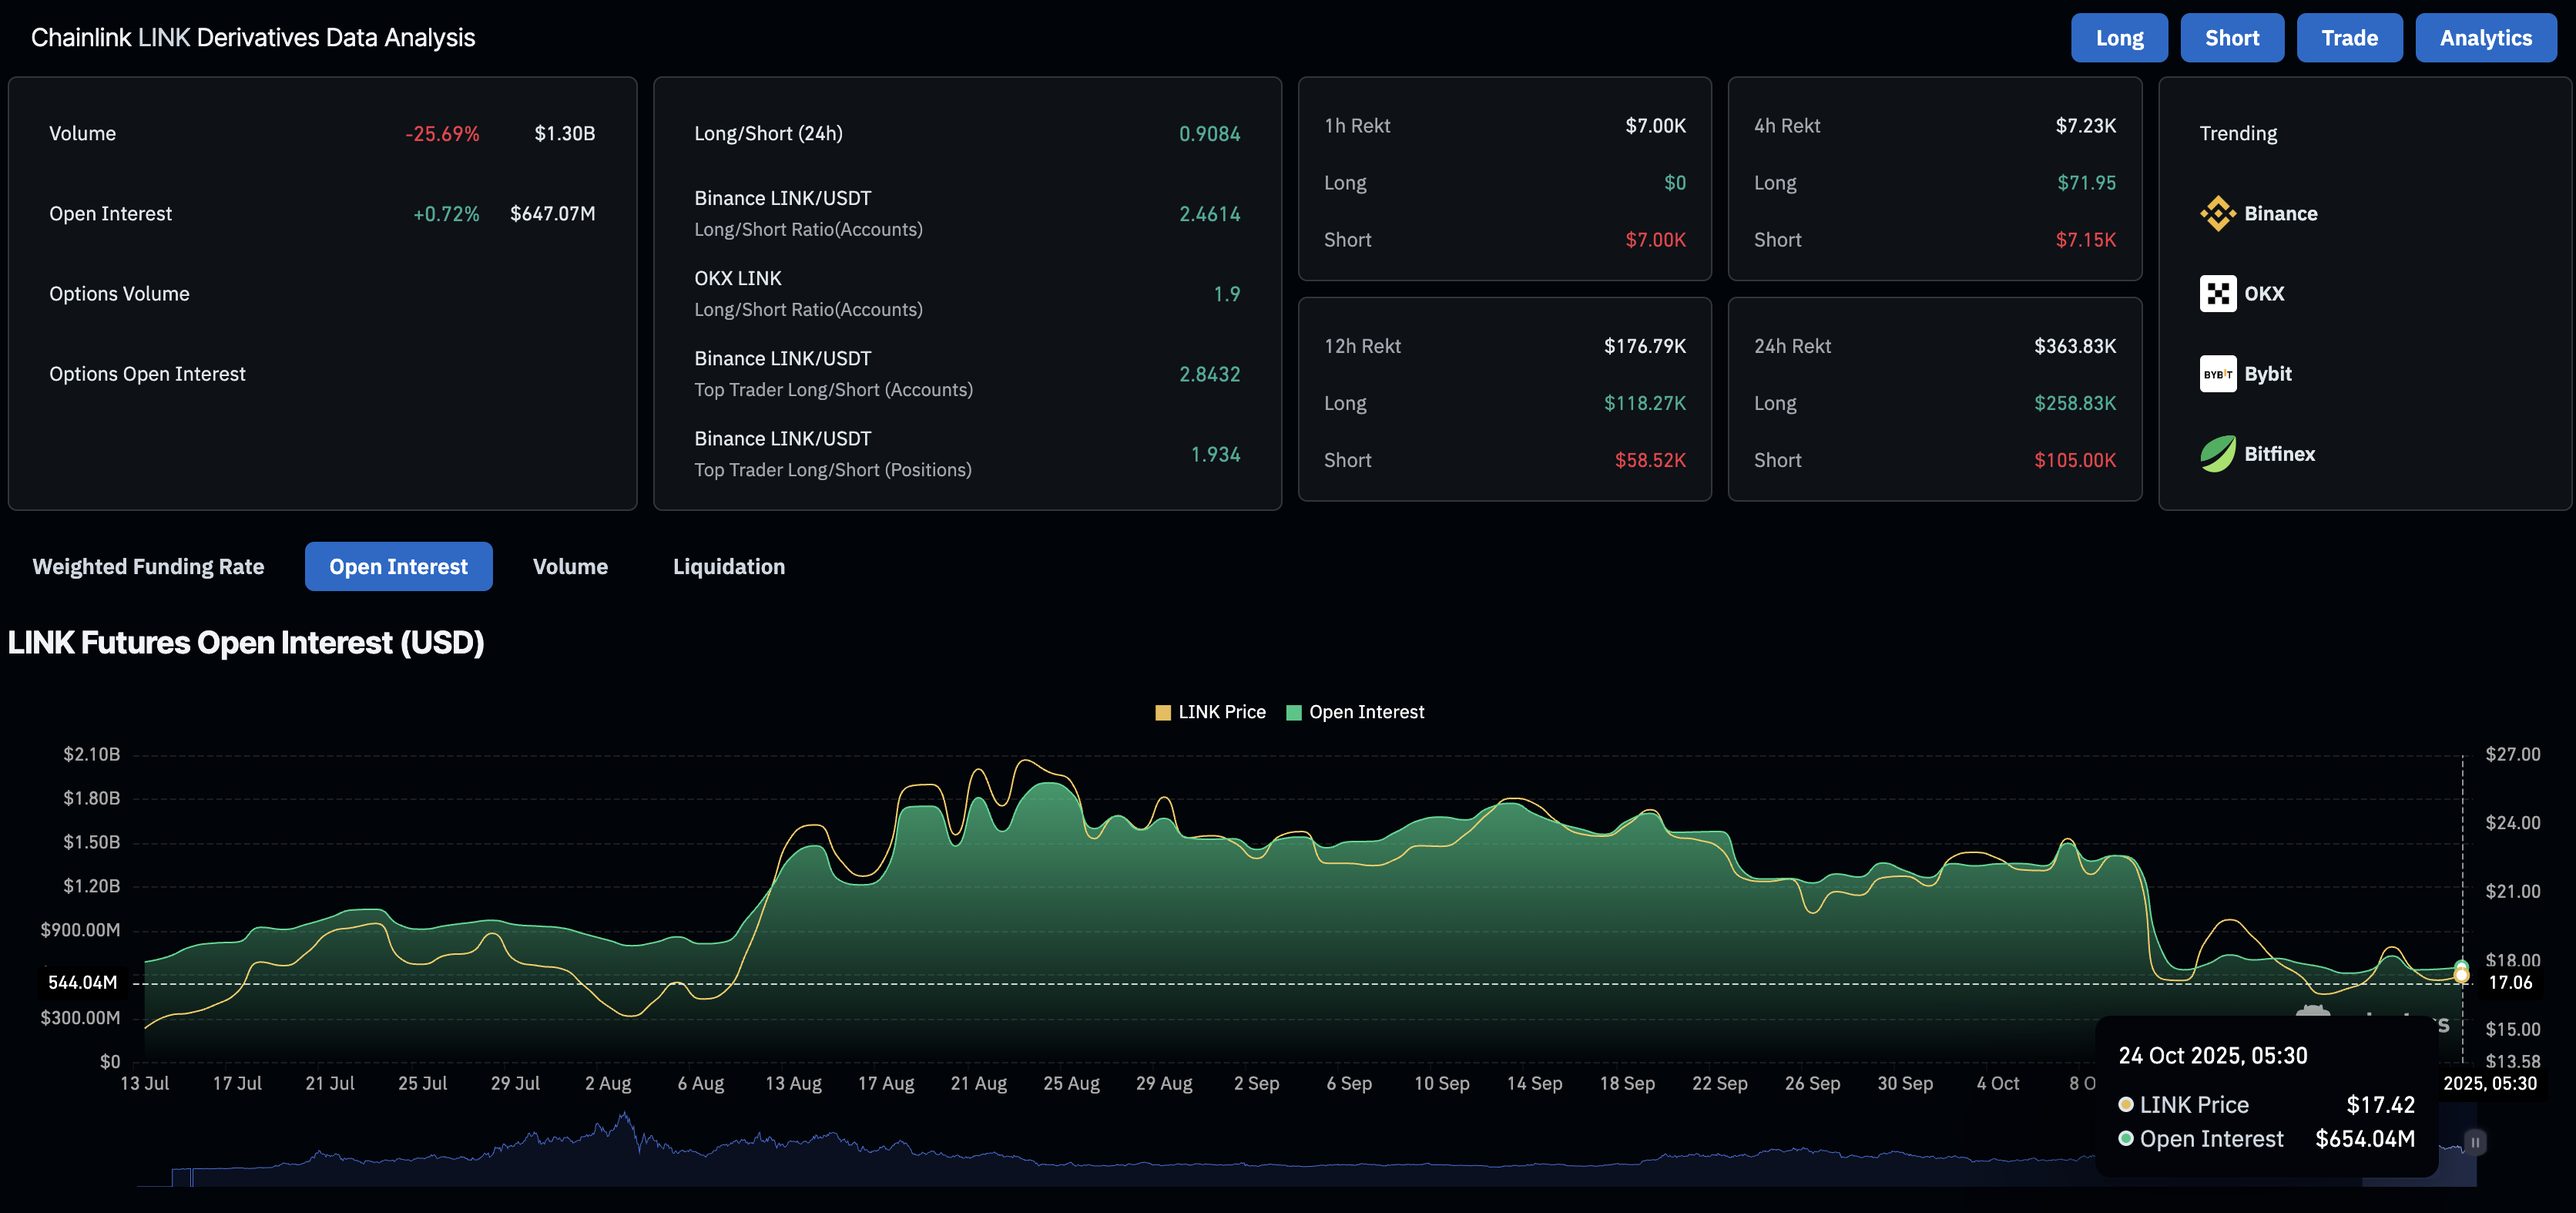
Chainlink derivatives data. Source: CoinGlass
Chainlink struggles to extend recovery
Chainlink edges lower by 0.50% at press time on Friday, following the 2% recovery on the previous day. The oracle token struggles to exceed the central Pivot Point at $17.72, risking a freefall to the S1 Pivot Point at $15.26.
Still, the momentum indicators on the daily chart flash mixed signals as the Moving Average Convergence Divergence (MACD) approaches its signal line, signaling a bullish crossover. Meanwhile, the Relative Strength Index (RSI) at 45 on the same chart maintains a sideways trend below the midpoint, indicating a bearish trend.
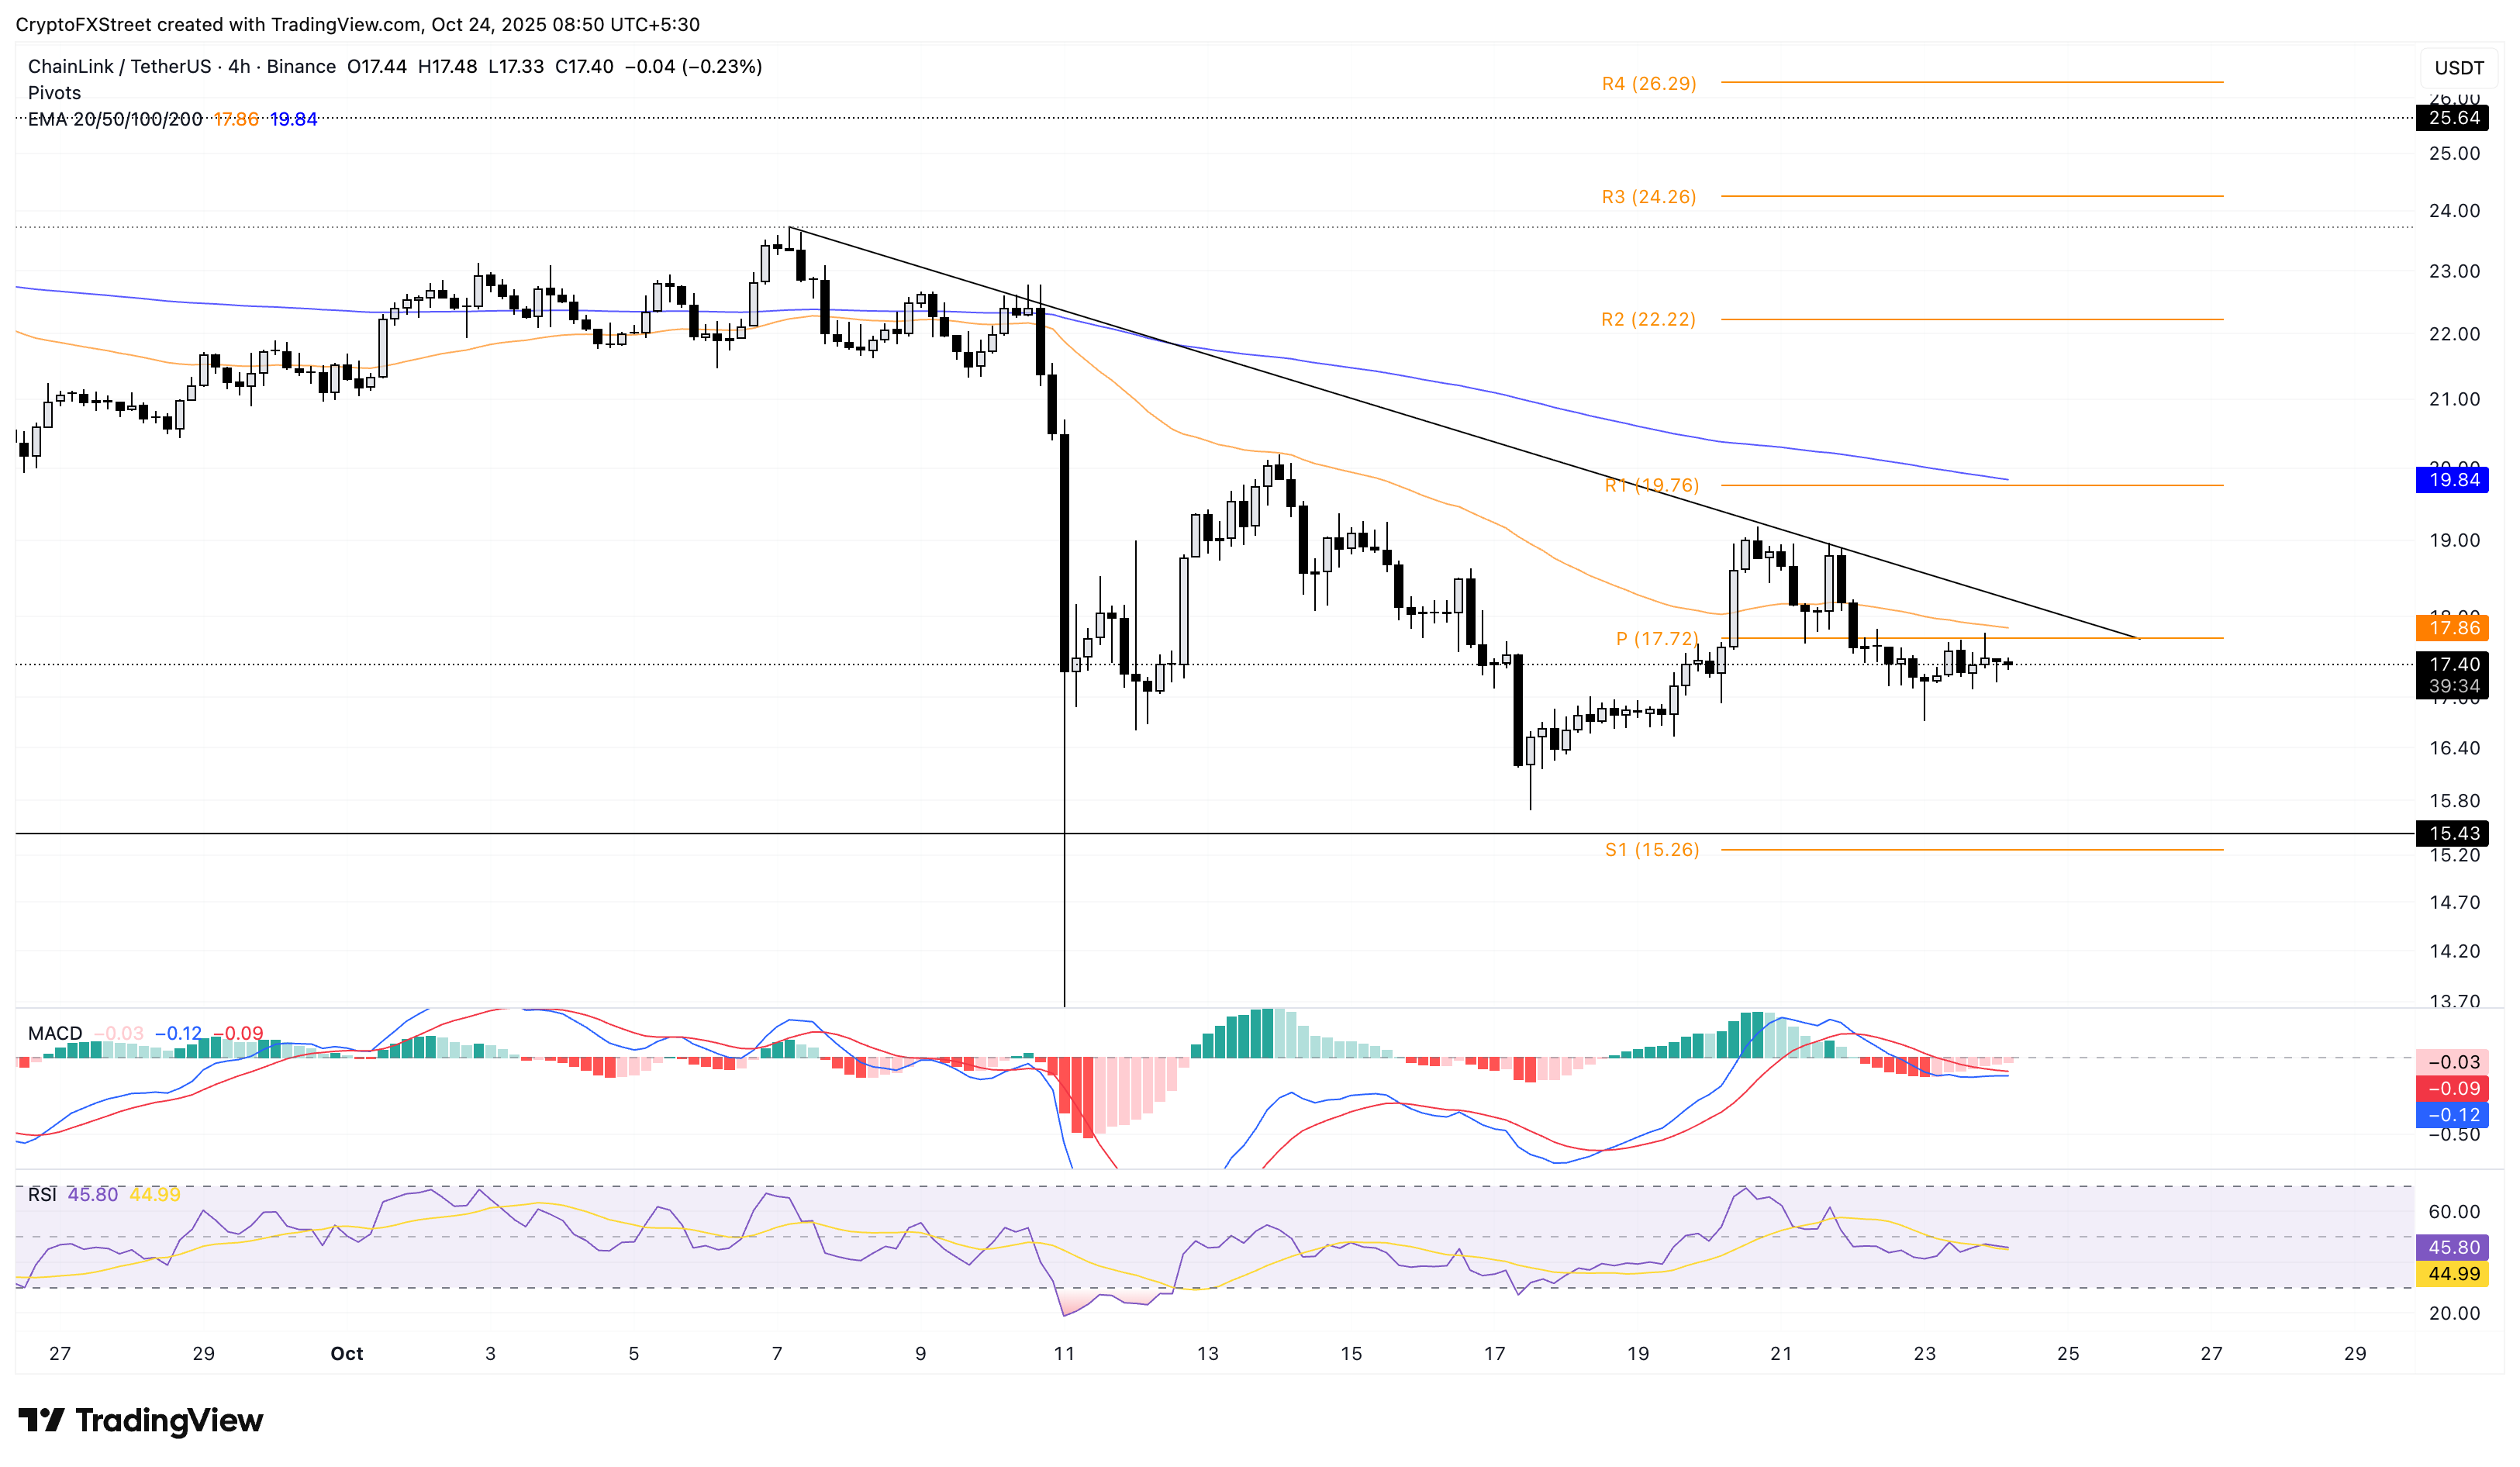
LINK/USDT 4-hour price chart.
To reinforce an uptrend, Chainlink must surpass the short-term resistance trendline near $18.00, potentially targeting the R1 Pivot Point at $19.76.

FXStreet
Mais de um milhão de usuários confiam na FXStreet para dados de mercado em tempo real, ferramentas de gráficos, insights de especialistas e notícias de Forex. Seu calendário econômico abrangente e webinars educacionais ajudam os traders a se manterem informados e tomarem decisões calculadas. A FXStreet conta com uma equipe de cerca de 60 profissionais, divididos entre a sede em Barcelona e diversas regiões globais.
Read More


