
Trade The World
EUR/JPY Price Forecast: Holds gains near 176.50 due to persistent bullish bias
Por Akhtar Faruqui
Data de Publicação: 13 Oct 2025 | Data de Modificação: 13 Oct 2025


POPULAR ARTICLES

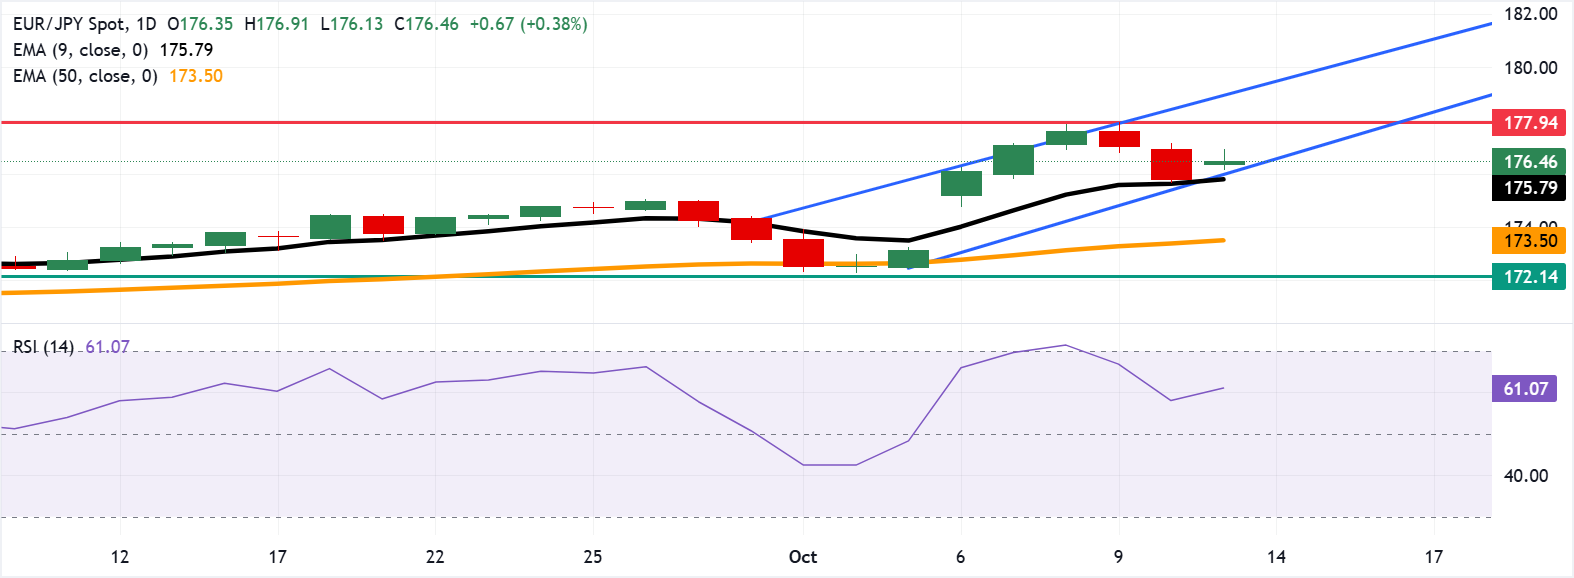
EUR/JPY gains ground after two days of losses, trading around 176.50 during the European hours on Monday. The technical analysis of the daily chart indicates a prevailing bullish bias as the currency cross remains within the ascending channel pattern.
- EUR/JPY may target its primary barrier at the all-time high of 177.94.
- The 14-day Relative Strength Index remains above the 50 level, strengthening bullish bias.
- The initial support appears at the ascending channel’s lower boundary around 176.00.
EUR/JPY gains ground after two days of losses, trading around 176.50 during the European hours on Monday. The technical analysis of the daily chart indicates a prevailing bullish bias as the currency cross remains within the ascending channel pattern.
The short-term price momentum is stronger as the EUR/JPY cross remains above the nine-day Exponential Moving Average (EMA). Additionally, the 14-day Relative Strength Index (RSI) is positioned above the 50 mark, suggesting that bullish bias is strengthening.
On the upside, the EUR/JPY cross may find its initial resistance at the record high of 177.94, which was recorded on October 9. A break above this level would prompt the currency cross to test the upper boundary of the ascending channel around the psychological level of 179.00.
The immediate support lies at the ascending channel’s lower boundary around the psychological level of 176.00, followed by the nine-day EMA of 175.79. A break below this crucial support zone would weaken the bullish bias and put downward pressure on the EUR/JPY cross to navigate the region around the 50-day EMA at 173.50, followed by the six-week low of 172.14, which was recorded on September 9.
EUR/JPY: Daily Chart
Euro Price Today
The table below shows the percentage change of Euro (EUR) against listed major currencies today. Euro was the strongest against the Swiss Franc.
| USD | EUR | GBP | JPY | CAD | AUD | NZD | CHF | |
|---|---|---|---|---|---|---|---|---|
| USD | 0.27% | 0.19% | 0.24% | 0.06% | -0.16% | 0.25% | 0.33% | |
| EUR | -0.27% | -0.08% | 0.02% | -0.23% | -0.34% | -0.04% | 0.05% | |
| GBP | -0.19% | 0.08% | 0.14% | -0.15% | -0.27% | 0.05% | 0.10% | |
| JPY | -0.24% | -0.02% | -0.14% | -0.25% | -0.46% | 0.03% | 0.03% | |
| CAD | -0.06% | 0.23% | 0.15% | 0.25% | -0.25% | 0.21% | 0.25% | |
| AUD | 0.16% | 0.34% | 0.27% | 0.46% | 0.25% | 0.33% | 0.38% | |
| NZD | -0.25% | 0.04% | -0.05% | -0.03% | -0.21% | -0.33% | 0.05% | |
| CHF | -0.33% | -0.05% | -0.10% | -0.03% | -0.25% | -0.38% | -0.05% |
The heat map shows percentage changes of major currencies against each other. The base currency is picked from the left column, while the quote currency is picked from the top row. For example, if you pick the Euro from the left column and move along the horizontal line to the US Dollar, the percentage change displayed in the box will represent EUR (base)/USD (quote).

FXStreet
Mais de um milhão de usuários confiam na FXStreet para dados de mercado em tempo real, ferramentas de gráficos, insights de especialistas e notícias de Forex. Seu calendário econômico abrangente e webinars educacionais ajudam os traders a se manterem informados e tomarem decisões calculadas. A FXStreet conta com uma equipe de cerca de 60 profissionais, divididos entre a sede em Barcelona e diversas regiões globais.
Read More


