
Trade The World
EUR/USD Price Forecast: Hovers around 1.1650 as RSI signals fading momentum
Por Akhtar Faruqui
Data de Publicação: 14 Jan 2026 | Data de Modificação: 14 Jan 2026


POPULAR ARTICLES

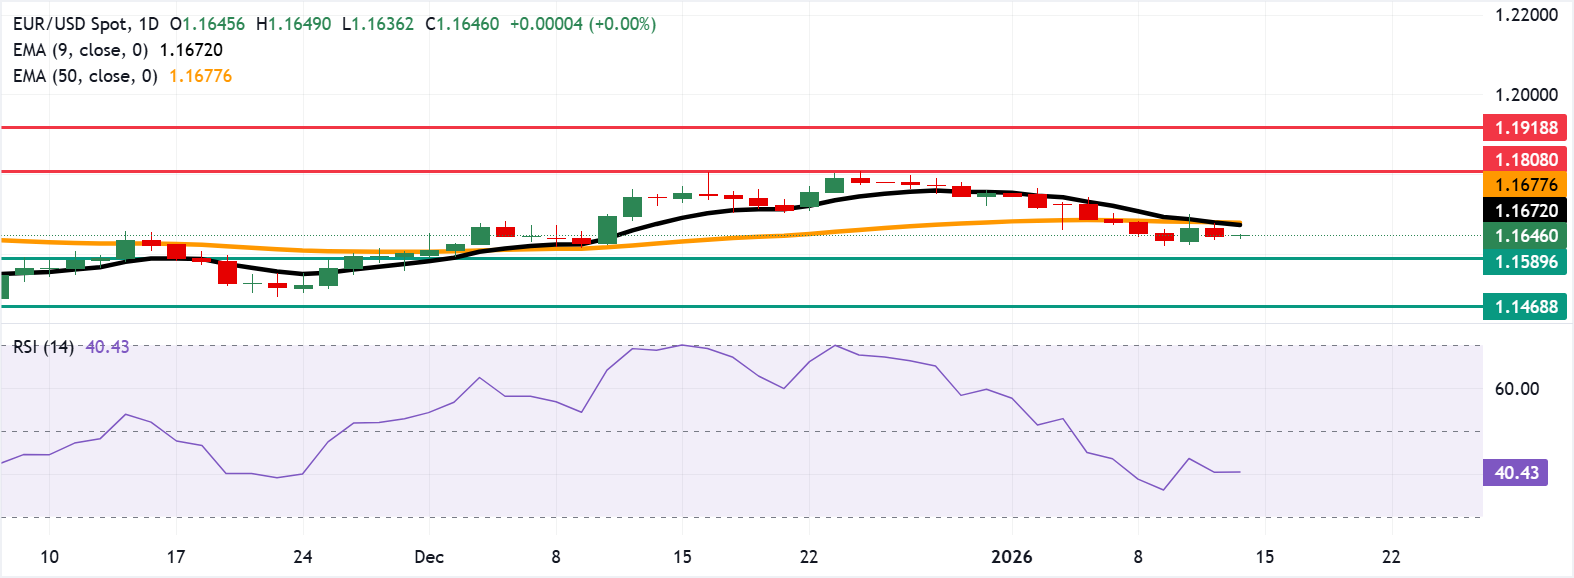
EUR/USD moves little after registering modest losses in the previous session, trading around 1.1650 during the Asian hours on Wednesday. The 14-day Relative Strength Index (RSI) momentum indicator, currently at 40 (below the 50 midline), signals weak momentum without indicating oversold conditions.
- EUR/USD may navigate the region around the six-week low of 1.1589.
- The 14-day Relative Strength Index is at 40, signaling weak momentum.
- The primary barrier is seen at the nine-day EMA around 1.1672.
EUR/USD moves little after registering modest losses in the previous session, trading around 1.1650 during the Asian hours on Wednesday. The 14-day Relative Strength Index (RSI) momentum indicator, currently at 40 (below the 50 midline), signals weak momentum without indicating oversold conditions.
The technical analysis of the daily chart shows that the EUR/USD pair sits beneath the nine- and 50-day Exponential Moving Averages (EMAs), which have flattened and point to fading upside momentum. The nine-day EMA has slipped below the 50-day, reinforcing a near-term bearish bias as the medium-term average starts to roll over.
On the downside, the EUR/USD pair may fall toward the six-week low of 1.1589, set on December 1. A break below this level would expose the next base around 1.1468, the lowest level since August 2025.
The EUR/USD pair could find the initial resistance at the nine-day EMA of 1.1672, aligned with the 50-day EMA at 1.1677. A rebound through the EMA band could stabilize the tone and refocus the first resistance at the three-month high of 1.1808, which was recorded on December 24, followed by the 1.1918, the highest level since June 2021.
Euro Price Today
The table below shows the percentage change of Euro (EUR) against listed major currencies today. Euro was the strongest against the Swiss Franc.
| USD | EUR | GBP | JPY | CAD | AUD | NZD | CHF | |
|---|---|---|---|---|---|---|---|---|
| USD | 0.01% | -0.07% | 0.06% | 0.04% | -0.20% | -0.07% | 0.05% | |
| EUR | -0.01% | -0.08% | 0.04% | 0.03% | -0.22% | -0.08% | 0.05% | |
| GBP | 0.07% | 0.08% | 0.15% | 0.11% | -0.13% | 0.00% | 0.13% | |
| JPY | -0.06% | -0.04% | -0.15% | -0.03% | -0.26% | -0.14% | -0.00% | |
| CAD | -0.04% | -0.03% | -0.11% | 0.03% | -0.24% | -0.11% | 0.02% | |
| AUD | 0.20% | 0.22% | 0.13% | 0.26% | 0.24% | 0.14% | 0.26% | |
| NZD | 0.07% | 0.08% | -0.00% | 0.14% | 0.11% | -0.14% | 0.12% | |
| CHF | -0.05% | -0.05% | -0.13% | 0.00% | -0.02% | -0.26% | -0.12% |
The heat map shows percentage changes of major currencies against each other. The base currency is picked from the left column, while the quote currency is picked from the top row. For example, if you pick the Euro from the left column and move along the horizontal line to the US Dollar, the percentage change displayed in the box will represent EUR (base)/USD (quote).
(The technical analysis of this story was written with the help of an AI tool.)

FXStreet
Mais de um milhão de usuários confiam na FXStreet para dados de mercado em tempo real, ferramentas de gráficos, insights de especialistas e notícias de Forex. Seu calendário econômico abrangente e webinars educacionais ajudam os traders a se manterem informados e tomarem decisões calculadas. A FXStreet conta com uma equipe de cerca de 60 profissionais, divididos entre a sede em Barcelona e diversas regiões globais.
Read More


