
Pi Network Price Forecast: PI consolidates as momentum shift flashes downside risk
Por Vishal Dixit
Data de Publicação: 16 Jan 2026 | Data de Modificação: 16 Jan 2026


ARTIGOS POPULARES

Pi Network (PI) is trading near the $0.2000 psychological support level at press time on Friday, extending its nearly month-long consolidation. Large deposits over centralized exchanges accepting PI tokens suggest a sell-side bias among holders.
- Pi Network drifts above $0.20 on Friday, stabilizing after a 2% drop on the previous day.
- PiScan data shows large PI deposits to exchanges as Pioneers trim holdings.
- The technical outlook for PI flashes downside bias as the MACD indicator signals a bearish crossover.
Pi Network (PI) is trading near the $0.2000 psychological support level at press time on Friday, extending its nearly month-long consolidation. Large deposits over centralized exchanges accepting PI tokens suggest a sell-side bias among holders. Technically, Pi Network flashes downside bias as the MACD indicator inches toward a bearish crossover.
Large PI deposits warn of increased overhead pressure
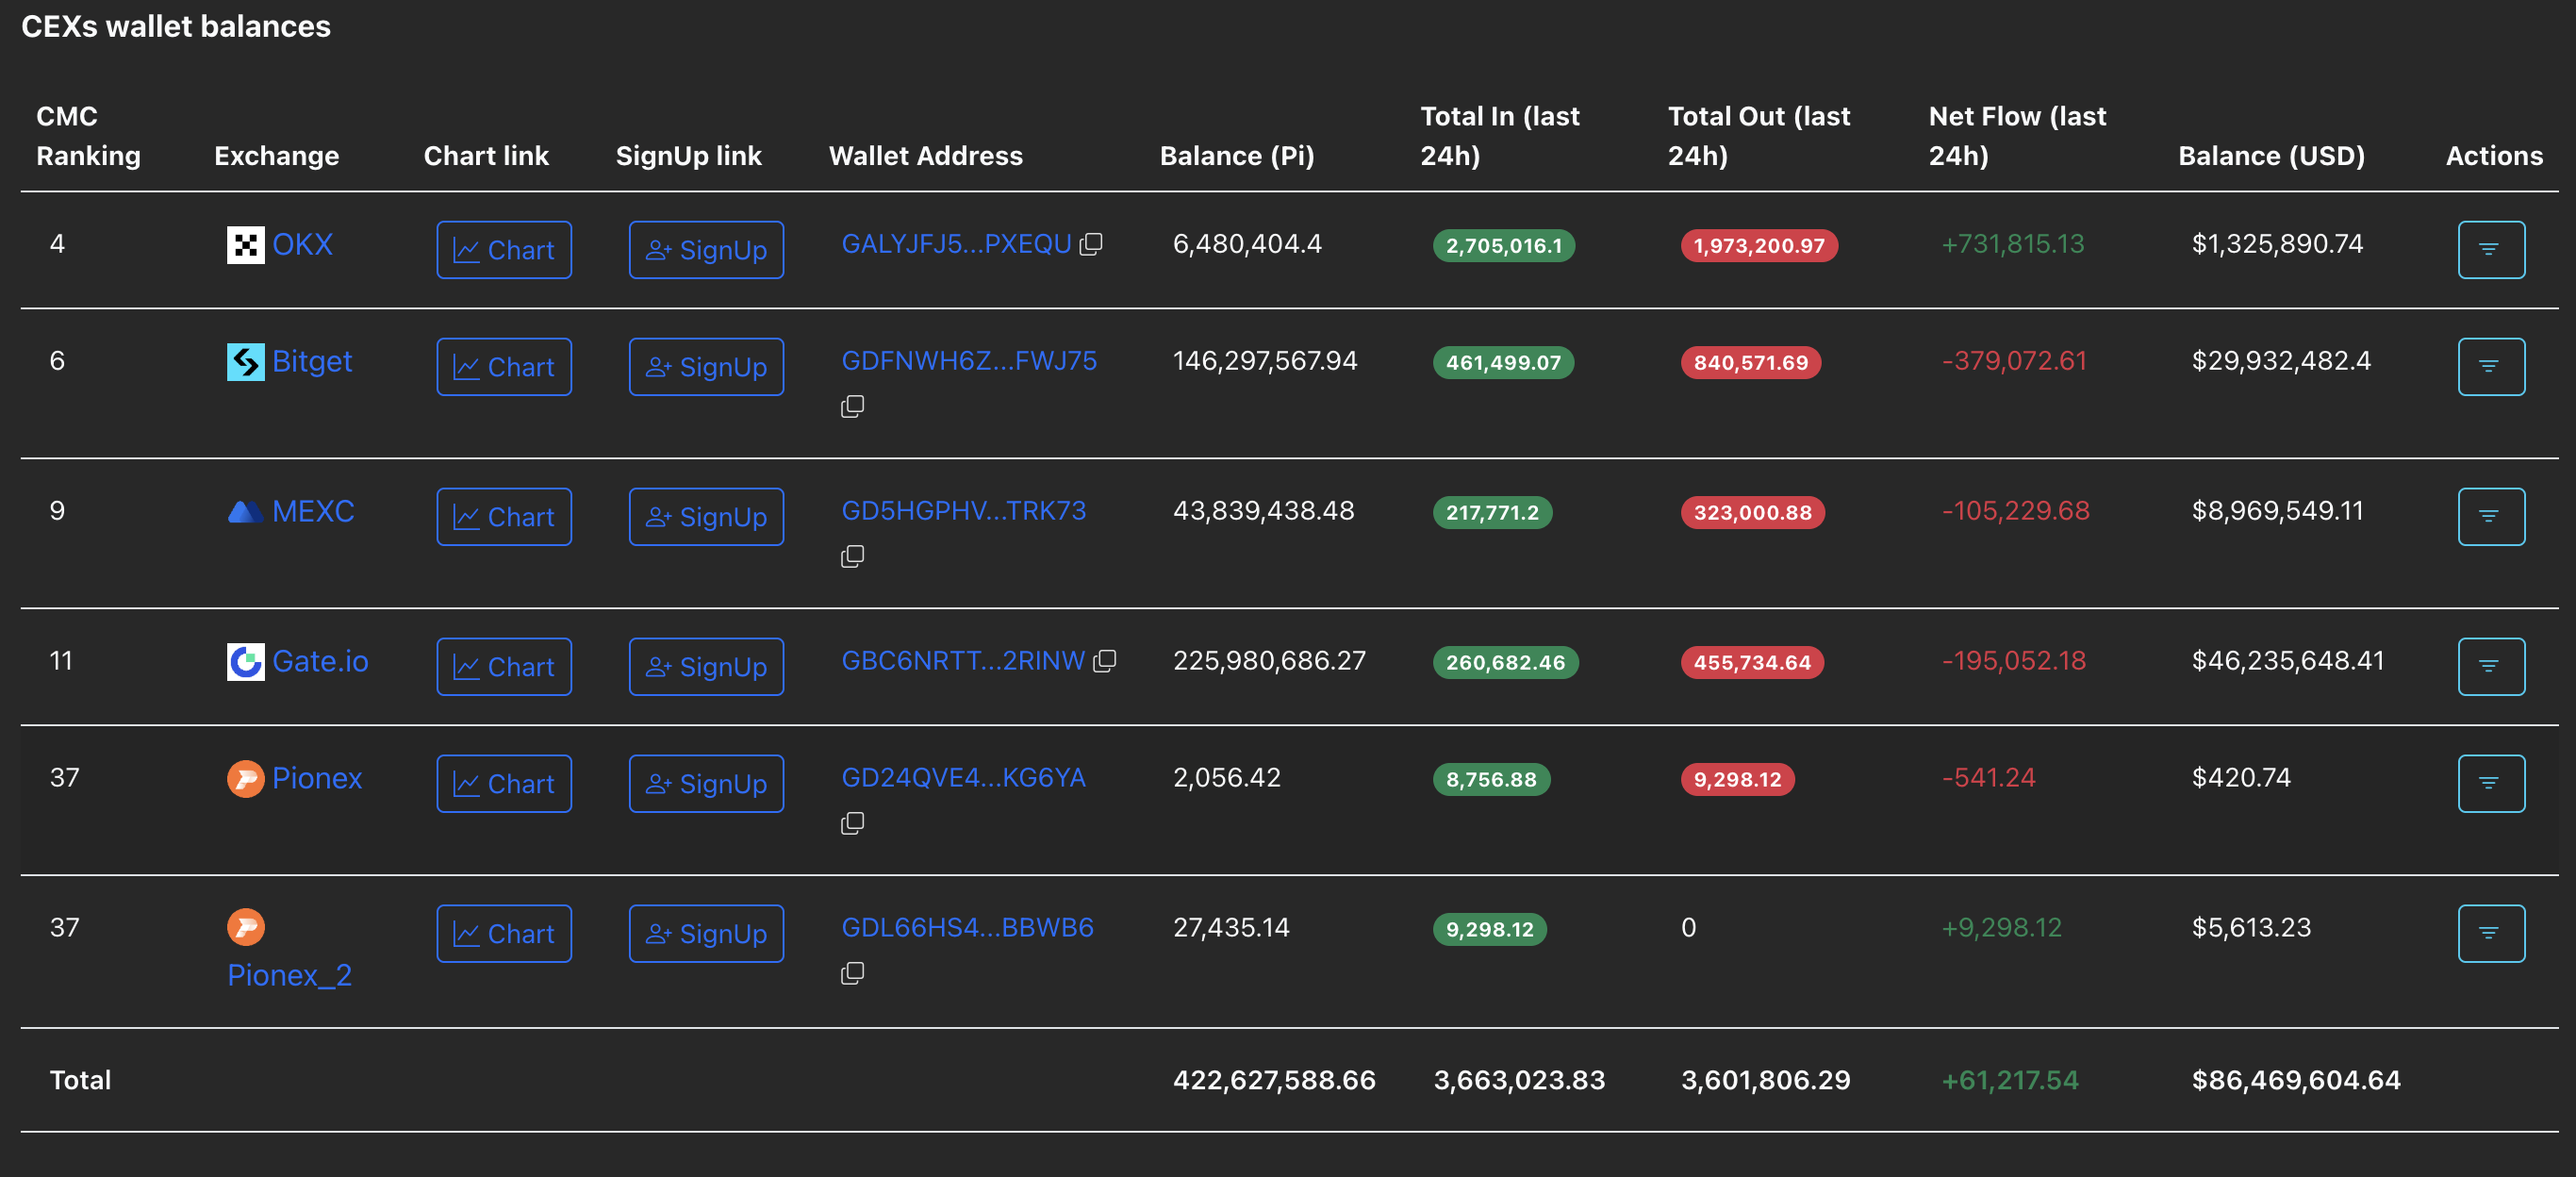
PiScan data shows that two out of the three largest transactions on Pi Network over the last 24 hours involved deposits of 1.03 million PI tokens. This suggests a decline in large wallet holders, confirming a decline in sentiment.

The CEX wallet balances have effectively increased by 61,217 PI tokens, with OKX exchange recording the largest inflow of 2.70 million PI tokens. This increase in CEX reserves could reflect rising potential supply pressure.
Will Pi Network sustain above a key support?
Pi Network trades above $0.2000 at press time on Friday, but faces headwinds from the 20-day and 50-day Exponential Moving Averages (EMAs) at $0.2082 and $0.2141, respectively. If PI exceeds the 20-day and the 50-day EMAs, and the December 19 high at $0.2177, it would improve the upside potential, opening the path toward the September 23 low at $0.2613, which is a support-turned-resistance level.
However, the Moving Average Convergence Divergence (MACD) indicator contracts toward the signal line on the daily chart, risking a bearish crossover. The declining trend in histograms toward the zero line suggests fading bullish momentum.
At the same time, the Relative Strength Index (RSI) is at 41, consistent with the increasing bearish pressure.
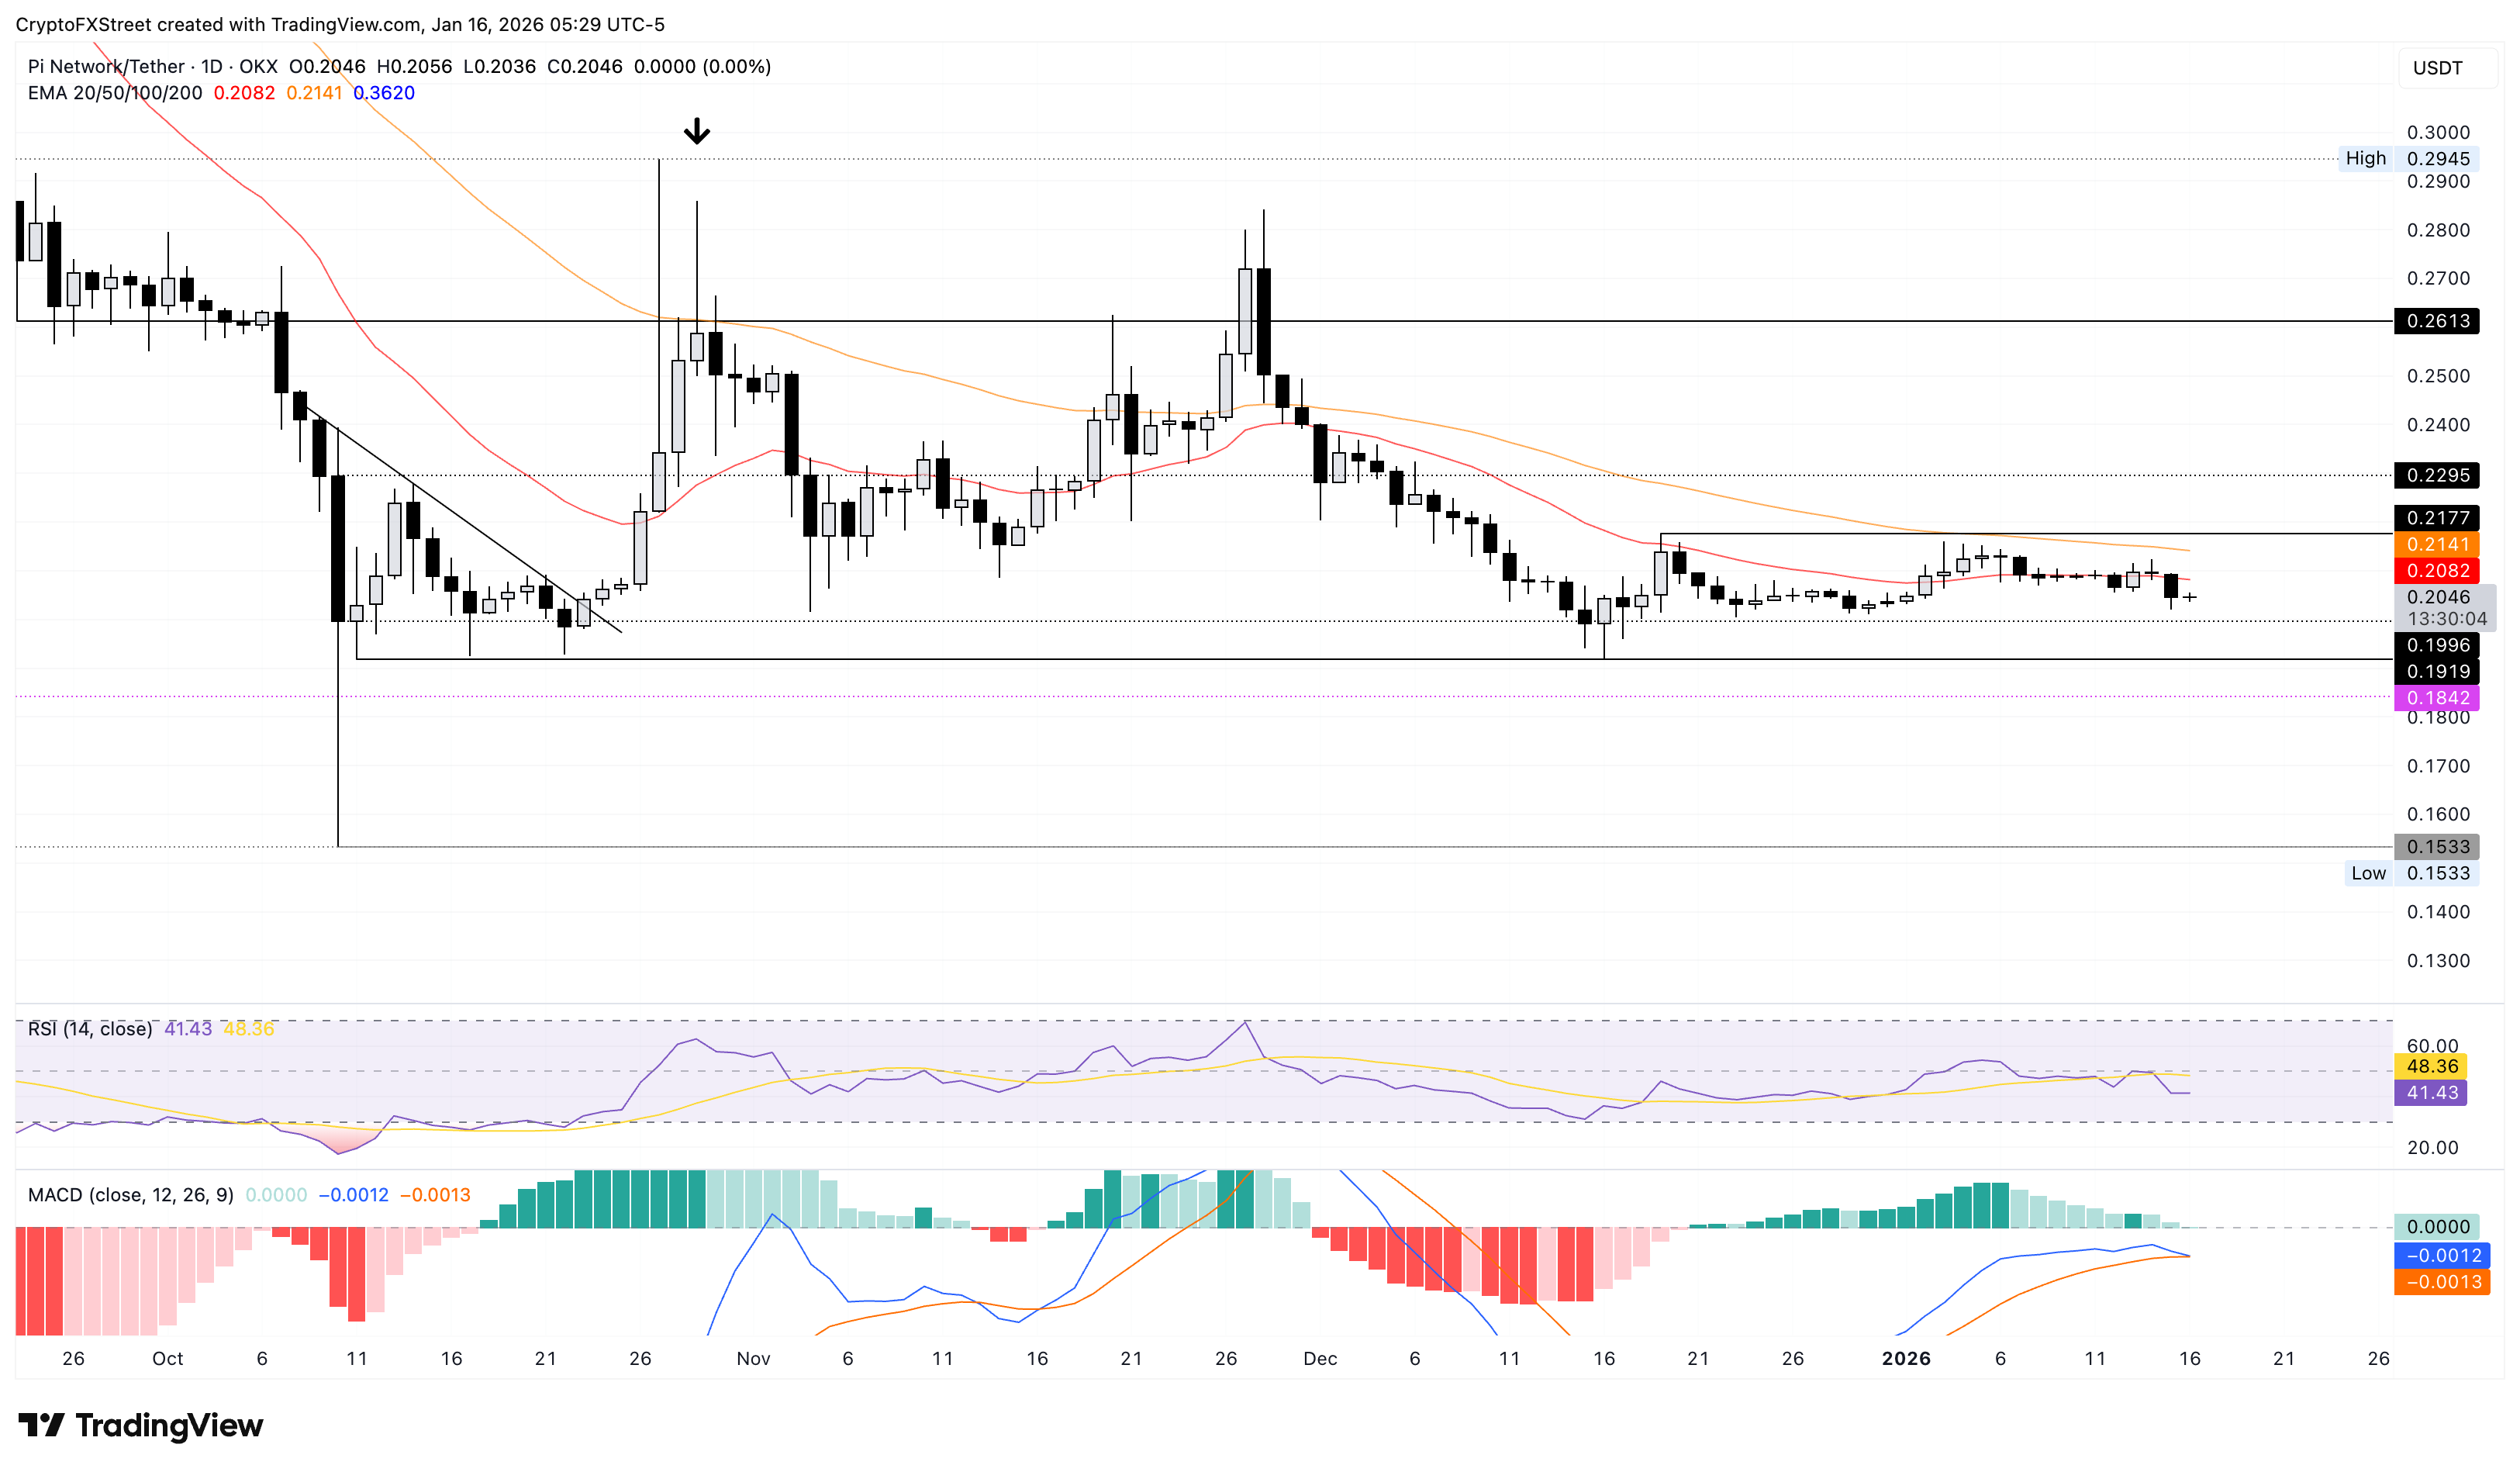
A close below the $0.2000 could increase the selling pressure, targeting $0.1919 and a deeper zone at $0.1842, marked by the October 11 and September 22 lows, respectively.

Mais de um milhão de usuários confiam na FXStreet para dados de mercado em tempo real, ferramentas de gráficos, insights de especialistas e notícias de Forex. Seu calendário econômico abrangente e webinars educacionais ajudam os traders a se manterem informados e tomarem decisões calculadas. A FXStreet conta com uma equipe de cerca de 60 profissionais, divididos entre a sede em Barcelona e diversas regiões globais.
Ler mais


