
Trade The World
USD/CAD Price Forecast: Trades around 1.4100 due to bullish bias
Por Akhtar Faruqui
Data de Publicação: 24 Nov 2025 | Data de Modificação: 24 Nov 2025


POPULAR ARTICLES

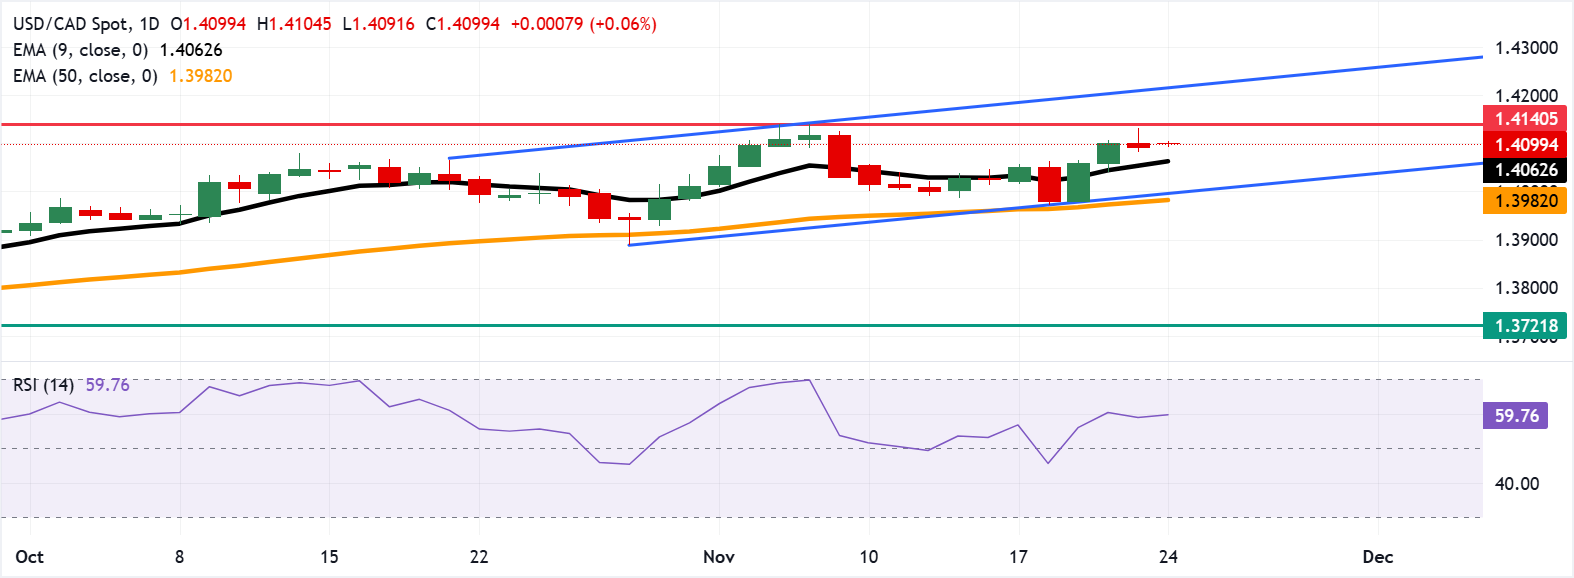
USD/CAD recovers its recent losses from the previous session, trading around 1.4100 during the early European hours on Monday. The daily chart’s technical setup reflects a persistent bullish bias, with the pair remaining within its ascending channel pattern.
- USD/CAD may approach the seven-month high of 1.4140.
- The 14-day Relative Strength Index is positioned at 59.9, reinforcing the bullish momentum.
- The primary support lies at the nine-day EMA of 1.4062.
USD/CAD recovers its recent losses from the previous session, trading around 1.4100 during the early European hours on Monday. The daily chart’s technical setup reflects a persistent bullish bias, with the pair remaining within its ascending channel pattern. The 14-day Relative Strength Index (RSI) trends higher near 59.9, staying above the midline, confirming bullish momentum.
The USD/CAD pair holds above a rising nine-day Exponential Moving Average (EMA) at 1.4063 and the 50-day EMA at 1.3982, keeping the short-term bias pointed higher. The nine-day EMA continues to track above the 50-day EMA, reinforcing topside pressure.
The USD/CAD pair may test the seven-month high of 1.4140, reached on November 5, followed by the crucial level of .4150. Further advances above this level would lead the pair to test the upper boundary of the ascending channel at 1.4210.
On the downside, the initial support appears at the nine-day EMA of 1.4062. A break below this level would weaken the short-term price momentum and prompt the USD/CAD pair to test the ascending channel’s lower boundary around the psychological level of 1.4000, followed by the 50-day EMA at 1.3982.
Canadian Dollar Price Today
The table below shows the percentage change of Canadian Dollar (CAD) against listed major currencies today. Canadian Dollar was the weakest against the Australian Dollar.
| USD | EUR | GBP | JPY | CAD | AUD | NZD | CHF | |
|---|---|---|---|---|---|---|---|---|
| USD | 0.02% | 0.10% | 0.28% | 0.07% | -0.05% | 0.15% | 0.21% | |
| EUR | -0.02% | 0.09% | 0.29% | 0.05% | -0.08% | 0.13% | 0.18% | |
| GBP | -0.10% | -0.09% | 0.18% | -0.03% | -0.16% | 0.06% | 0.09% | |
| JPY | -0.28% | -0.29% | -0.18% | -0.20% | -0.33% | -0.13% | -0.06% | |
| CAD | -0.07% | -0.05% | 0.03% | 0.20% | -0.12% | 0.07% | 0.13% | |
| AUD | 0.05% | 0.08% | 0.16% | 0.33% | 0.12% | 0.20% | 0.26% | |
| NZD | -0.15% | -0.13% | -0.06% | 0.13% | -0.07% | -0.20% | 0.06% | |
| CHF | -0.21% | -0.18% | -0.09% | 0.06% | -0.13% | -0.26% | -0.06% |
The heat map shows percentage changes of major currencies against each other. The base currency is picked from the left column, while the quote currency is picked from the top row. For example, if you pick the Canadian Dollar from the left column and move along the horizontal line to the US Dollar, the percentage change displayed in the box will represent CAD (base)/USD (quote).
(The technical analysis of this story was written with the help of an AI tool.)

FXStreet
Mais de um milhão de usuários confiam na FXStreet para dados de mercado em tempo real, ferramentas de gráficos, insights de especialistas e notícias de Forex. Seu calendário econômico abrangente e webinars educacionais ajudam os traders a se manterem informados e tomarem decisões calculadas. A FXStreet conta com uma equipe de cerca de 60 profissionais, divididos entre a sede em Barcelona e diversas regiões globais.
Read More


