

Торговля
Изучите широкий спектр рынков с конкурентными ценами, высокой ликвидностью и передовыми торговыми инструментами.
Узнать больше 
Платформа
Торгуйте без сбоев на мощной платформе TMGM, созданной для скорости, точности и превосходного торгового опыта.
Узнать больше Торговая платформа
Торговые инструменты
Академия
Изучите основы торговли с помощью материалов для начинающих, включая руководства, вебинары и аналитические обзоры рынка.
Узнать больше Новости и аналитика
Получайте актуальные рыночные обновления и экспертную аналитику, чтобы быть на шаг впереди торговых возможностей
Узнать больше Новости и аналитика
О нас
Узнайте, что отличает TMGM — наше глобальное присутствие, надежное регулирование и приверженность инновациям в трейдинге.
Узнать больше Почему выбирают TMGM
Спонсорство
UK GDP is set to show that the economy continued growing in Q3
- The UK GDP is expected to show stronger economic growth in Q3.
- The Gross Domestic Product is seen accelerating further in the three months to September, boosted by strong manufacturing activity.
- The Pound Sterling against the US Dollar maintains a near-term positive trend, with bulls focusing on the 1.3500 area.
The highlight of the United Kingdom’s (UK) economic calendar this week will be the preliminary estimate of third-quarter Gross Domestic Product (GDP), which the Office for National Statistics will release on Thursday. The market is bracing for 0.7% growth in the three months to September, following 0.5% growth in the second quarter of 2026, with the annual rate accelerating to 1.9%, from 1.4% in the previous month.

Strong Industrial Production data, which is expected to have grown 3% in the 12 months to September, from 1.6% in August, is seen as one of the main drivers of the UK’s economic growth, which, if confirmed, would provide a favourable background for the Bank of England’s (BoE) monetary policy to extend the tightening cycle started last week.
UK GDP forecast: What numbers could tell us
Recent macroeconomic figures from the UK have shown surprising resilience to uncertainty from the war in the Middle East and higher Oil prices, which has improved market expectations about economic growth in the third quarter.
Monthly GDP data from August beat expectations last month, with the economy growing 0.1%, against market expectations of a 0.1% decline, thanks to the strong performance of the manufacturing sector. Factory output grew 0.8% in August, largely offsetting the flat performance of the services sector and a 0.2% decline in construction output.
Beyond that, UK Manufacturing and Services Purchasing Managers’ Index (PMI) figures revealed that business activity continued growing in October, while unemployment declined to its lowest rate since July last year. All in all, a fairly healthy macroeconomic picture, which has prompted the International Monetary Fund to raise the UK's growth projections for 2026 to 1.3% from the previous 1%.
On the political front, a neutral UK budget has contributed to the economic bonanza, calming fears about the hefty public debt, at least for now, and providing support to the British Pound. Lower charges on food and energy bills are expected to be paid for by higher taxes on banks and gambling companies. The feared bond markets have not shown any significant objection to these plans.
All this acknowledged, the third quarter’s GDP report will be analysed with particular attention after last week’s Bank of England rate hike. Economic growth is not a specific target of the BoE’s mandate, but a healthy GDP will doubtless make the central bank’s rate-setting work much easier, considering the stubbornly high consumer inflation data.
Last week, the BoE tightened its monetary policy for the first time in three years. Some policymakers, including Governor Bailey, suggested the bank might need to hike rates further to bring inflation to target. BoE’s Deputy Governor, Clare Lombardelli, went further on Tuesday, affirming that she “would not rule out rate hike possibility in December”. Against this backdrop, a strong GDP reading on Thursday would endorse those views and might spur speculative demand for the Pound.
When will the UK release Q2 Gross Domestic Product, and how could it affect GBP/USD?
As noted, the UK will release the preliminary Q2 GDP estimate on Thursday at 07:00 GMT. Data is expected to show moderate economic growth in the three months to June, with the GBP/USD risk skewed to the upside, as a stronger-than-expected reading will boost odds of another BoE rate hike, most likely in February.
The GBP/USD pair trades around 1.3320 at the time of writing, following a sharp reversal on Tuesday, as strong US inflation data and hawkish comments by Fed speakers boosted the US Dollar across the board. Bears have pushed price action below the bottom of the ascending channel from October, and momentum indicators on the 4-hour chart have turned bearish, with the Relative Strength Index (14) approaching oversold levels and the Moving Average Convergence Divergence (MACD) histogram showing widening red bars.
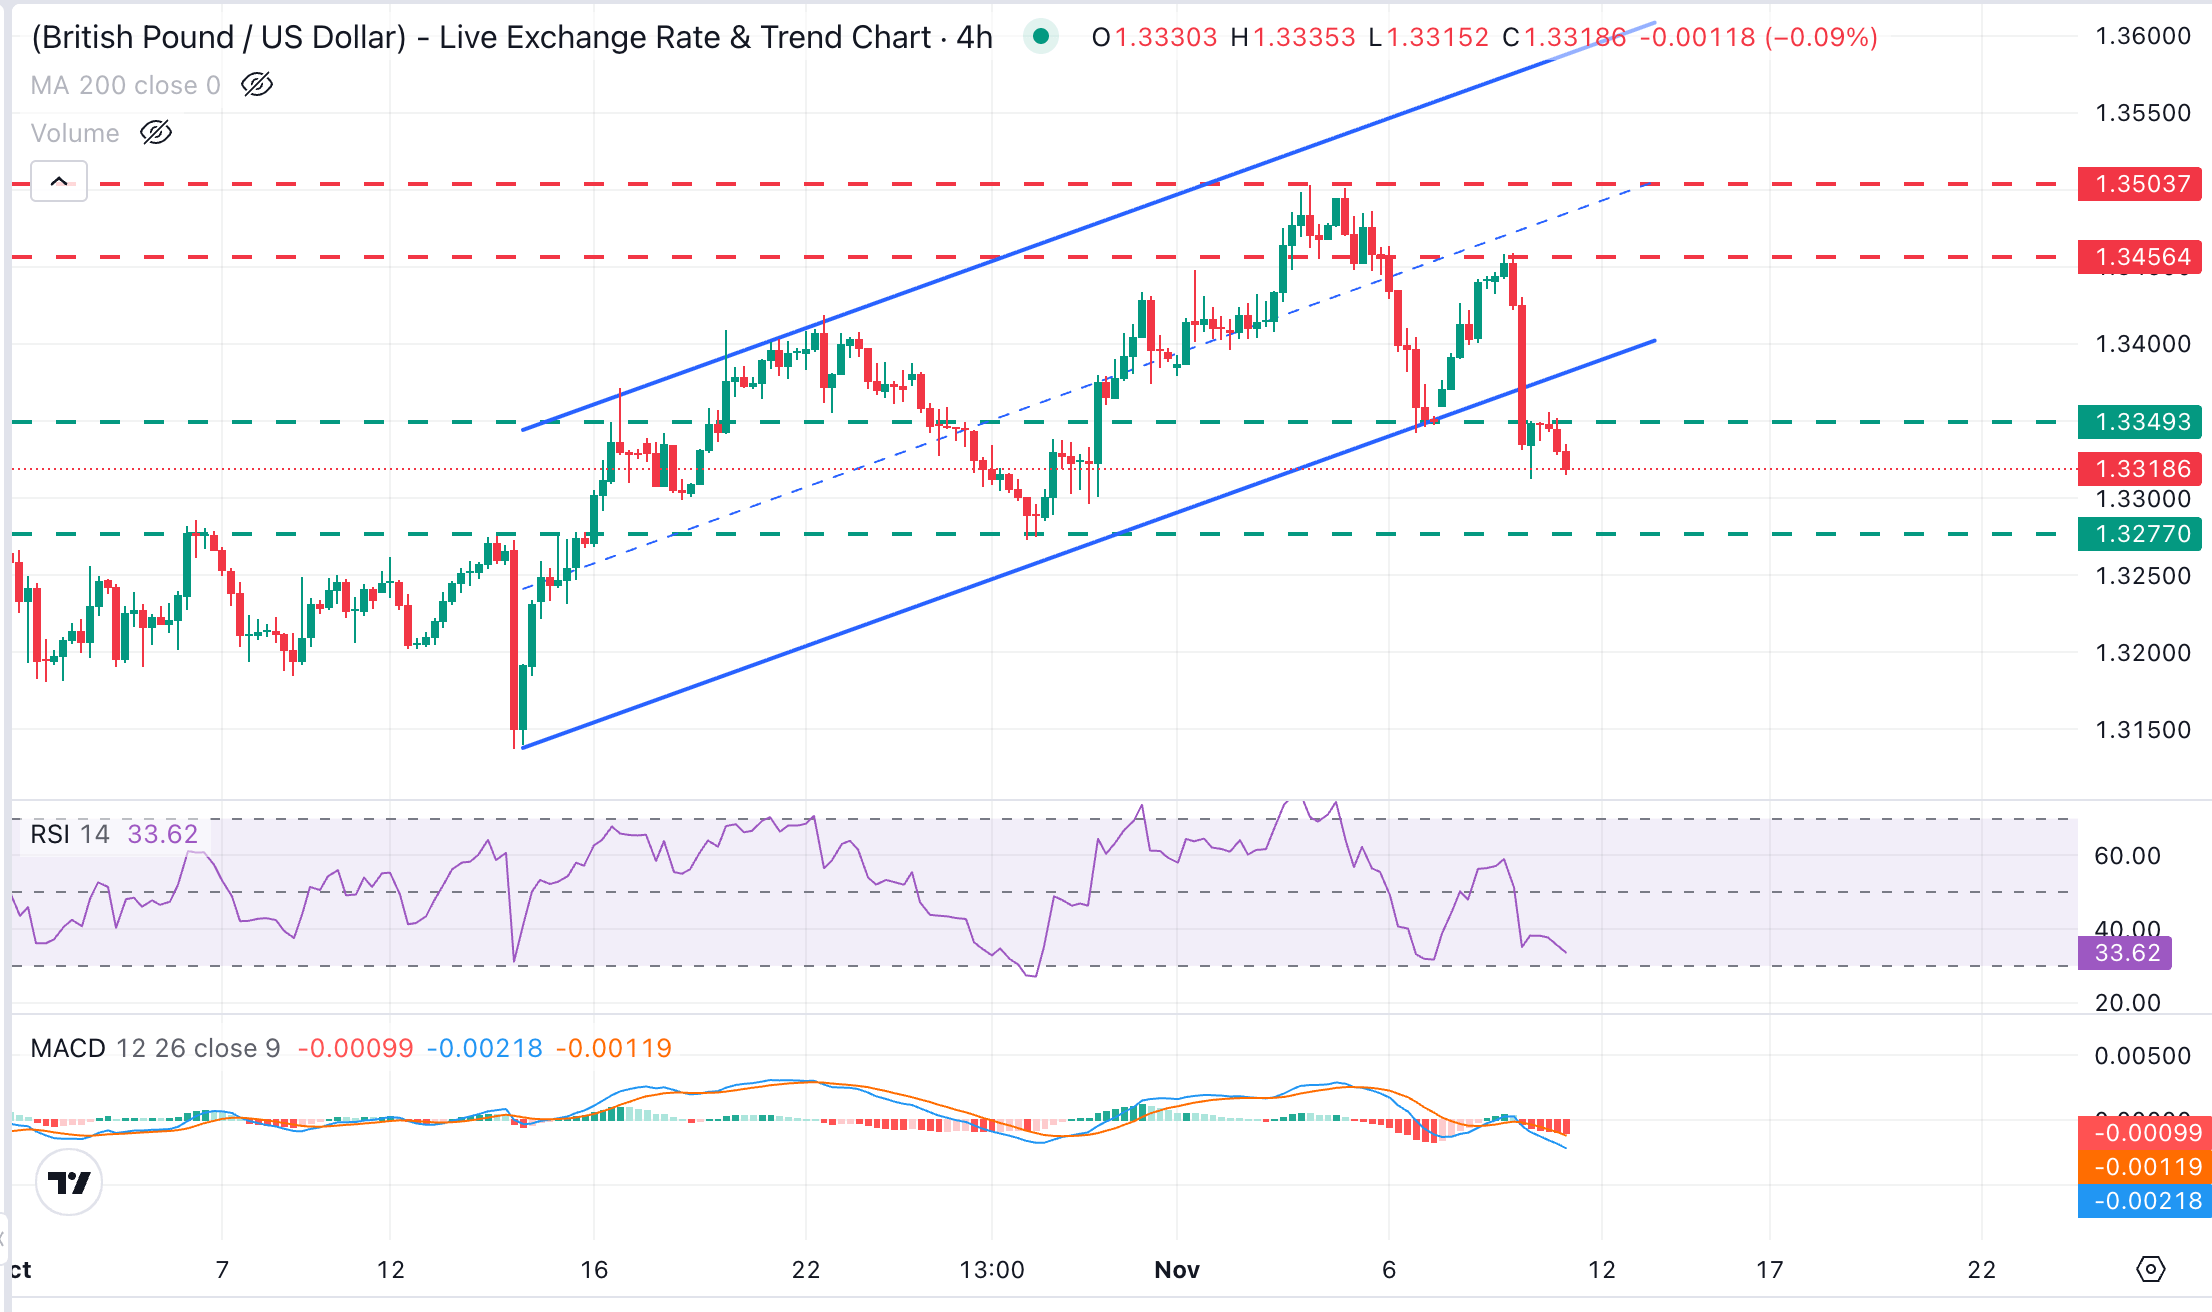
According to Guillermo Alcalá, FX Analyst at FXStreet, “Recent GBP/USD price action suggests that the corrective recovery from mid-October lows might have come to an end, and that the pair is ready to resume the broader bearish trend.”
“While below the channel bottom and the November 6 low, near 1.3340, bears are likely to be tempted to revisit the late October lows near 1.3270, with their gaze on the key resistance area near 1.3130,” says Alcalá.
On the upside, Alcalá argues that “The pair would need to return above the broken trendline support, now around 1.3380, to ease bearish pressure, and shift the focus back towards the November 10 high near 1.3460 and the November peak, in the 1.3500 area.”
Economic Indicator
Gross Domestic Product (QoQ)
The Gross Domestic Product (GDP), released by the Office for National Statistics on a monthly and quarterly basis, is a measure of the total value of all goods and services produced in the UK during a given period. The GDP is considered as the main measure of UK economic activity. The QoQ reading compares economic activity in the reference quarter to the previous quarter. Generally, a rise in this indicator is bullish for the Pound Sterling (GBP), while a low reading is seen as bearish.
Read more.Next release: Thu Nov 12, 2026 07:00 (Prel)
Frequency: Quarterly
Consensus: 0.7%
Previous: 0.5%
Source: Office for National Statistics
BoE FAQs
The Bank of England (BoE) decides monetary policy for the United Kingdom. Its primary goal is to achieve ‘price stability’, or a steady inflation rate of 2%. Its tool for achieving this is via the adjustment of base lending rates. The BoE sets the rate at which it lends to commercial banks and banks lend to each other, determining the level of interest rates in the economy overall. This also impacts the value of the Pound Sterling (GBP).
When inflation is above the Bank of England’s target it responds by raising interest rates, making it more expensive for people and businesses to access credit. This is positive for the Pound Sterling because higher interest rates make the UK a more attractive place for global investors to park their money. When inflation falls below target, it is a sign economic growth is slowing, and the BoE will consider lowering interest rates to cheapen credit in the hope businesses will borrow to invest in growth-generating projects – a negative for the Pound Sterling.
In extreme situations, the Bank of England can enact a policy called Quantitative Easing (QE). QE is the process by which the BoE substantially increases the flow of credit in a stuck financial system. QE is a last resort policy when lowering interest rates will not achieve the necessary result. The process of QE involves the BoE printing money to buy assets – usually government or AAA-rated corporate bonds – from banks and other financial institutions. QE usually results in a weaker Pound Sterling.
Quantitative tightening (QT) is the reverse of QE, enacted when the economy is strengthening and inflation starts rising. Whilst in QE the Bank of England (BoE) purchases government and corporate bonds from financial institutions to encourage them to lend; in QT, the BoE stops buying more bonds, and stops reinvesting the principal maturing on the bonds it already holds. It is usually positive for the Pound Sterling.
Лучшие статьи
1Австралийский доллар остается под давлением на фоне сокращения профицита торгового баланса Китая в октябре2Профицит торгового баланса Китая в октябре сократился сильнее ожиданий и составил 712,72 млрд юаней.3Индекс доллара США (DXY) почти не меняется вблизи отметки 101,70 в ожидании данных по CPI в США на фоне неопределенности вокруг Ирана4Экспорт Китая в октябре вырос на 35,2% в годовом выражении, превысив ожидания в 33,5%.5Импорт Китая в октябре превысил ожидания (32%): фактическое значение составило 41,6% г/г6Торговый баланс Китая составил $105,28 млрд, что ниже ожиданий ($125,8 млрд) в октябре.7Сальдо торгового баланса Китая (CNY) в октябре составило 712,78 млрд, что ниже ожиданий в 859 млрд.8Экспорт Китая (г/г, CNY) в октябре снизился до 28,7% с предыдущих 29,6%.9Новозеландский доллар стабилизировался: переговоры по Ирану не смогли подтолкнуть пару NZD/USD вверх.


Начать!
Зарегистрируйтесь и получите доступ к глобальным рынкам менее чем за 3 минуты

Свяжитесь с нами









Контакты
Телефон: +61 2 8036 8388
Факс: +61 2 8036 8388
Эл. почта: support@tmgm.com
Веб-сайт: https://www.tmgm.com



Информация, представленная на этом веб-сайте, носит исключительно общий характер и не является персональной финансовой консультацией. Прежде чем действовать на основании любой информации на этом веб-сайте, вам следует оценить ее уместность с учетом ваших целей, финансового положения и потребностей. Инвестирование в CFD и маржинальные контракты на FX сопряжено со значительными рисками и подходит не всем инвесторам. Вы можете потерять больше, чем ваш первоначальный депозит. Вы не владеете базовым активом и не имеете в нем какой-либо доли. Мы рекомендуем вам обратиться за независимой консультацией и убедиться, что вы полностью понимаете связанные с этим риски, прежде чем начинать торговлю. Важно прочитать и принять во внимание документ с раскрытием информации, прежде чем приобретать любой продукт, указанный на веб-сайте. Информация и рекламные материалы, предлагаемые на этом веб-сайте, не предназначены для использования любым лицом в любой стране или юрисдикции, где такое использование противоречило бы местным законам и нормативным актам. Продукты и услуги, предлагаемые на этом веб-сайте, не предназначены для резидентов США, Малайзии и Таиланда.
TMGM уполномочена и регулируется в различных юрисдикциях.
Trademax Australia Limited, работающая под брендом TMGM, регулируется Australian Securities and Investments Commission (ASIC), AFSL № 436416 и находится по адресу: Level 28, One International Tower, 100 Barangaroo Avenue, 2000 Sydney, NSW Australia.
Email: support@tmgm.com.au
Trademax Global Limited, работающая под брендом TMGM, уполномочена и регулируется Vanuatu Financial Services Commission (VFSC), регистрационный номер 40356, и зарегистрирована по адресу: 1276, Kumul Highway, Port Vila, Vanuatu, Republic of Vanuatu.
Email: support@tmgm.com
Trademax Global Markets (SE) Limited, работающая под брендом TMGM, уполномочена и регулируется Financial Services Authority (FSA) Сейшельских Островов, номер лицензии SD224. Компания зарегистрирована по адресу: Office No 13, Providence Estate ABIS Centre, Mahe, Seychelles.
Email: support@tmgm.com
Trademax Global Markets (International) Pty Ltd, работающая под брендом TMGM, уполномочена и регулируется Financial Services Commission, Mauritius (FSC), лицензия № GB22201012, и зарегистрирована по адресу: 33, Edith Cavell Street C/o IQ EQ Fund Services (Mauritius) Ltd Port Louis, 11324 Mauritius.
Email: support@tmgm.com
Авторское право © TMGM. Все права защищены