


ทำความเข้าใจระดับ Fibonacci Retracement
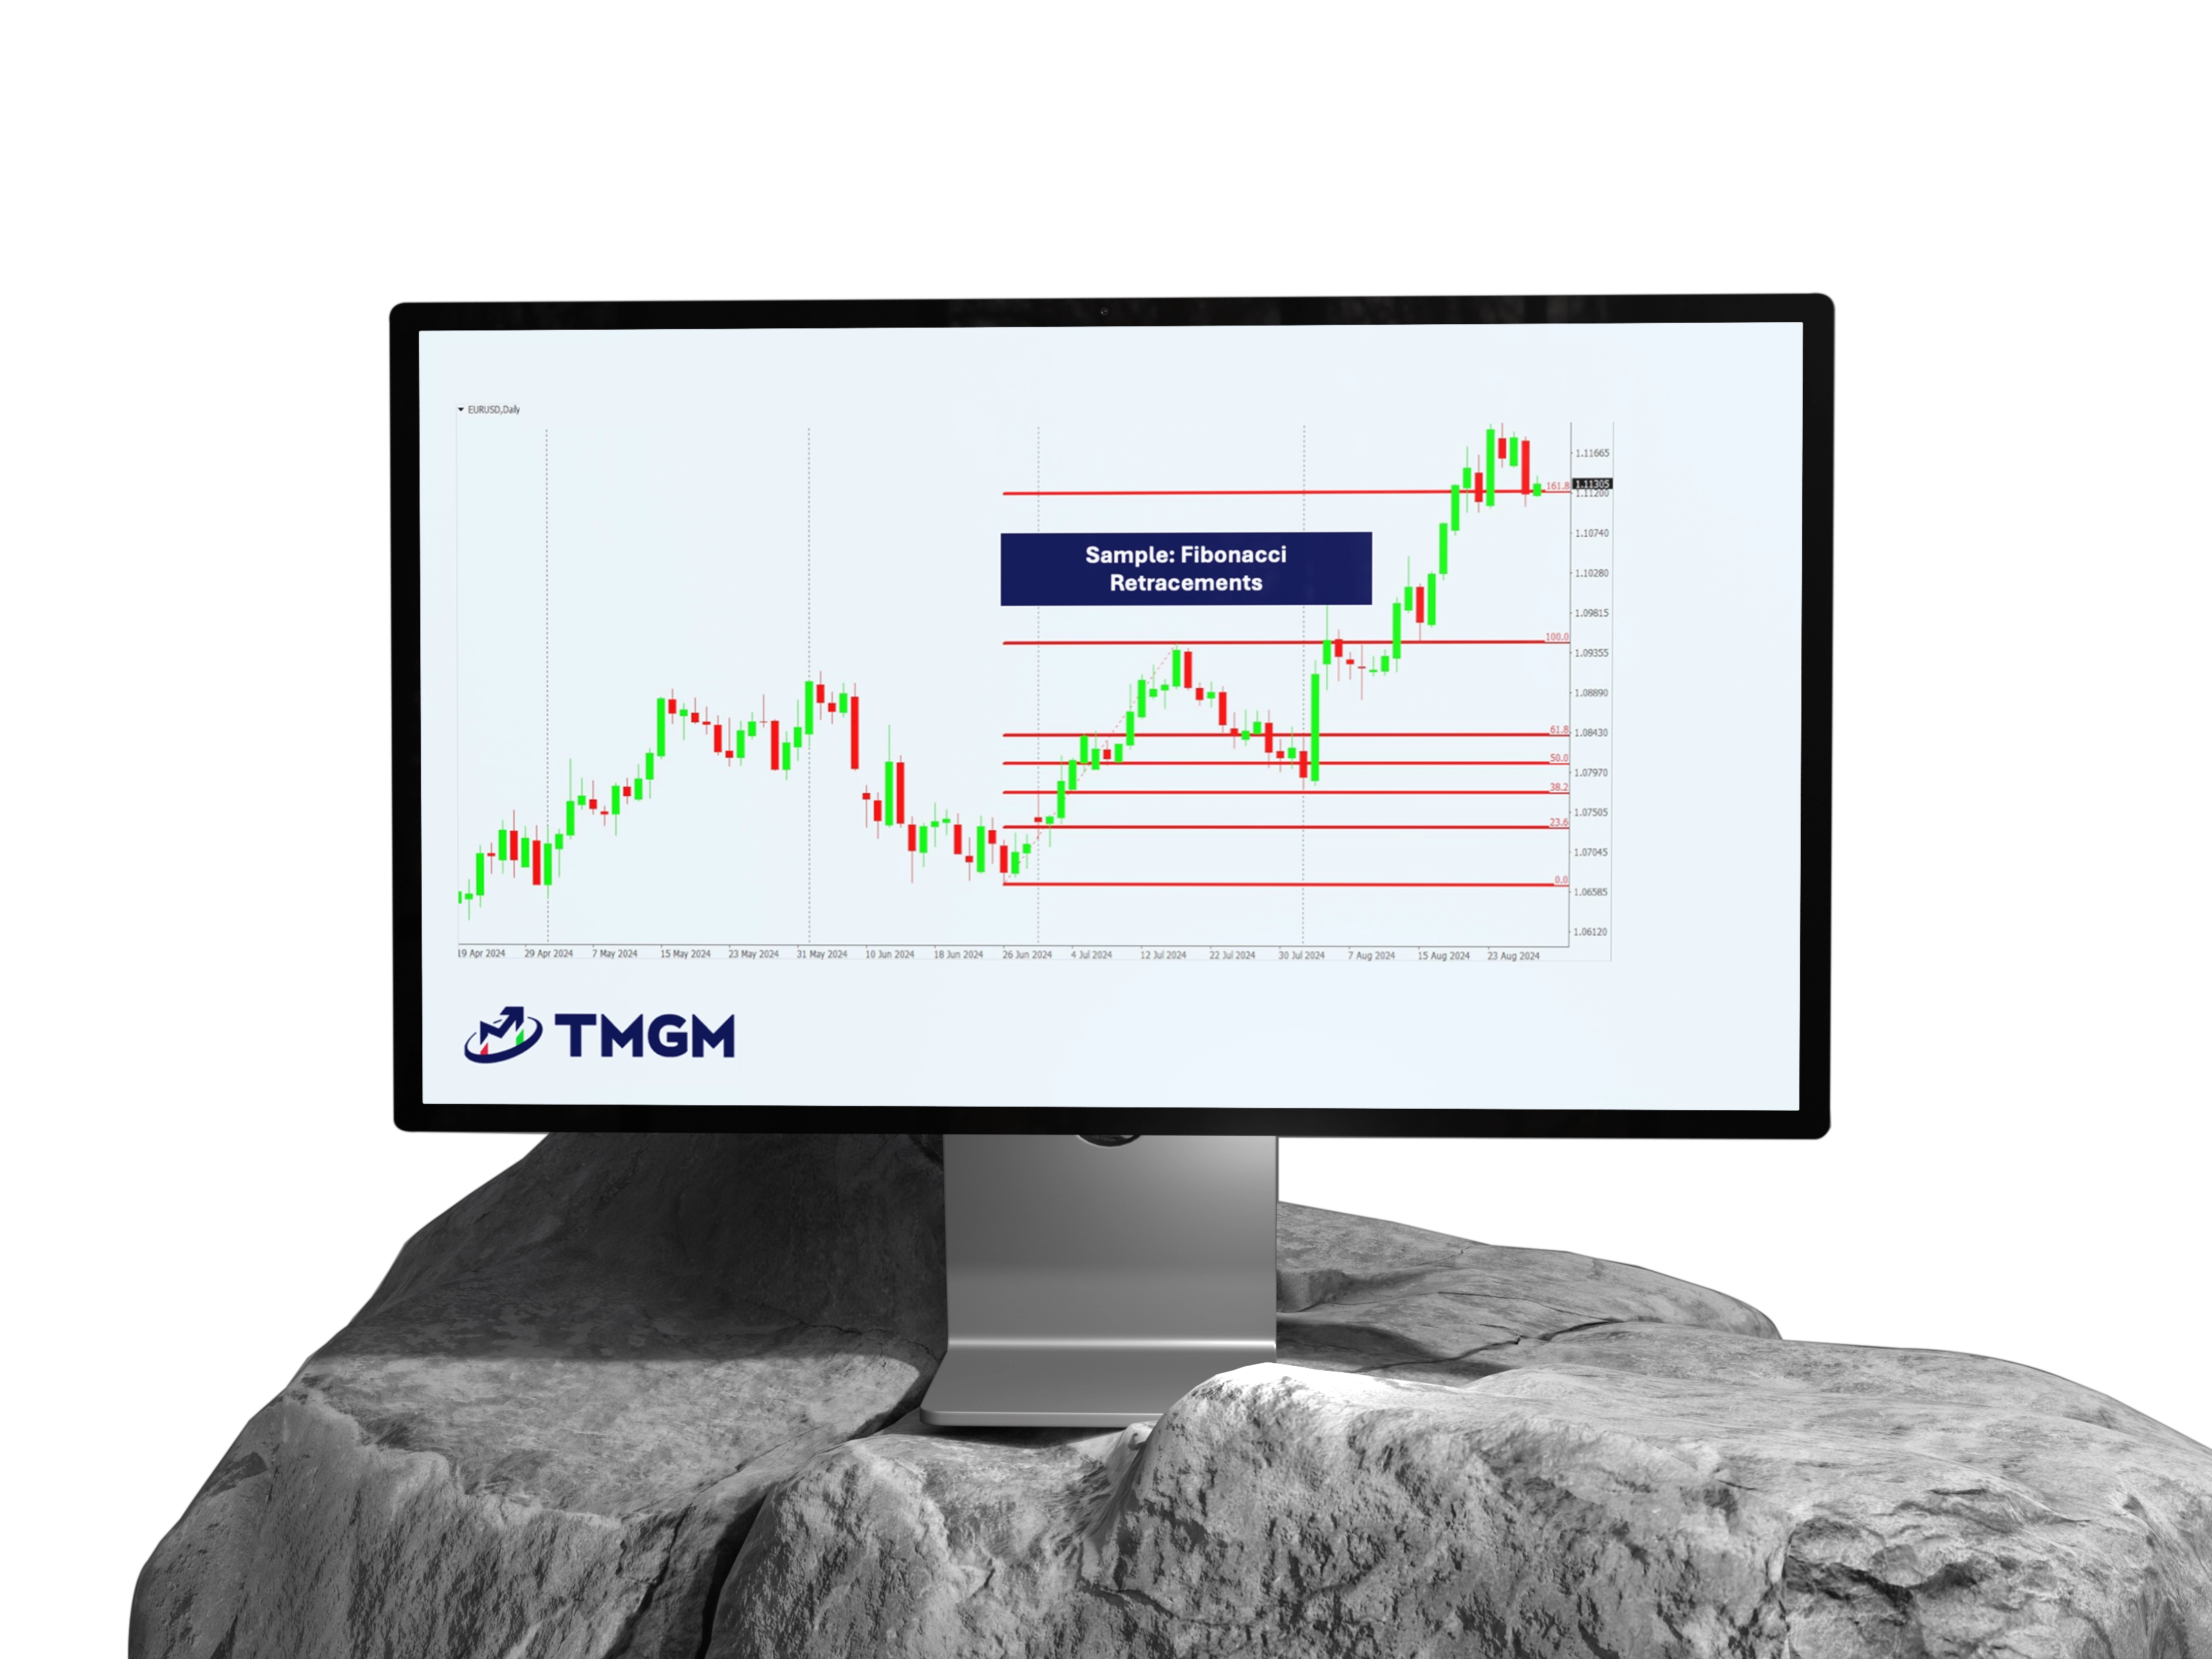
ระดับ Fibonacci retracement คือการคำนวณทางคณิตศาสตร์ที่ได้มาจากลำดับฟีโบนักชี (Fibonacci sequence) ระดับเหล่านี้ช่วยให้นักเทรดสามารถระบุจุดที่ราคามีแนวโน้มจะกลับตัวหรือต่อเนื่องได้อย่างแม่นยำ
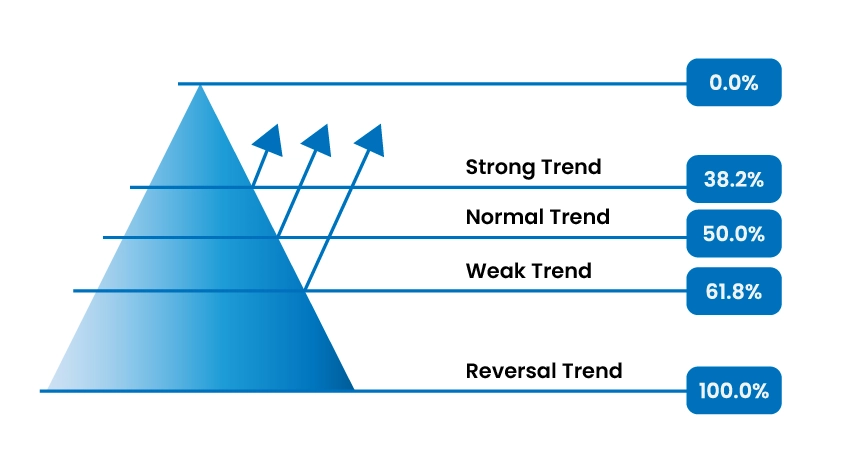
23.6% – บ่งชี้การปรับฐานที่ตื้นในแนวโน้มที่แข็งแกร่ง
38.2% และ 50.0% – เน้นพื้นที่ปรับฐานในระดับปานกลาง มักใช้เป็นจุดเข้าซื้อขาย
61.8% (อัตราส่วนทองคำ) – เป็นระดับที่สำคัญที่สุด แสดงถึงแนวรับหรือแนวต้านที่แข็งแกร่ง
100% – แสดงถึงการปรับฐานเต็มที่กลับสู่จุดราคาเริ่มต้น
ระดับเหล่านี้จะแสดงบนกราฟราคาโดยใช้เครื่องมือ Fibonacci ซึ่งช่วยให้นักเทรดสามารถระบุโซนที่น่าสนใจได้อย่างง่ายดาย
เหตุใด Fibonacci จึงได้ผลในการเทรด
ระดับ Fibonacci ทำงานได้อย่างมีประสิทธิภาพในการเทรดด้วยเหตุผลหลายประการ:
ผลกระทบทางจิตวิทยา: นักเทรดจำนวนมากเฝ้าสังเกตระดับเหล่านี้ ทำให้เกิดผลลัพธ์ตามความคาดหวัง
รูปแบบธรรมชาติ: ตลาดมักแสดงพฤติกรรมราคาที่สอดคล้องกับลำดับฟีโบนักชี
ความชัดเจนของแนวรับและแนวต้าน: ให้ระดับที่ชัดเจนสำหรับการตอบสนองของราคา
ความยืดหยุ่น: ใช้งานได้ในสภาวะตลาดและกรอบเวลาต่าง ๆ
วิธีใช้ Fibonacci ในการเทรด
คู่สกุลเงิน: EUR/USD
กรอบเวลา: กราฟ 1 ชั่วโมง
ขั้นตอนการใช้งาน:
ขั้นตอนที่ 1: ระบุแนวโน้ม
คุณสังเกตเห็นว่า EUR/USD กำลังปรับตัวขึ้นอย่างต่อเนื่อง โดยทำจุดสูงสุดและต่ำสุดที่สูงขึ้นอย่างสม่ำเสมอ ยืนยันด้วยสายค่าเฉลี่ยเคลื่อนที่ 50 ช่วงเวลา พบว่าราคายืนเหนือเส้นค่าเฉลี่ยเคลื่อนที่อย่างชัดเจน ซึ่งบ่งชี้ถึง แนวโน้มขาขึ้น.
ขั้นตอนที่ 2: ใช้เครื่องมือ Fibonacci
เนื่องจากคุณระบุได้ว่าเป็น แนวโน้มขาขึ้น ให้เลือกเครื่องมือ Fibonacci retracement จากแพลตฟอร์มเทรดของคุณ วาดจากจุดต่ำสุดที่ชัดเจนล่าสุด (เช่น 1.0900) ไปยังจุดสูงสุดล่าสุด (เช่น 1.1100)
จุดต่ำสุด: 1.0900
จุดสูงสุด: 1.1100
ขั้นตอนที่ 3: ติดตามระดับการปรับฐาน
ระดับ Fibonacci retracement จะปรากฏโดยอัตโนมัติที่ 38.2%, 50.0% และ 61.8%:
ระดับ 38.2%: ประมาณ 1.1024
ระดับ 50.0%: ประมาณ 1.1000
ระดับ 61.8%: ประมาณ 1.0976
ขณะที่คุณเฝ้าดู ราคา EUR/USD ค่อยๆ ปรับฐานและเข้าใกล้ ระดับ 61.8% (1.0976) ซึ่งโดยประวัติศาสตร์แล้วเป็นพื้นที่แนวรับที่แข็งแกร่งและจุดกลับตัวที่มีศักยภาพ
ขั้นตอนที่ 4: ยืนยันด้วยตัวชี้วัดอื่นๆ
ที่ ระดับ Fibonacci retracement 61.8% (1.0976) คุณสังเกตเห็นว่า:
ดัชนี RSI (Relative Strength Index) ลดลงต่ำกว่า 30 ซึ่งบ่งชี้ว่าตลาดอยู่ในภาวะขายเกิน
เกิดรูปแบบแท่งเทียนขาขึ้น โดยเฉพาะรูปแบบ bullish engulfing ที่ชัดเจน ซึ่งยืนยันเพิ่มเติมว่าผู้ซื้อกำลังกลับเข้าสู่ตลาด
ด้วยสัญญาณเหล่านี้ที่สอดคล้องกัน คุณจึงมีสัญญาณที่แข็งแกร่งถึงโอกาสกลับตัวของราคาในระดับ Fibonacci นี้ ดังนั้นคุณจึงเปิดสถานะ ซื้อ (long) ใกล้ระดับ 1.0976 โดยวางจุดตัดขาดทุน (stop-loss) เล็กน้อยต่ำกว่าระดับปรับฐาน (เช่น ที่ 1.0950) โดยตั้งเป้าหมายกำไรที่จุดสูงสุดก่อนหน้าที่ 1.1100 หรือสูงกว่า
กลยุทธ์ Fibonacci สำคัญ
1. การเทรดกลับตัว (ใช้ Fibonacci Retracement)
วัตถุประสงค์:
ระบุจุดกลับตัวของตลาดที่มีแนวโน้มราคาจะเปลี่ยนทิศทางหลังจากปรับฐานถึงระดับ Fibonacci สำคัญ
ขั้นตอนการใช้งาน:
การตั้งค่า:
มองหาการปรับฐานของราคาในตลาดที่มีแนวโน้ม โดยเน้นที่ ระดับ Fibonacci retracement 38.2% หรือ 61.8% เนื่องจากระดับเหล่านี้มักเป็นแนวรับหรือแนวต้านที่แข็งแกร่ง กระตุ้นให้เกิดการกลับตัวเกณฑ์เข้าซื้อขาย:
รอสัญญาณกลับตัวที่ชัดเจน เช่น:รูปแบบแท่งเทียน: Pin bars, แท่ง engulfing ขาขึ้น/ขาลง, แท่ง hammer หรือ shooting star
ยืนยันด้วยตัวชี้วัด: สัญญาณตลาดขายเกินหรือซื้อมากเกินไป (RSI ต่ำกว่า 30 หรือสูงกว่า 70)
ตัวอย่างเช่น หากราคาปรับฐานถึงระดับ 61.8% ในแนวโน้มขาขึ้น ให้เฝ้าดูแท่งเทียน bullish engulfing หรือรูปแบบ pin bar ที่ระดับนี้เพื่อสัญญาณเข้าซื้อ
การวางจุดตัดขาดทุน:
วางจุดตัดขาดทุนต่ำกว่าระดับ Fibonacci ถัดไป (สำหรับการซื้อ) หรือสูงกว่าระดับ Fibonacci ถัดไป (สำหรับการขาย) เพื่อให้มีพื้นที่เพียงพอสำหรับความผันผวนของตลาดในขณะที่ควบคุมความเสี่ยงได้เป้าหมายกำไร:
ตั้งเป้าหมายที่จุดสูงสุดก่อนหน้า (ในแนวโน้มขาขึ้น) หรือจุดต่ำสุดก่อนหน้า (ในแนวโน้มขาลง) หรือขยายเป้าหมายไปยังระดับ Fibonacci extension ถัดไป (เช่น 127.2% หรือ 161.8%) เพื่อเพิ่มศักยภาพกำไร
เคล็ดลับปฏิบัติ:
ตรวจสอบการกลับตัวด้วยการยืนยันทางเทคนิคเพิ่มเติม เช่น RSI, Stochastic หรือ MACD เพื่อลดสัญญาณเท็จ
2. การเทรดเบรกเอาท์ (ใช้ระดับ Fibonacci)
วัตถุประสงค์:
จับจังหวะการเคลื่อนไหวของตลาดที่สำคัญหลังช่วงเวลาการพักตัวใกล้ระดับ Fibonacci สำคัญ
ขั้นตอนการใช้งาน:
การตั้งค่า:
มองหาพฤติกรรมการพักตัวหรือการเคลื่อนไหวในกรอบแคบใกล้ระดับ Fibonacci retracement ที่สำคัญ ยิ่งพักตัวนาน ยิ่งมีศักยภาพเบรกเอาท์ที่แข็งแกร่งเกณฑ์เข้าซื้อขาย:
รอแท่งเทียนเบรกเอาท์ที่ปิดเหนือหรือต่ำกว่าระดับ Fibonacci ที่ระบุอย่างชัดเจน
การยืนยันเพิ่มเติม: ปริมาณการซื้อขายที่เพิ่มขึ้นหรือตัวชี้วัดโมเมนตัม เช่น MACD ช่วยยืนยันความน่าเชื่อถือของเบรกเอาท์การวางจุดตัดขาดทุน:
วางจุดตัดขาดทุนอย่างปลอดภัยภายในโซนพักตัวล่าสุด เช่น หากราคาทะลุขึ้นเหนือระดับ Fibonacci ให้วางจุดตัดขาดทุนต่ำกว่าขอบเขตล่างของโซนพักตัวเล็กน้อยเป้าหมายกำไร:
ตั้งเป้าหมายที่ระดับ Fibonacci extension เช่น 127.2% หรือ 161.8% ซึ่งเป็นเป้าหมายกำไรที่ชัดเจนและวัดผลได้
เคล็ดลับปฏิบัติ:
ระวังเบรกเอาท์ปลอม (false breakouts) ยืนยันด้วยปริมาณการซื้อขายและตัวชี้วัดโมเมนตัมก่อนเปิดสถานะ
3. การใช้ Fibonacci Extensions สำหรับเทรนด์เทรด
วัตถุประสงค์:
ใช้ระดับ Fibonacci extension เพื่อกำหนดเป้าหมายราคาที่สมเหตุสมผลและมีกำไรในสภาวะตลาดที่มีแนวโน้มชัดเจน
ขั้นตอนการใช้งาน:
การตั้งค่า:
ยืนยันแนวโน้มที่แข็งแกร่งโดยตรวจสอบการเคลื่อนไหวของราคา เช่น จุดสูงสุดและต่ำสุดที่สูงขึ้นสำหรับแนวโน้มขาขึ้น หรือจุดสูงสุดและต่ำสุดที่ต่ำลงสำหรับแนวโน้มขาลงการวาด Fibonacci Extensions:
ระบุจุด swing low และ swing high ที่สำคัญล่าสุดบนกราฟ จากนั้นวาดเครื่องมือ Fibonacci extension จาก swing low ไป swing high แล้วลากกลับลงไปยังจุด retracement low (ในแนวโน้มขาขึ้น) หรือในทางกลับกันสำหรับแนวโน้มขาลงการระบุเป้าหมาย:
ติดตามระดับ extension เช่น 127.2%, 138.2% และโดยเฉพาะ 161.8% เนื่องจากราคามักมีปฏิกิริยาแรงที่ระดับเหล่านี้ ซึ่งเป็นเป้าหมายที่เหมาะสมสำหรับการทำกำไรหรือการทยอยปิดสถานะการวางจุดตัดขาดทุน:
ตั้งจุดตัดขาดทุนอย่างมีเหตุผลต่ำกว่าจุด swing low ล่าสุด (สำหรับการซื้อ) หรือสูงกว่าจุด swing high ล่าสุด (สำหรับการขาย) เพื่อรักษาสัดส่วนความเสี่ยงต่อผลตอบแทนที่เหมาะสมการบริหารจัดการการเทรด:
เมื่อราคากำลังเข้าใกล้ระดับ Fibonacci extension ให้พิจารณาเลื่อนจุดตัดขาดทุนเพื่อรักษากำไร หรือทยอยปิดสถานะบางส่วนที่แต่ละระดับเป้าหมาย
เคล็ดลับปฏิบัติ:
ผสมผสาน Fibonacci extension กับตัวชี้วัดติดตามแนวโน้ม เช่น ค่าเฉลี่ยเคลื่อนที่ หรือ ADX เพื่อยืนยันความแข็งแกร่งของแนวโน้ม เพิ่มความมั่นใจในเป้าหมายราคาของคุณ
ข้อดีของการเทรดด้วย Fibonacci
ใช้งานง่าย: รองรับกับแพลตฟอร์มกราฟส่วนใหญ่
ใช้งานได้หลากหลาย: ใช้ได้กับตลาดสินค้าโภคภัณฑ์และคริปโต
การบริหารความเสี่ยง: ให้ระดับที่แม่นยำสำหรับการตั้ง stop-loss และ take-profit
เพิ่มความแม่นยำ: ช่วยระบุโอกาสเทรดที่มีความน่าจะเป็นสูง
ข้อเสียและข้อควรระวัง
ความเป็นอัตวิสัย: การเลือกจุด swing อาจแตกต่างกันในแต่ละนักเทรด
ล่าช้า: อ้างอิงข้อมูลในอดีต ไม่ใช่การทำนาย
สัญญาณเท็จ: จำเป็นต้องได้รับการยืนยันจากตัวชี้วัดเพิ่มเติม
เคล็ดลับสู่ความสำเร็จในการเทรด Fibonacci
วิเคราะห์หลายกรอบเวลา: ใช้กรอบเวลาที่สูงกว่าเพื่อหาพื้นที่แนวร่วมที่แข็งแกร่ง
ผสมผสานเครื่องมือ: จับคู่ Fibonacci กับตัวชี้วัดทางเทคนิค เช่น RSI หรือ MACD
ทดสอบย้อนหลังอย่างละเอียด: ทดสอบกลยุทธ์กับข้อมูลในอดีตก่อนใช้งานจริง
บริหารความเสี่ยง: ใช้คำสั่ง stop-loss เสมอและปฏิบัติตามกฎการจัดการขนาดตำแหน่งอย่างเคร่งครัด
กลยุทธ์การเทรด Fibonacci เป็นเครื่องมือสำคัญสำหรับนักเทรดที่ต้องการความแม่นยำและโครงสร้างในแผนการเทรด ด้วยการเข้าใจระดับ retracement การผสานกับเครื่องมือทางเทคนิคอื่น ๆ และการบริหารความเสี่ยงอย่างมีวินัย นักเทรดสามารถดำเนินการในตลาดด้วยความมั่นใจและประสบความสำเร็จมากขึ้น
เริ่มเทรดอย่างชาญฉลาดด้วย Fibonacci วันนี้! เปิดบัญชี TMGM เพื่อเข้าถึงตลาด ใช้เครื่องมือกราฟมืออาชีพ และพัฒนากลยุทธ์ของคุณในสภาพแวดล้อมที่ปลอดภัยจากความเสี่ยง


