รูปแบบกลับตัวขาขึ้น
รูปแบบเหล่านี้ปรากฏหลังจากแนวโน้มขาลงและบ่งชี้ถึงความเป็นไปได้ของการกลับตัวขึ้นด้านบน
1. แฮมเมอร์แคนเดิล
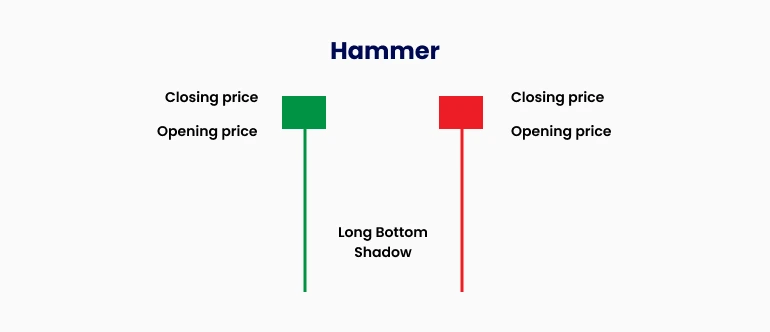
คำอธิบาย: มีตัวแท่งเล็กอยู่ด้านบนพร้อมกับไส้เทียนยาวด้านล่างซึ่งโดยทั่วไปจะยาวเป็นสองเท่าของตัวแท่ง
ความหมาย: บ่งชี้ถึงการปฏิเสธราคาที่ต่ำลงและสัญญาณแรงกดดันซื้อที่อาจเกิดขึ้น
บริบท: ปรากฏหลังจากแนวโน้มขาลงและมักทำหน้าที่เป็นสัญญาณแรกของการกลับตัวขาขึ้น
2. อินเวอร์เต็ดแฮมเมอร์แคนเดิล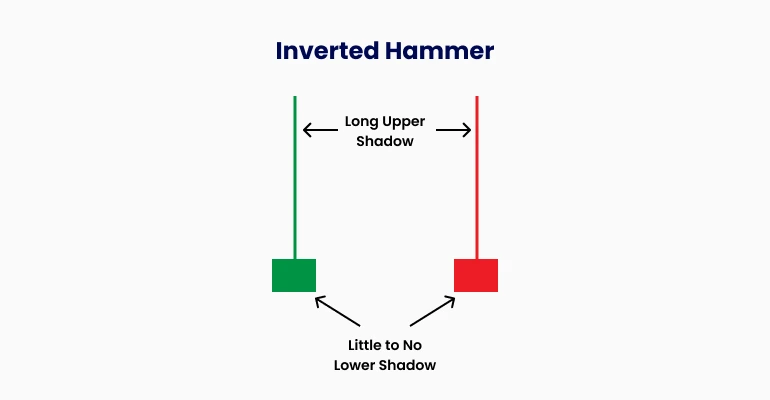
คำอธิบาย: มีตัวแท่งเล็กอยู่ด้านล่างพร้อมกับไส้เทียนยาวด้านบน
ความหมาย: บ่งชี้ถึงความเป็นไปได้ของการกลับตัวขาขึ้น เนื่องจากแรงกดดันขายลดลงใกล้สิ้นสุดแนวโน้มขาลง
การยืนยัน: ต้องการแท่งเทียนขาขึ้นตามมาเพื่อยืนยันการกลับตัว
3. บูลลิชอิงกัลฟิง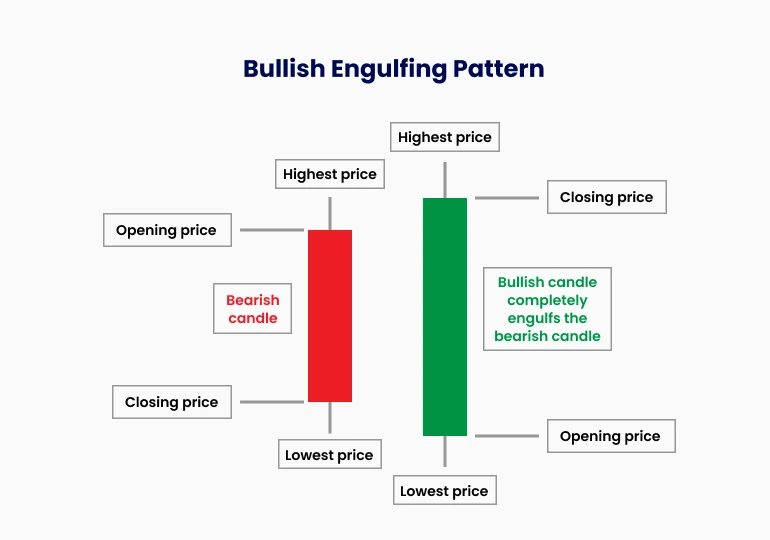
คำอธิบาย: แท่งเทียนสีเขียว (ขาขึ้น) ที่กลืนแท่งเทียนสีแดง (ขาลง) ก่อนหน้าอย่างสมบูรณ์
ความหมาย: แสดงถึงแรงซื้อที่แข็งแกร่ง มักนำไปสู่การเคลื่อนไหวขึ้นต่อเนื่อง
4. เพียร์ซิงไลน์
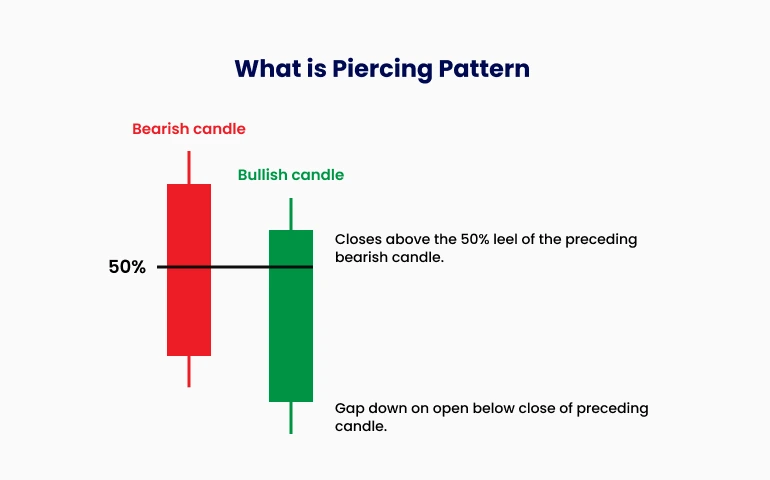
คำอธิบาย: รูปแบบสองแท่งเทียนที่แท่งที่สองเปิดต่ำกว่าแต่ปิดเหนือจุดกึ่งกลางของแท่งเทียนขาลงแท่งแรก
ความหมาย: สัญญาณการแทรกแซงของผู้ซื้ออย่างแข็งแกร่ง บ่งชี้ถึงความเป็นไปได้ของการกลับตัวแนวโน้ม
5. มอร์นิงสตาร์
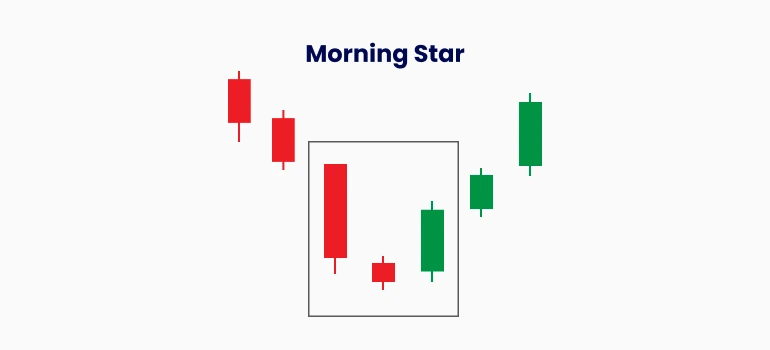
คำอธิบาย: รูปแบบสามแท่งเทียนประกอบด้วย:
แท่งเทียนขาลงยาว
แท่งเทียนตัวเล็กที่ไม่แน่ใจ (ช่องว่างลง)
แท่งเทียนขาขึ้นที่ปิดอยู่ในตัวแท่งเทียนขาลงแท่งแรก
ความหมาย: บ่งชี้ถึงการเปลี่ยนแปลงโมเมนตัมจากผู้ขายไปยังผู้ซื้อ
6. ทรีไวท์โซลเยอร์ส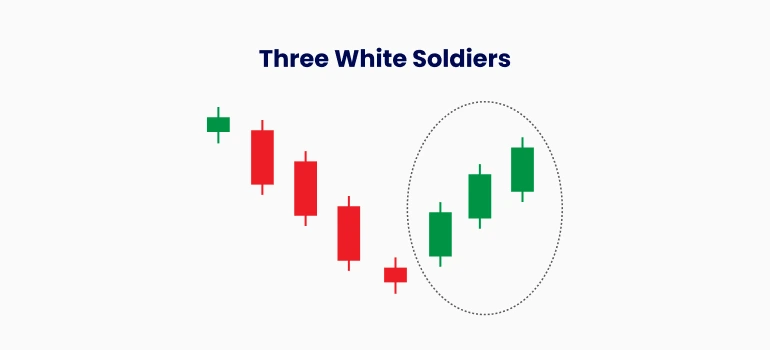
คำอธิบาย: แท่งเทียนขาขึ้นสามแท่งติดต่อกันที่ปิดสูงขึ้นเรื่อยๆ
ความหมาย: สะท้อนแรงซื้อที่แข็งแกร่งและต่อเนื่อง บ่งชี้แนวโน้มขาขึ้นที่มั่นคง
รูปแบบกลับตัวขาลง
รูปแบบเหล่านี้เกิดขึ้นหลังจากแนวโน้มขาขึ้นและบ่งชี้ถึงความเป็นไปได้ของการเคลื่อนไหวราคาลง
1. ชูตติ้งสตาร์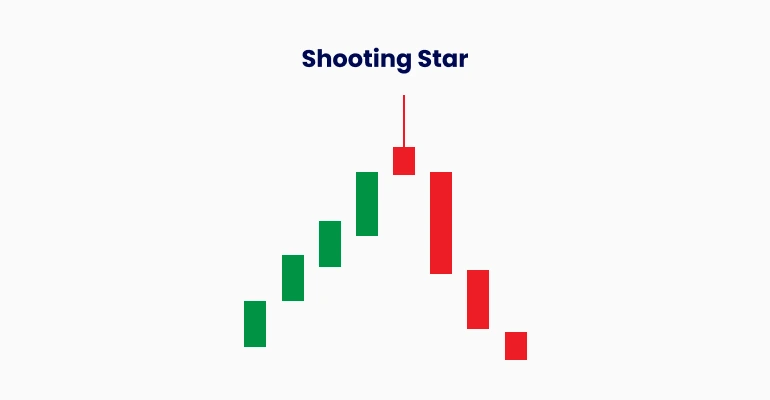
คำอธิบาย: ตัวแท่งเล็กอยู่ใกล้ด้านล่างพร้อมไส้เทียนยาวด้านบน
ความหมาย: บ่งชี้การปฏิเสธราคาที่สูงขึ้น มักเป็นสัญญาณของการกลับตัวลง
2. แฮงกิงแมน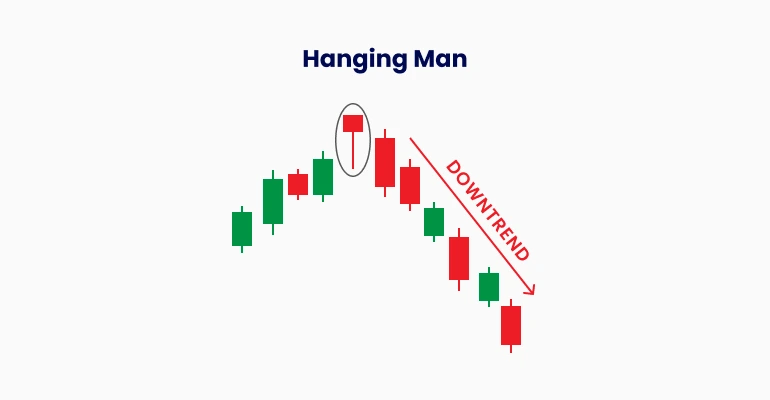
คำอธิบาย: มีลักษณะคล้ายกับแฮมเมอร์แต่ปรากฏที่จุดสูงสุดของแนวโน้มขาขึ้น
ความหมาย: เตือนถึงความเป็นไปได้ของการกลับตัวขาลงเนื่องจากแรงซื้ออ่อนแรง
3. แบร์ริชอิงกัลฟิง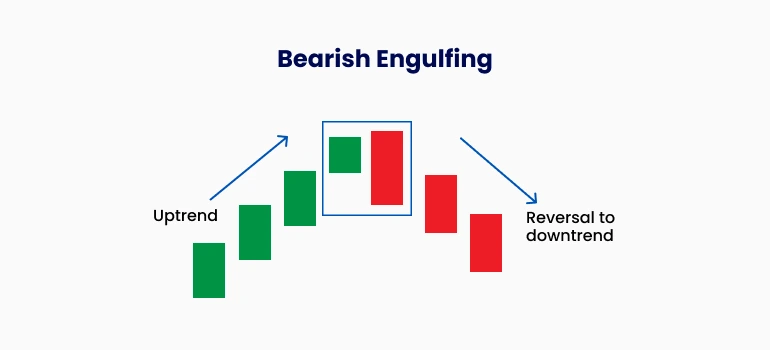
คำอธิบาย: แท่งเทียนสีแดง (ขาลง) ที่กลืนแท่งเทียนสีเขียว (ขาขึ้น) ก่อนหน้าอย่างสมบูรณ์
ความหมาย: แสดงถึงแรงขายที่แข็งแกร่งและความเป็นไปได้ของการกลับตัวแนวโน้ม
4. ดาร์กคลาวด์คัฟเวอร์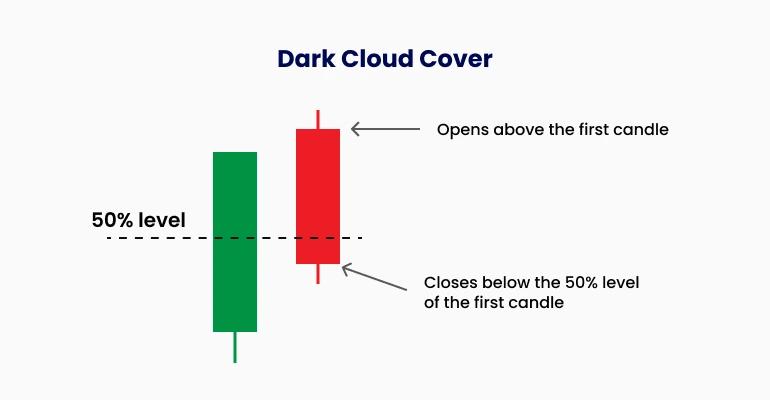
คำอธิบาย: รูปแบบสองแท่งเทียนที่แท่งที่สองเปิดสูงกว่าแต่ปิดต่ำกว่าจุดกึ่งกลางของแท่งเทียนขาขึ้นแท่งแรก
ความหมาย: สัญญาณแรงขายรุนแรง บ่งชี้ถึงการกลับตัว
5. อีฟนิงสตาร์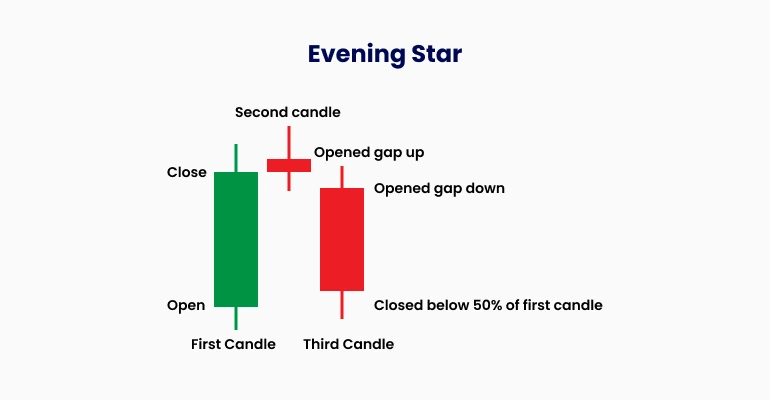
คำอธิบาย: รูปแบบสามแท่งเทียนประกอบด้วย:
แท่งเทียนขาขึ้นยาว
แท่งเทียนตัวเล็กที่ไม่แน่ใจ (ช่องว่างขึ้น)
แท่งเทียนขาลงที่ปิดอยู่ในตัวแท่งเทียนขาขึ้นแท่งแรก
ความหมาย: แสดงถึงการเปลี่ยนแปลงจากแรงซื้อเป็นแรงขาย
6. ทรีแบล็กโครว์ส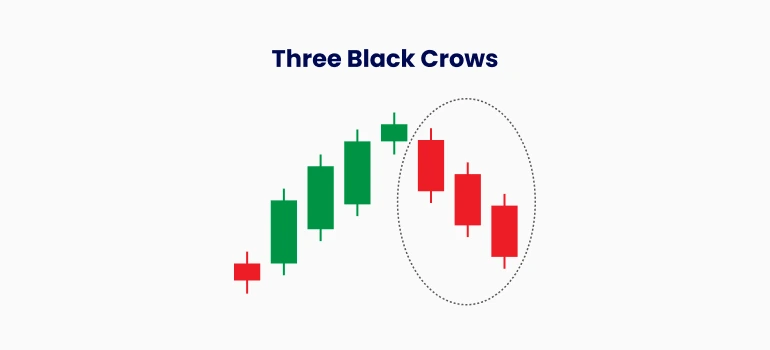
คำอธิบาย: แท่งเทียนขาลงสามแท่งติดต่อกันที่ปิดต่ำลงเรื่อยๆ
ความหมาย: สะท้อนแรงขายที่แข็งแกร่งและต่อเนื่อง บ่งชี้การเริ่มต้นของแนวโน้มขาลง
รูปแบบเป็นกลาง/ต่อเนื่อง
รูปแบบเหล่านี้บ่งชี้ถึงความไม่แน่ใจของตลาดหรือการดำเนินต่อของแนวโน้มเดิม
1. โดจิ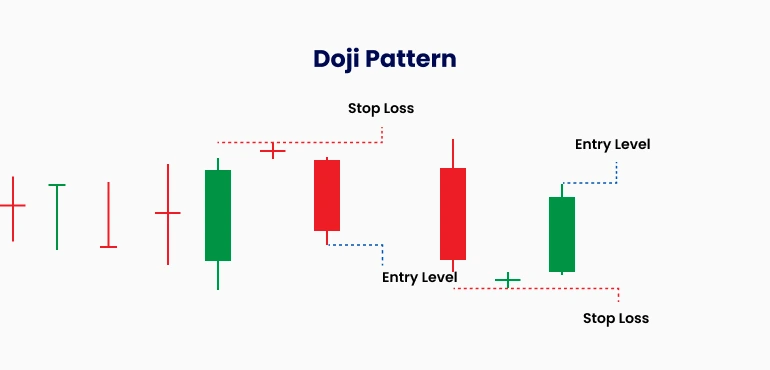
คำอธิบาย: แท่งเทียนที่มีตัวแท่งน้อยมากหรือไม่มีเลย โดยราคาปิดและราคาเปิดแทบจะเท่ากัน
ความหมาย: สะท้อนความไม่แน่ใจของตลาด ขึ้นอยู่กับบริบท อาจเป็นสัญญาณของการกลับตัวหรือการดำเนินต่อ
2. สปินนิ่งท็อป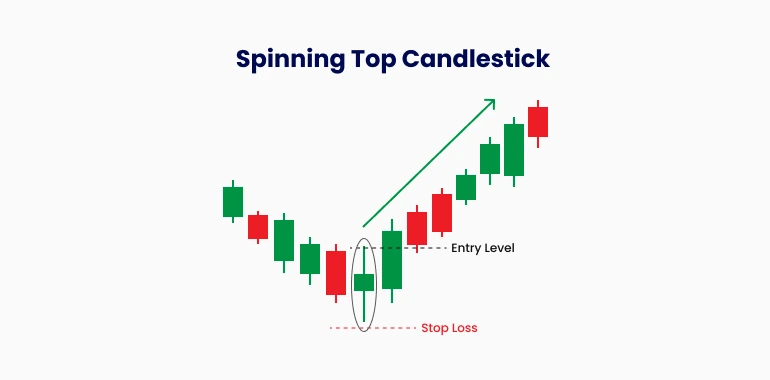
คำอธิบาย: ตัวแท่งเล็กพร้อมไส้เทียนยาวทั้งด้านบนและด้านล่าง
ความหมาย: บ่งชี้ความไม่แน่ใจของตลาด มักพบในช่วงการรวมตัวของราคา
3. มารูโบซึ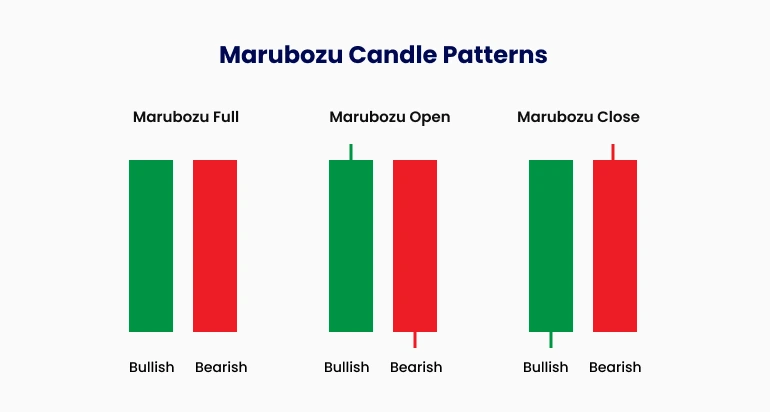
คำอธิบาย: แท่งเทียนที่ไม่มีไส้เทียน โดยราคาเปิดและราคาปิดอยู่ที่จุดสูงสุดหรือต่ำสุด
มารูโบซึขาขึ้น: แสดงถึงแรงซื้อที่แข็งแกร่ง
มารูโบซึขาลง: บ่งชี้แรงขายที่แข็งแกร่ง
4. ฮารามิ
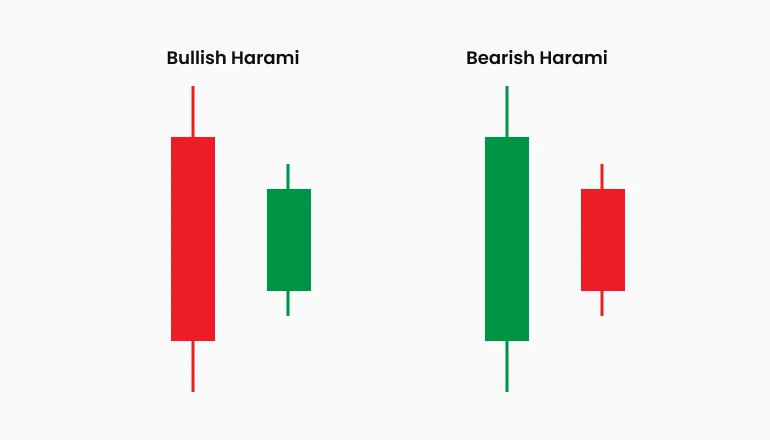
คำอธิบาย: รูปแบบสองแท่งเทียนที่แท่งที่สองมีขนาดเล็กกว่าและอยู่ภายในตัวแท่งของแท่งแรก
ฮารามิขาขึ้น: พบที่จุดต่ำสุดของแนวโน้มขาลง บ่งชี้ความเป็นไปได้ของการกลับตัว
ฮารามิขาลง: พบที่จุดสูงสุดของแนวโน้มขาขึ้น บ่งชี้ความเป็นไปได้ของการกลับตัว
เคล็ดลับการใช้งาน
รวมตัวชี้วัด: เพื่อความแม่นยำที่ดียิ่งขึ้น ให้ใช้รูปแบบแท่งเทียนร่วมกับเครื่องมืออื่นๆ เช่น ปริมาณการซื้อขาย, RSI หรือค่าเฉลี่ยเคลื่อนที่
กรอบเวลาที่สูงขึ้น: รูปแบบมักเชื่อถือได้มากขึ้นในกรอบเวลาที่สูงกว่า
รอการยืนยัน: ควรมองหาสัญญาณเพิ่มเติม (เช่น แท่งเทียนตามมา) ก่อนดำเนินการ


