


ประเด็นสำคัญ (Key Takeaways)
🎯 สรุปหัวใจสำคัญ: คัมภีร์วิเคราะห์เทคนิคฉบับรวบรัด
เพื่อให้คุณนำความรู้ทั้งหมดไปปรับใช้ได้จริง นี่คือ 4 แกนหลักที่คุณต้องท่องให้ขึ้นใจก่อนเปิดกราฟครับ
🏛️ 1. ระบบ 3 เสาหลัก
การวิเคราะห์ที่แม่นยำต้องประกอบด้วย:
1️⃣ Dow Theory: ดูโครงสร้างพื้นฐานของเทรนด์
2️⃣ Price Action: อ่านแรงซื้อขายจากแท่งเทียน
3️⃣ Indicators: ใช้เป็นแค่ "ตัวยืนยัน" (อย่าใช้เป็นตัวนำ)
⚖️ 2. พื้นฐาน vs เทคนิค
ปัจจัยพื้นฐาน: บอก "เหตุผล (Why)" ว่าทำไมราคาถึงควรขยับ
ปัจจัยเทคนิค: บอก "จังหวะ (Timing)" ว่าควรเข้าตอนไหน และที่สำคัญคือบอก "จุดยอมแพ้ (Invalidation Point)" เมื่อแผนคุณผิดพลาด
🔍 3. ขั้นตอนอ่านกราฟ (Top-Down)
วิเคราะห์จากภาพใหญ่ไปภาพเล็กเสมอ:
👁️ มองหาเทรนด์: ด้วยโครงสร้างตลาด (Market Structure)
🎯 หาโซนดักรอ: ด้วยแนวรับ-แนวต้าน / รูปแบบราคา
🔫 ลั่นไก: ใช้แท่งเทียน (Candlestick) เป็นจุดเข้าซื้อ
🛡️ 4. คุมความเสี่ยง (Risk)
การวิเคราะห์จะไร้ความหมายถ้าพอร์ตแตก!
คำนวณ Position Sizing จากระยะตัดขาดทุน (Stop Loss) เสมอ และเน้น Risk:Reward Ratio ที่คุ้มค่า เพื่อให้พอร์ตเติบโตอย่างยั่งยืน
การวิเคราะห์ทางเทคนิคคืออะไร? เสาหลัก 3 ประการของการวิเคราะห์ทางเทคนิค
การวิเคราะห์ทางเทคนิคได้รับการสนับสนุนโดยเสาหลัก 3 ประการ ได้แก่ ทฤษฎี การเคลื่อนไหวของราคา และเครื่องมือยืนยัน (ปริมาณการซื้อขายและตัวชี้วัด)
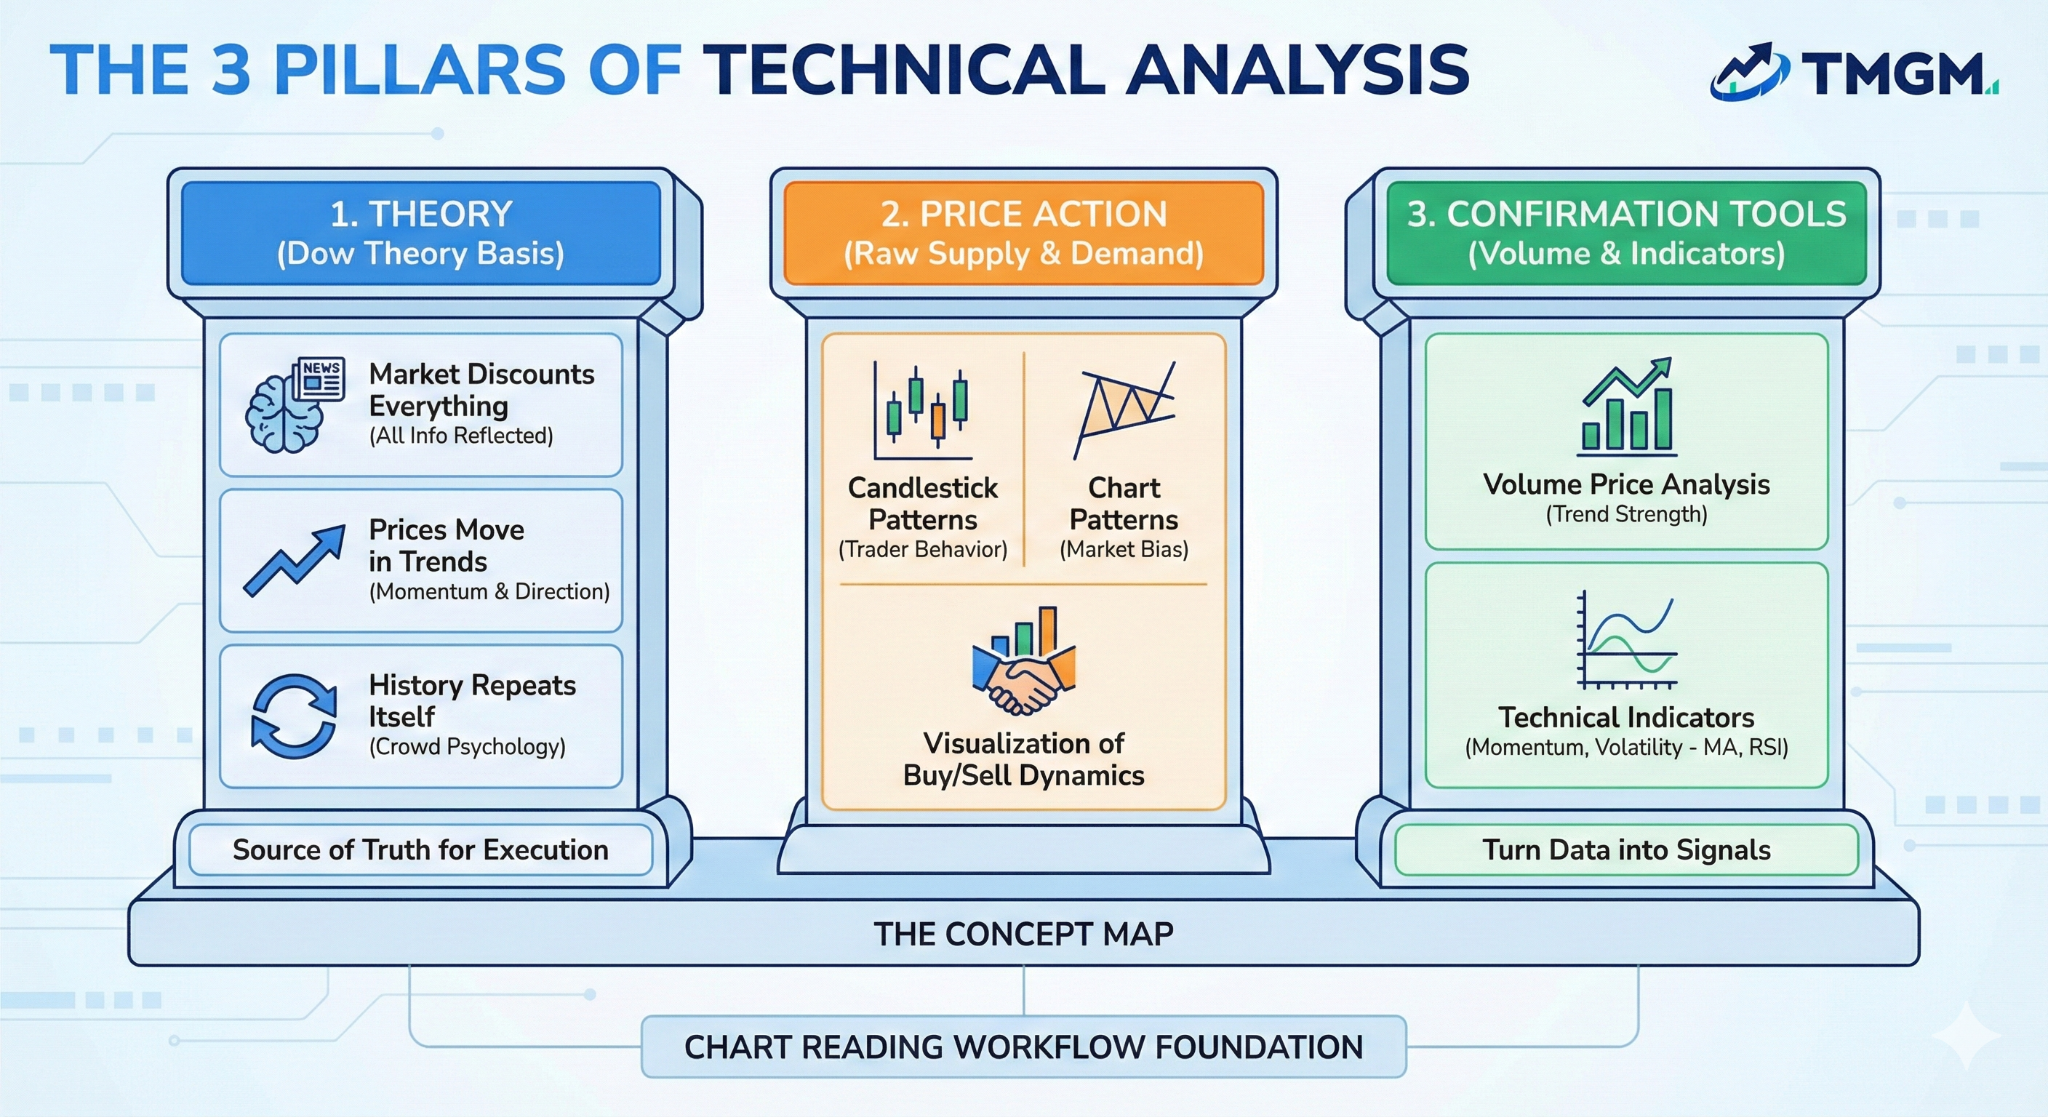
นี่คือแผนผังแนวคิด ในส่วนถัดไป คุณจะได้เรียนรู้กระบวนการทำงานของการอ่านกราฟโดยใช้เสาหลักเหล่านี้
เสาหลักที่ 1: กรอบทฤษฎีดาวน์ เป็นแกนหลักของการเทรดที่อิงกราฟส่วนใหญ่ (การวิเคราะห์ทางเทคนิค): การเคลื่อนไหวของตลาดสะท้อนข้อมูลที่มีอยู่ทั้งหมด ราคามักมีแนวโน้ม และพฤติกรรมมักเกิดซ้ำเพราะผู้เข้าร่วมตลาดทำซ้ำ นี่คือเหตุผลที่นักวิเคราะห์ทางเทคนิคให้ความสำคัญกับกราฟเป็น“แหล่งข้อมูลที่เชื่อถือได้”สำหรับการดำเนินการ
สมมติฐานของทฤษฎีดาวน์
ตลาดสะท้อนทุกสิ่ง: ราคาปัจจุบันสะท้อนข้อมูลทั้งหมดที่มีอยู่ รวมถึงรายได้ ข้อมูลเศรษฐกิจ และจิตวิทยา ซึ่งหมายความว่าการศึกษาการเคลื่อนไหวของราคาเพียงอย่างเดียวก็เพียงพอ เพราะปัจจัยอุปสงค์และอุปทานทั้งหมดได้ถูกรวมอยู่แล้ว
ราคามีการเคลื่อนไหวตามแนวโน้ม: ราคามักมีโมเมนตัมทั้งฝั่งซื้อและฝั่งขาย สร้างแนวโน้มราคา (แนวโน้มหลัก, รอง และย่อย) จนกว่าจะมีสัญญาณกลับตัวที่ชัดเจน
ประวัติศาสตร์ซ้ำรอยเดิม: จิตวิทยาฝูงชนในตลาดยังคงเหมือนเดิม ความกลัวและความโลภขับเคลื่อนรูปแบบกราฟที่คาดการณ์ได้ในปัจจุบันเช่นเดียวกับเมื่อหนึ่งศตวรรษ ที่ผ่านมา
เสาหลักที่ 2: การเคลื่อนไหวของราคา รวมถึงรูปแบบแท่งเทียนและรูปแบบกราฟ โดยพื้นฐานแล้วอธิบายพฤติกรรมของเทรดเดอร์ จิตวิทยา และกระบวนการคิดเบื้องหลังการสร้าง‘การเคลื่อนไหวของราคา’บนกราฟ ซึ่งก่อให้เกิดมุมมองเป็นขาขึ้น (bullish) หรือขาลง (bearish) (เรียกว่า bias) ในตลาดปัจจุบัน
สรุปคือ การเคลื่อนไหวของราคาแสดงภาพดิบของพลวัตอุปสงค์และอุปทาน (การซื้อและขาย) บนกราฟ
เสาหลักที่ 3: เครื่องมือยืนยัน การวิเคราะห์ราคาและปริมาณ และตัวชี้วัดทางเทคนิค เปลี่ยนข้อมูลราคาและปริมาณให้เป็นสัญญาณง่ายๆ ที่ช่วยยืนยันความแข็งแกร่งของแนวโน้ม โมเมนตัม และความผันผวน ตัวอย่างทั่วไปได้แก่ ค่าเฉลี่ยเคลื่อนที่ (แนวโน้ม), RSI (โมเมนตัม) และ Bollinger Bands (ความผันผวน)
วิธีการอ่าน (วิเคราะห์) กราฟใดๆ? จากเสาหลักสู่กระบวนการทำงาน
หลังจากเรียนรู้เกี่ยวกับเสาหลักของการวิเคราะห์ทางเทคนิคแล้ว ต่อไปเราจะแปลงแผนผังแนวคิดนี้เป็นกระบวนการทำงานจริงในการอ่านกราฟ กราฟถูกสร้างจากล่างขึ้นบน (แท่งเทียนก่อรูปแบบ ซึ่งก่อโครงสร้างตลาด) แต่การวิเคราะห์ควรทำจากบนลงล่าง (โครงสร้างก่อน รูปแบบกราฟและระดับราคา จากนั้นแท่งเทียนเพื่อจุดเข้า)
เพื่อหลีกเลี่ยงความสับสนในการวิเคราะห์ เทรดเดอร์จะมองกราฟผ่านสามชั้นที่แตกต่างกัน:
ขั้นตอนที่ 1: โครงสร้างตลาด (บริบท & Bias):
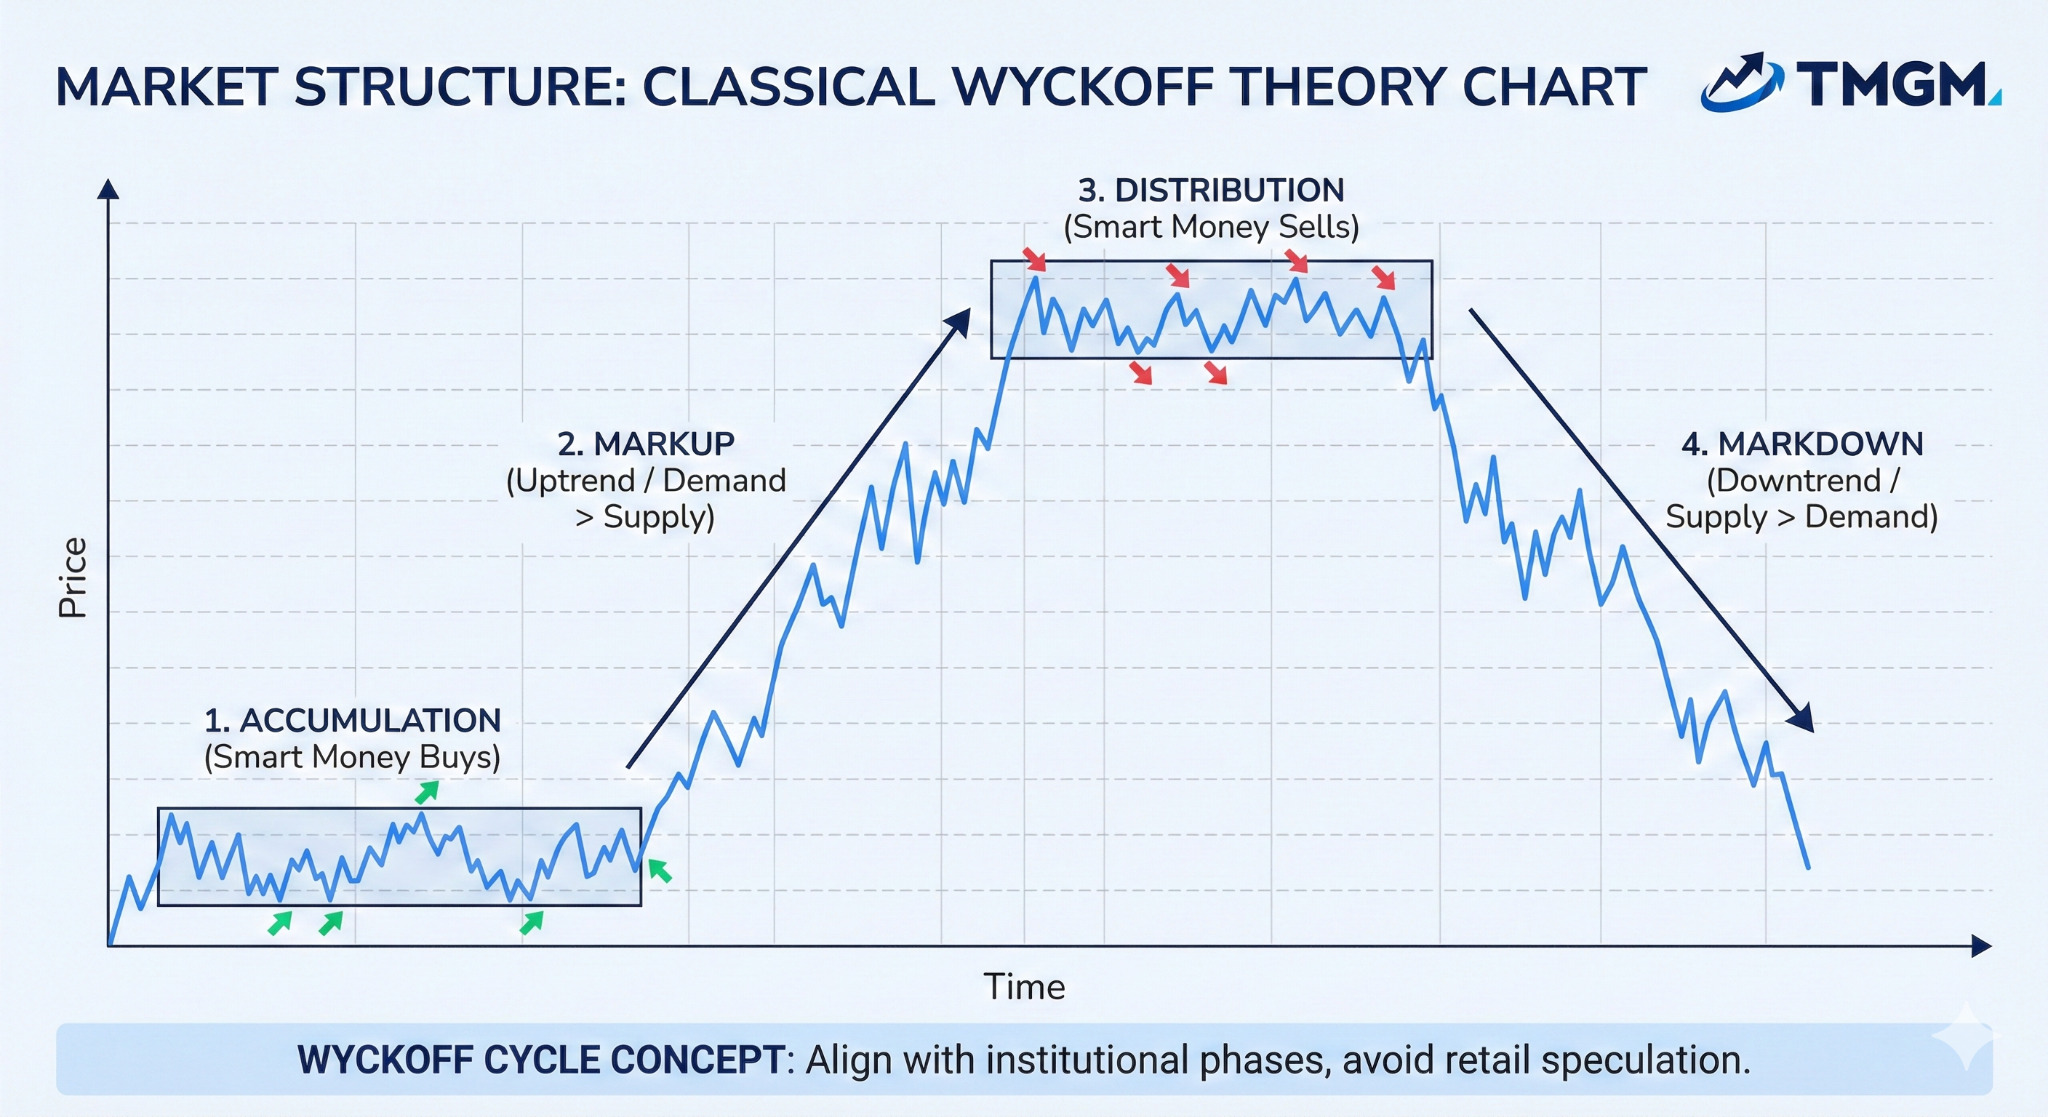
โครงสร้างตลาดบอกคุณว่าตลาดอยู่ในช่วงใด (การสะสม, การขึ้นราคา, การกระจาย, การลดราคา) ในขณะนี้ เป็น‘ภาพรวมใหญ่’ที่ชัดเจนเมื่อคุณซูมออกและระบุแนวโน้มหลักหรือช่วงราคา
วัตถุประสงค์: ช่วยให้คุณระบุได้ว่าตลาดอยู่ในช่วงสะสม ขาขึ้น กระจาย หรือขาลง
เหตุผลที่ต้องทำก่อน: คุณต้องรู้ทิศทางหลัก (Bias) ก่อนจะหาจุดเทรด ห้ามเทรดสวนโครงสร้าง
ขั้นตอนที่ 2: รูปแบบกราฟ & และระดับราคา (จุดตัดสินใจ):
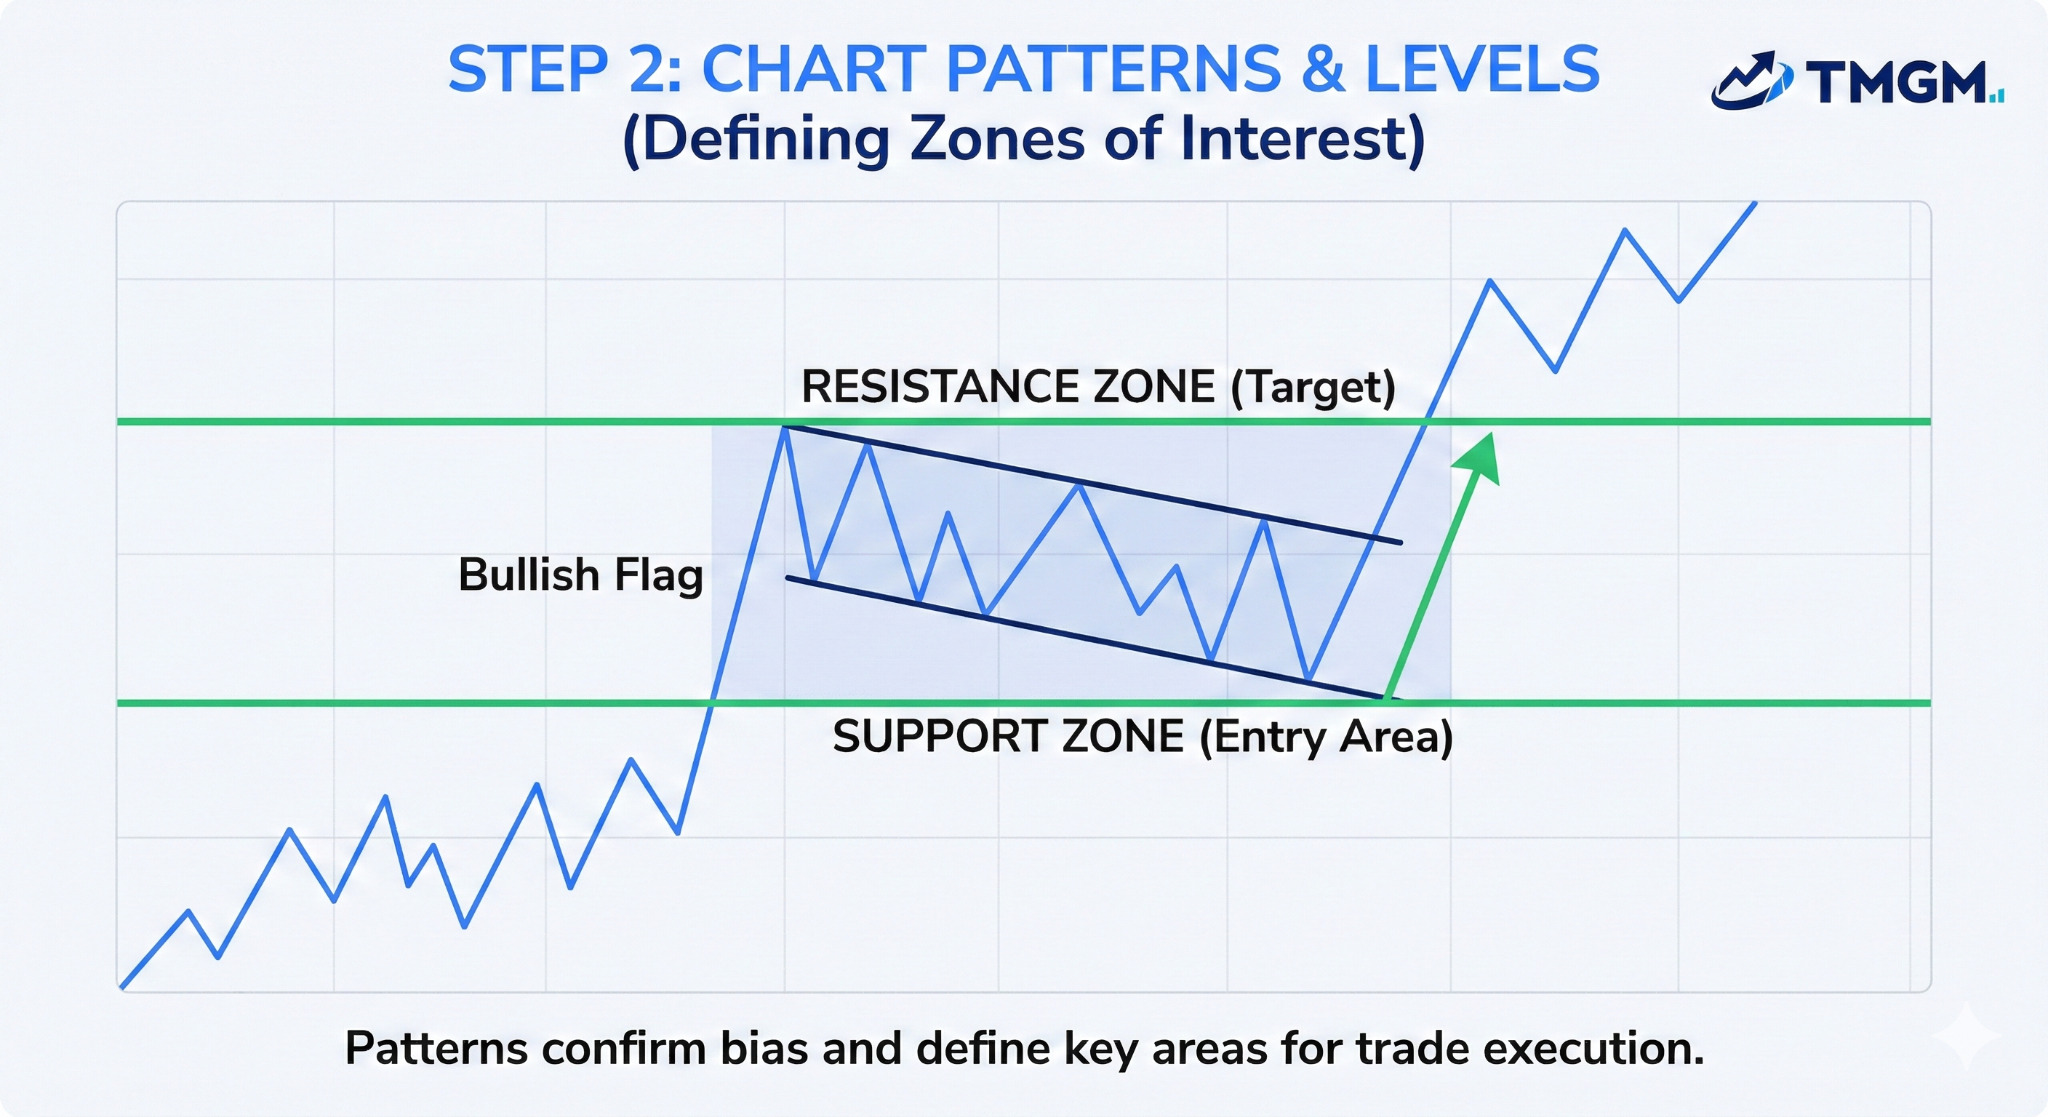
เมื่อโครงสร้างชัดเจนแล้ว คุณจะมองหารูปแบบกราฟ รูปแบบเหล่านี้แสดงผลลัพธ์ของการต่อสู้ระหว่างฝั่งซื้อและฝั่งขายตลอดเวลา สร้างโมเมนตัมที่ชัดเจนสำหรับฝั่งที่ชนะ
วัตถุประสงค์: ช่วยยืนยันช่วงหรือแนวโน้มปัจจุบัน (เช่น ขาขึ้นกับขาลง หรือ การสะสมกับการกระจาย) และระบุระดับแนวรับและแนวต้านสำคัญที่อาจเกิดการเทรด
เหตุผลที่ทำเป็นลำดับที่สอง: รูปแบบช่วยยืนยันว่า bias โครงสร้างยังคงใช้ได้ และช่วยกำหนดโซนที่น่าสนใจ (แนวรับและแนวต้าน หรือ โซนอุปทานและอุปสงค์) สำหรับจุดเข้า
ขั้นตอนที่ 3: แท่งเทียน (จุดสัญญาณเข้า):
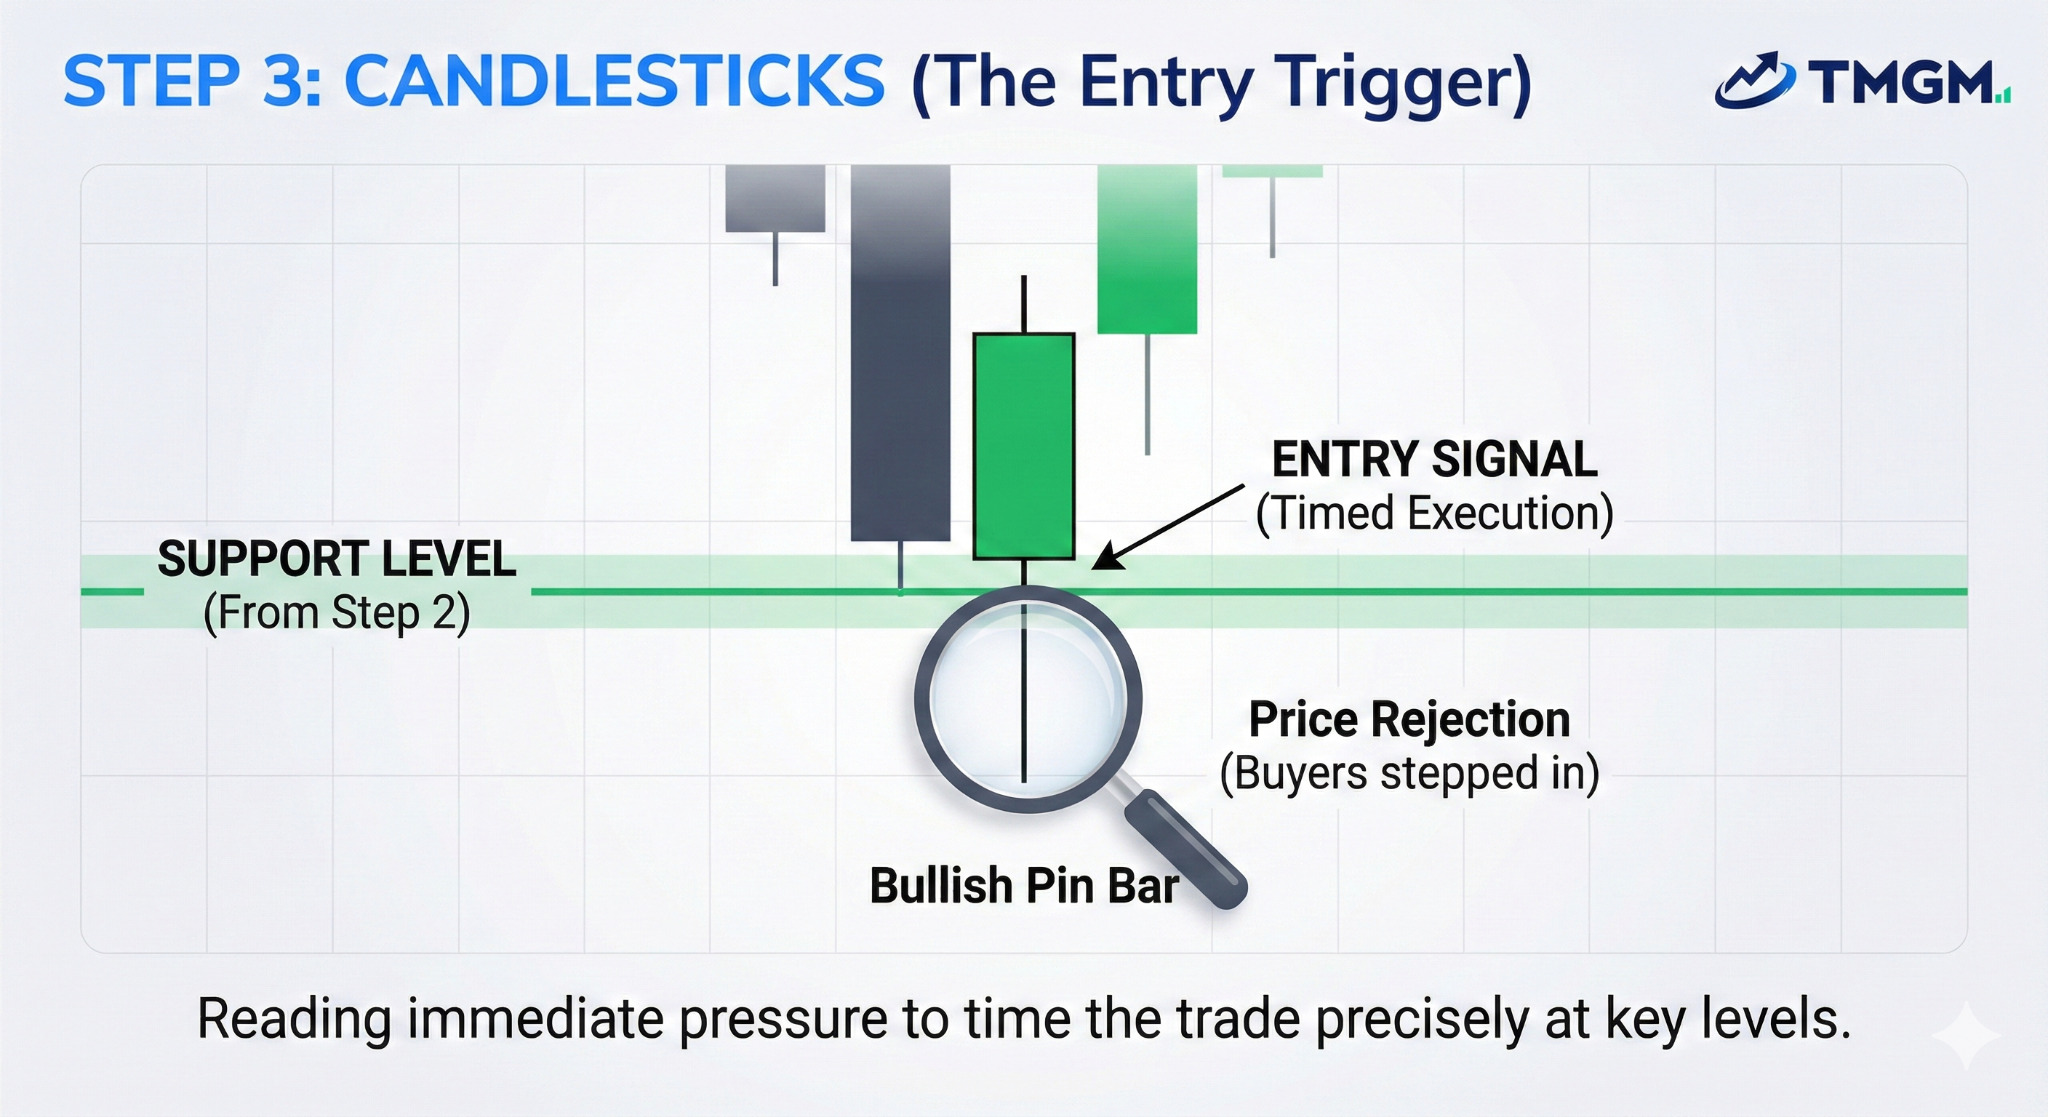
สุดท้าย คุณซูมเข้าไปดูแท่งเทียนแต่ละแท่ง แท่งเทียนแต่ละแท่ง’ทั้งตัวแท่งและไส้แท่งเป็นบันทึกสั้นๆ ของการต่อสู้ทันที (การเคลื่อนไหวที่ล้มเหลว การยอมรับ และการปฏิเสธ)
วัตถุประสงค์: ช่วยให้คุณอ่านแรงกดดันทันทีเพื่อกำหนดเวลาและตัดสินใจเข้าออกอย่างแม่นยำ
เหตุผลที่ทำเป็นลำดับสุดท้าย: เพราะแท่งเทียนขาขึ้นมีประโยชน์ก็ต่อเมื่อปรากฏที่ระดับสำคัญ (ขั้นตอนที่ 2) ภายในโครงสร้างขาขึ้น (ขั้นตอนที่ 1)
ตัวเลือกเสริม: การยืนยัน (ปริมาณ & ตัวชี้วัด):
ใช้เครื่องมือเช่น RSI หรือปริมาณเพื่อยืนยันความแข็งแกร่งของการเคลื่อนไหว ปริมาณสูงในช่วงเบรกเอาต์ยืนยันว่าเงินสถาบันสนับสนุนไอเดียการเทรดของคุณ
สำคัญ: ตัวชี้วัดทางเทคนิคไม่ใช่ส่วนสำคัญของการวิเคราะห์ทางเทคนิค พวกมันถูกใช้มาก แต่ไม่ใช่ส่วนประกอบพื้นฐานของกราฟราคา หรือโครงสร้างตลาด แต่มีประโยชน์สำหรับเทรดเดอร์หลายคน อย่างไรก็ตาม ปริมาณการซื้อขายแนะนำอย่างยิ่ง
เครื่องมือสำหรับแต่ละขั้นตอนของการวิเคราะห์ทางเทคนิค
ตอนนี้ที่คุณมีขั้นตอนการทำงานแล้ว นี่คือหมวดหมู่เครื่องมือหลักและโมดูลกลยุทธ์ที่เทรดเดอร์ใช้ การวิเคราะห์ที่มีประสิทธิภาพสร้างขึ้นบนลำดับขั้นของเครื่องมือ ตั้งแต่ข้อมูลราคาละเอียดไปจนถึงแนวคิดโครงสร้างกว้าง
ขั้นตอนที่ 1 โครงสร้างตลาด (เครื่องมือ): Wyckoff
วิธีการ Wyckoff จำแนกวงจรตลาดออกเป็นสี่ช่วง: การสะสม การขึ้นราคา การกระจาย และการลดราคา แนวคิด"Smart Money"นี้ช่วยให้เทรดเดอร์สอดคล้องกับการสะสมของสถาบันแทนการเก็งกำไรของรายย่อย
ขั้นตอนที่ 2 รูปแบบกราฟ & เครื่องมือแนวรับ/แนวต้าน
รูปแบบกราฟ: รูปแบบเช่นสามเหลี่ยมหรือต่ำสองครั้งเน้นจุดที่ราคาบีบตัวหรือไม่ผ่าน และจุดที่มีโอกาสเบรกเอาต์หรือกลับตัวสูง
แนวรับและแนวต้าน (S/R): ไม่ใช่เส้นที่ชัดเจน แต่เป็น โซนสภาพคล่อง ราคากลับมาที่ระดับเหล่านี้เพราะคำสั่งของสถาบัน (Limit Orders) ถูกวางซ้อนกันรอการเติมเต็ม
ตัวอย่างรูปแบบกราฟ:
ถ้วยและหู
ธง
ธงสามเหลี่ยม
สามเหลี่ยม
หัวและไหล่
สูงสองครั้ง/ต่ำสองครั้ง
สูงสามครั้ง/ต่ำสามครั้ง
ขั้นตอนที่ 3 แท่งเทียน & เครื่องมือรูปแบบ
แท่งเทียนคือดีเอ็นเอของราคา เผยให้เห็นการต่อสู้ระหว่างกระทิงและหมีในช่วงเวลาที่กำหนด
ข้อมูล OHLC: ข้อมูลเปิด สูง ต่ำ ปิด แสดงความผันผวน
จิตวิทยา: ไส้แท่งเทียนยาวบ่งชี้การปฏิเสธราคาและการจับสภาพคล่อง มักเป็นตัวกระตุ้นการกลับตัว
ตัวอย่างแท่งเทียน: แท่งเทียน Heikin Ashi
ตัวอย่างรูปแบบแท่งเทียน:
รูปแบบแท่งเทียน Shooting Stars
รูปแบบแท่งเทียน Hammer
รูปแบบแท่งเทียน Pin Bar
รูปแบบแท่งเทียน Bullish และ Bearish Engulfing
รูปแบบแท่งเทียน Doji
รูปแบบแท่งเทียน Morning Star และ Evening Star
แท่งเทียน Marubozu
เครื่องมือยืนยัน: ตัวชี้วัดทางเทคนิคและการวิเคราะห์ราคาและปริมาณ
ตัวชี้วัดทางเทคนิค
แม้ผู้เชี่ยวชาญมักใช้กราฟ"เปลือย" ตัวชี้วัดเช่น
ค่าเฉลี่ยเคลื่อนที่ (SMA, EMA)
ใช้เป็น ระดับแนวรับและแนวต้านแบบไดนามิกระดับl
ใช้เป็น ระดับแนวรับและแนวต้านแบบไดนามิกระดับ
VWAP (Volume Weighted Average Price)
ATR (Average True Range)
Pivot Points
การวิเคราะห์ราคาและปริมาณ
ปริมาณยืนยันความถูกต้อง ปริมาณเป็นตัววัดโดยตรงของการเข้าร่วมตลาด และงานวิจัยทางการเงินแสดงว่า ปริมาณการซื้อขายมีความสัมพันธ์เชิงบวกกับขนาดของการเปลี่ยนแปลงราคา.
อ้างอิง: [”สถิติการตลาดและการวิเคราะห์ทางเทคนิค: บทบาทของปริมาณ – สมาคมการเงินอเมริกัน, ผู้จัดพิมพ์วารสารการเงิน”, “Karpoff JM.]
ตามทฤษฎีตลาดมาตรฐาน การเคลื่อนไหวของราคาที่มาพร้อมกับปริมาณสูงถือว่าเชื่อถือได้; การเคลื่อนไหวที่ปริมาณต่ำถือว่าน่าสงสัย เครื่องมือเช่น Volume Profile ช่วยระบุ"โหนดปริมาณสูง"ที่มีการซื้อขายมากที่สุด ทำหน้าที่เป็นโซนแม่เหล็กสำหรับราคา
ปริมาณเป็นตัววัดโดยตรงของการเข้าร่วมตลาด และงานวิจัยทางการเงินแสดงว่า ปริมาณการซื้อขายมีความสัมพันธ์เชิงบวกกับขนาดของการเปลี่ยนแปลงราคา ในทางปฏิบัติ นักวิเคราะห์ทางเทคนิคจะถือว่าเบรกเอาต์หรือการเคลื่อนไหวตามแนวโน้มมีความน่าเชื่อถือมากขึ้นเมื่อได้รับการสนับสนุนด้วยปริมาณที่แข็งแกร่งกว่า เพราะ ข้อมูลร่วมกันในราคาและปริมาณสามารถให้ข้อมูลเชิงลึก Volume Profile แสดงปริมาณตามราคา ดังนั้น โหนดปริมาณสูง จะเน้นพื้นที่ราคาที่มีการซื้อขายเข้มข้นและที่ราคามีแนวโน้มตอบสนองในภายหลังเนื่องจากมีการสร้างตำแหน่งจำนวนมากที่นั่น
สำคัญ: ตัวชี้วัดเป็นอนุพันธ์ที่ล่าช้าของราคา ควรใช้เพื่อยืนยันความแตกต่าง ไม่ใช่สัญญาณเข้าเทรดหลัก
การวิเคราะห์ทางเทคนิคกับการวิเคราะห์ปัจจัยพื้นฐาน
ในขณะที่การวิเคราะห์ปัจจัยพื้นฐานประเมินมูลค่าที่แท้จริง (รายได้ สุขภาพเศรษฐกิจ การบริหารจัดการ) การวิเคราะห์ทางเทคนิคเน้นที่จังหวะเวลาและกลไกราคาเท่านั้น
เคล็ดลับมือโปร: เทรดเดอร์มืออาชีพมักใช้ ปัจจัยพื้นฐาน เพื่อกำหนดว่าจะซื้ออะไร และ การวิเคราะห์ทางเทคนิค เพื่อกำหนดเวลาซื้อ
การบริหารความเสี่ยง
การบริหารความเสี่ยงคือสิ่งที่ทำให้บัญชีเทรดอยู่รอดผ่านช่วงขาดทุนที่หลีกเลี่ยงไม่ได้ หน่วยงานกำกับดูแลเตือนเสมอว่าการใช้เลเวอเรจและมาร์จิ้นสามารถ เพิ่มความเสียหาย และในบางตลาดนักลงทุนอาจ สูญเสียเงินต้นทั้งหมดและอาจต้องเติมเงินเพิ่ม เนื่องจากผลลัพธ์ไม่แน่นอน การควบคุมขนาดตำแหน่ง การกำหนดจุดตัดขาดทุน และจำกัดความเสียหายต่อการเทรดเป็นพื้นฐานปฏิบัติสำหรับการอยู่รอดในระยะยาว– “กลยุทธ์การลงทุนแบบใช้เลเวอเรจ – ทราบความเสี่ยงก่อนใช้ เครื่องมือการลงทุนขั้นสูงเหล่านี้ โดยสำนักงานคณะกรรมการกำกับหลักทรัพย์และตลาดหลักทรัพย์สหรัฐฯ”]
การกำหนดขนาดตำแหน่ง
ขนาดตำแหน่งควรเป็นแบบไดนามิก ขึ้นอยู่กับ ระยะห่างถึงจุดตัดขาดทุน ไม่ใช่จำนวนเงินคงที่
สูตร: จำนวนความเสี่ยง / (ราคาที่เข้า - ราคาตัดขาดทุน) = จำนวนหน่วย
การประยุกต์ใช้: ไม่ว่าจะเทรดรายวันหรือสวิงเทรด การเสี่ยง 1-2% ของทุนรวมต่อการเทรดช่วยป้องกัน "ความเสี่ยงที่จะล้มละลาย"
อัตราส่วนความเสี่ยงต่อผลตอบแทน (R:R)
อัตราส่วน ความเสี่ยงต่อผลตอบแทน (RRR) กำหนดกลยุทธ์การออก การมี R:R ขั้นต่ำ 1:2 หมายความว่าเสี่ยง $1 เพื่อหวังผลกำไร $2 ซึ่งช่วยให้เทรดเดอร์ผิดพลาดได้ถึง 50% แล้วยังมีกำไร จุดตัดขาดทุนต้องวางที่ จุดที่แผนการเทรดล้มเหลว (ไม่ใช่ระดับราคาแบบสุ่ม)
จิตวิทยาการเทรด
จิตวิทยากำหนดการดำเนินการ แม้กลยุทธ์สมบูรณ์แบบก็ล้มเหลวหากเทรดเดอร์ตกเป็นเหยื่อของอคติทางความคิด
ความกลัว & ความโลภ: ขับเคลื่อนการออกที่ไม่สมเหตุสมผลและการเข้าช้า
FOMO (Fear Of Missing Out): เข้าทำการเทรดหลังจากราคาขยับไปแล้ว มักเข้าใกล้แนวต้าน
การเทรดแก้แค้น: เข้าซื้อขายทันทีหลังขาดทุนเพื่อ"เอาคืน" โดยไม่สนแผน
ทฤษฎีความคาดหวัง: แนวโน้มที่จะถือขาดทุนไว้นานเกินไป (หวังฟื้นตัว) และขายทำกำไรเร็วเกินไป (กลัวขาดทุนกำไร)
เคล็ดลับมือโปร: "โซน"ในการเทรดเกิดขึ้นเมื่อคุณยอมรับความเสี่ยงอย่างเต็มที่ หากคุณรู้สึกวิตกกังวลขณะเทรด แสดงว่าขนาดตำแหน่งของคุณใหญ่เกินไป
วิธีเรียนรู้การวิเคราะห์ทางเทคนิค
ความชำนาญต้องผสมผสานการศึกษาทางวิชาการและเวลาฝึกฝนหน้าจอ
ศึกษาพื้นฐาน: เชี่ยวชาญโครงสร้างแท่งเทียนและทฤษฎีดาวน์ อ่านหนังสือสำคัญเช่น Technical Analysis of the Financial Markets โดย John Murphy
ใช้ทรัพยากร: ใช้แพลตฟอร์มกราฟเช่น TradingView และแหล่งความรู้ที่น่าเชื่อถือ (Investopedia, CME Group education)
ฝึกฝนทักษะ: ใช้บัญชีจำลองหรือ"Paper Trading"เพื่อทดสอบกลยุทธ์โดยไม่เสี่ยงเงินจริง บันทึกการเทรดเพื่อติดตามข้อผิดพลาดทางจิตวิทยา
พัฒนากลยุทธ์: สร้างแผนการเทรดเป็นลายลักษณ์อักษร ระบุการตั้งค่าเฉพาะ พารามิเตอร์ความเสี่ยง และตารางทบทวน
ข้อจำกัดของการวิเคราะห์ทางเทคนิค
การวิเคราะห์ทางเทคนิคเป็นเกมความน่าจะเป็น ไม่ใช่ลูกแก้วทำนายอนาคต
ความเป็นอัตวิสัย: เทรดเดอร์สองคนสามารถตีความกราฟเดียวกันแตกต่างกันได้ (เช่น การนับคลื่นหรือการวางแนวเส้นแนวโน้ม)
ความล่าช้า: เครื่องมือส่วนใหญ่วิเคราะห์ข้อมูลในอดีต เหตุการณ์ช็อกทางภูมิรัฐศาสตร์อย่างฉับพลัน (เหตุการณ์ Black Swan) ไม่สามารถเห็นได้บนกราฟจนกว่าจะเกิดขึ้น
ตลาดที่มีประสิทธิภาพ: ในตลาดที่มีประสิทธิภาพสูง (ตามทฤษฎี) ข้อมูลราคาย้อนหลังไม่มีข้อได้เปรียบ แม้ว่าการเทรดความถี่สูง (HFT) จะท้าทายมุมมองนี้
"สัญญาณเท็จ": เบรกเอาต์มักล้มเหลว (fakeouts) เทรดเดอร์มืออาชีพคาดการณ์‘การจับสภาพคล่อง’ (เบรกเอาต์ปลอมที่ทำให้สต็อปทำงาน) ขณะที่มือใหม่มักถูกหลอกลวง


