
Bitcoin Price Forecast: BTC slips below $65,000 as tariff, geopolitical jitters fuel risk-off sentiment
โดย Manish Chhetri
วันที่เผยแพร่: 23 Feb 2026 | วันที่แก้ไข: 23 Feb 2026


บทความยอดนิยม

Bitcoin (BTC) is trading in red, testing the lower boundary of its recent consolidation range at $65,729 as of writing on Monday. The growing tariff uncertainty, along with rising geopolitical tensions, weighs on riskier assets such as BTC.
- Bitcoin’s price tests the lower boundary of its consolidation range on Monday as risk-off sentiment returns.
- Uncertainty over tariffs and rising geopolitical tensions weigh on risky assets such as BTC.
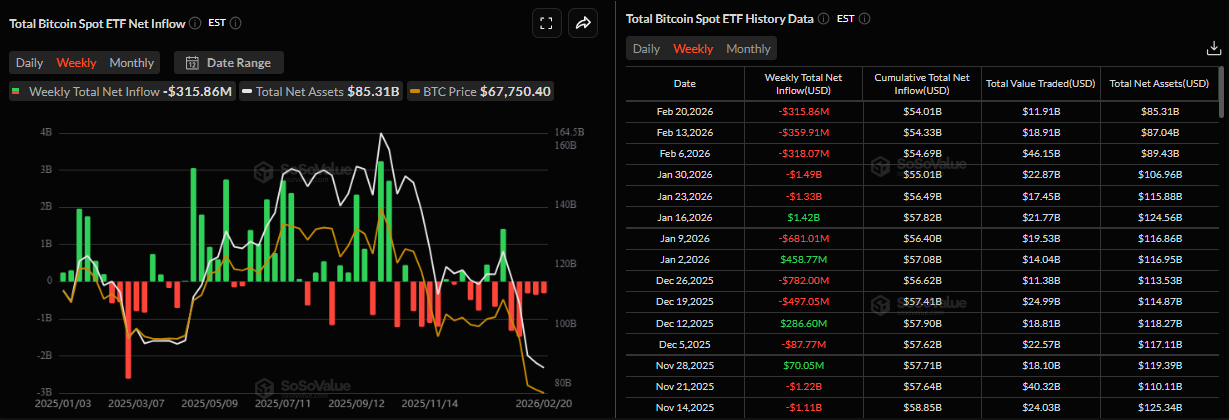
- US-listed spot ETFs recorded a $315.86 million weekly outflow, marking the fifth consecutive week of withdrawals.
Bitcoin (BTC) is trading in red, testing the lower boundary of its recent consolidation range at $65,729 as of writing on Monday. The growing tariff uncertainty, along with rising geopolitical tensions, weighs on riskier assets such as BTC. In this context, institutional demand continues to weaken, with spot Exchange-Traded Funds (ETFs) recording a fifth consecutive week of outflows.
Concerns over tariffs, escalating geopolitical tensions dampen risk appetite
Bitcoin started the week on a negative note, as investors assessed the latest headlines surrounding the US President Donald Trump announced fresh tariffs after the Supreme Court struck down most of the old levies.
The largest cryptocurrency by market capitalization slipped below $65,000, hitting a low of $64,290 during the Asian trading session, before recovering slightly in the early European trading session on Monday. The Crypto King closed the previous week down 1.73%, marking the fifth consecutive week of correction since mid-January.
Last Friday, the US Supreme Court ruled against the Trump administration’s tariffs, finding that the president exceeded his constitutional authority by using the International Emergency Economic Powers Act (IEEPA) to impose unilateral tariffs on trading partners.
In response, President Trump vowed that his administration will impose even further tariffs using alternative legal frameworks, specifically citing national security conventions under Section 301 of the Trade Act of 1974.
Over the weekend, Trump said that he will raise global tariffs to 15% “effective immediately” and warned that additional levies would follow.
In addition to the concern over tariffs, the growing geopolitical tension continues to dampen risk appetite. Iran and the US have agreed to hold a third round of nuclear talks in Geneva on Thursday. According to the New York Times, Trump could launch a targeted strike in the coming days to force Iran to make a deal, and even consider a larger military assault later this year if they fail to convince Iran to meet his demands.
These combined developments have prompted investors to move towards safe-haven asset Gold (XAU), which has started the day with 1% gains, while Bitcoin has fallen below $65,000 so far on Monday.
Five weeks of ETF outflows
Institutional demand for Bitcoin continued to weaken last week. SoSoValue data shows that spot Bitcoin ETFs recorded total outflows of $315.86 million last week, marking the fifth straight week of outflows. A similar trend was seen from mid-February to mid-March, where BTC crashed from $100,000 to roughly $80,000. If this trend continues, BTC could see further correction.
Fading dry power to buy crypto
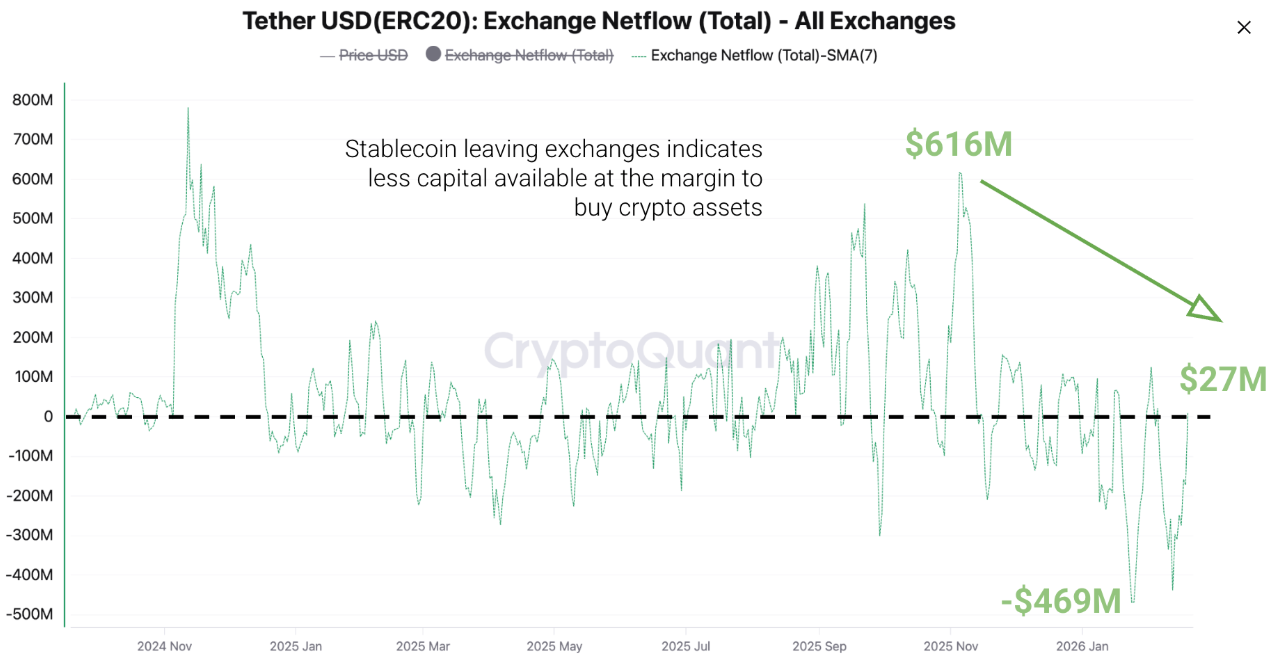
CryptoQuant reported on Friday that a growing amount of USDT, the largest stablecoin, is leaving exchanges, lowering the “dry powder” to buy crypto assets.
The chart below shows that since November 5, netflows of USDT into exchanges have declined from a one-year high of $616 million to only $27 million on Friday, even turning negative at times (-$469 million in late January). This contraction indicates reduced liquidity ready to be deployed into crypto markets. Historically, crypto price rallies are often accompanied by rising stablecoin deposits on exchanges.
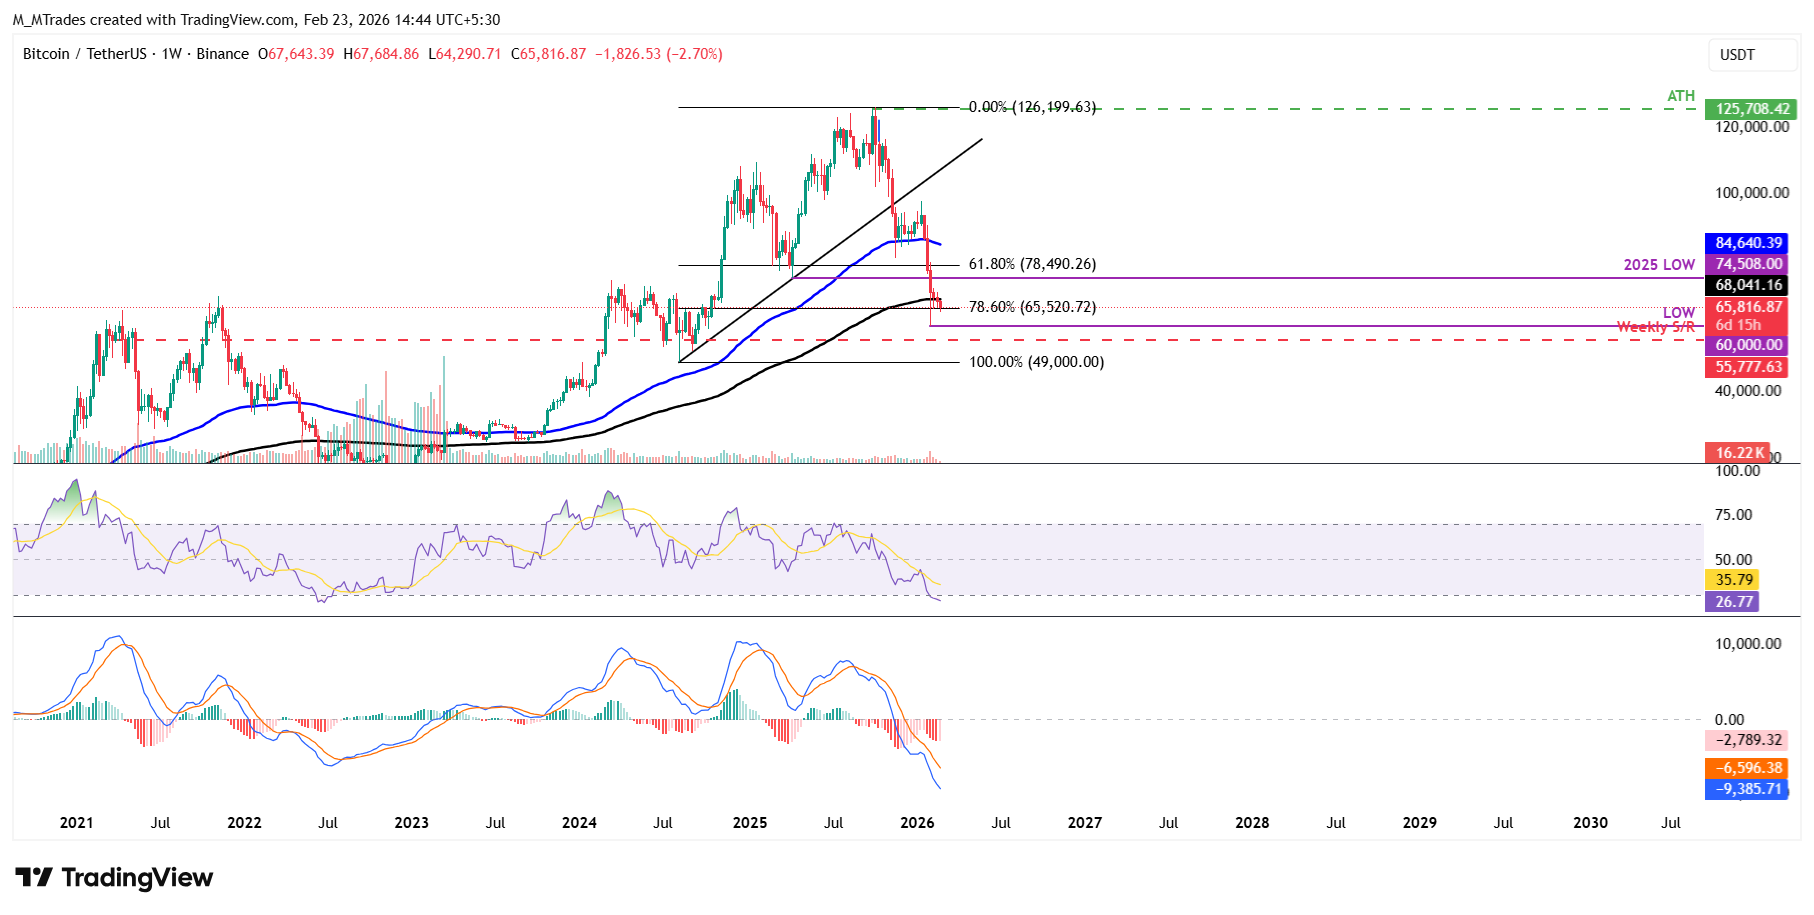
Bitcoin Price Forecast: BTC closes below 200-week EMA
On the weekly chart, Bitcoin closed below the 200-week Exponential Moving Average (EMA) at $68,041 last week. As of Monday, BTC is trading further down, finding support at the 78.6% Fibonacci retracement level (drawn from the August 2024 low of $49,000 to the October 2025 all-time high of $126,199) at $65,520.
If BTC closes below $65,520 on a weekly basis, it could extend the decline toward the next weekly support at $55,777.
The Relative Strength Index (RSI) reads 26 on the weekly chart, within oversold area, indicating strong bearish momentum. Additionally, the Moving Average Convergence Divergence (MACD) indicator on the same chart also showed a bearish crossover in mid-August, which remains intact, further supporting the negative outlook.
On the daily chart, the Crypto King is testing the lower consolidating boundary at $65,729 on Monday. If BTC closes below this level on a daily basis, it could extend the decline toward the key support level at $60,000.
The Relative Strength Index (RSI) on the daily chart reads 33, nearing the oversold conditions, indicating strong bearish momentum. The Moving Average Convergence Divergence (MACD) lines are converging, indicating indecisiveness among traders.
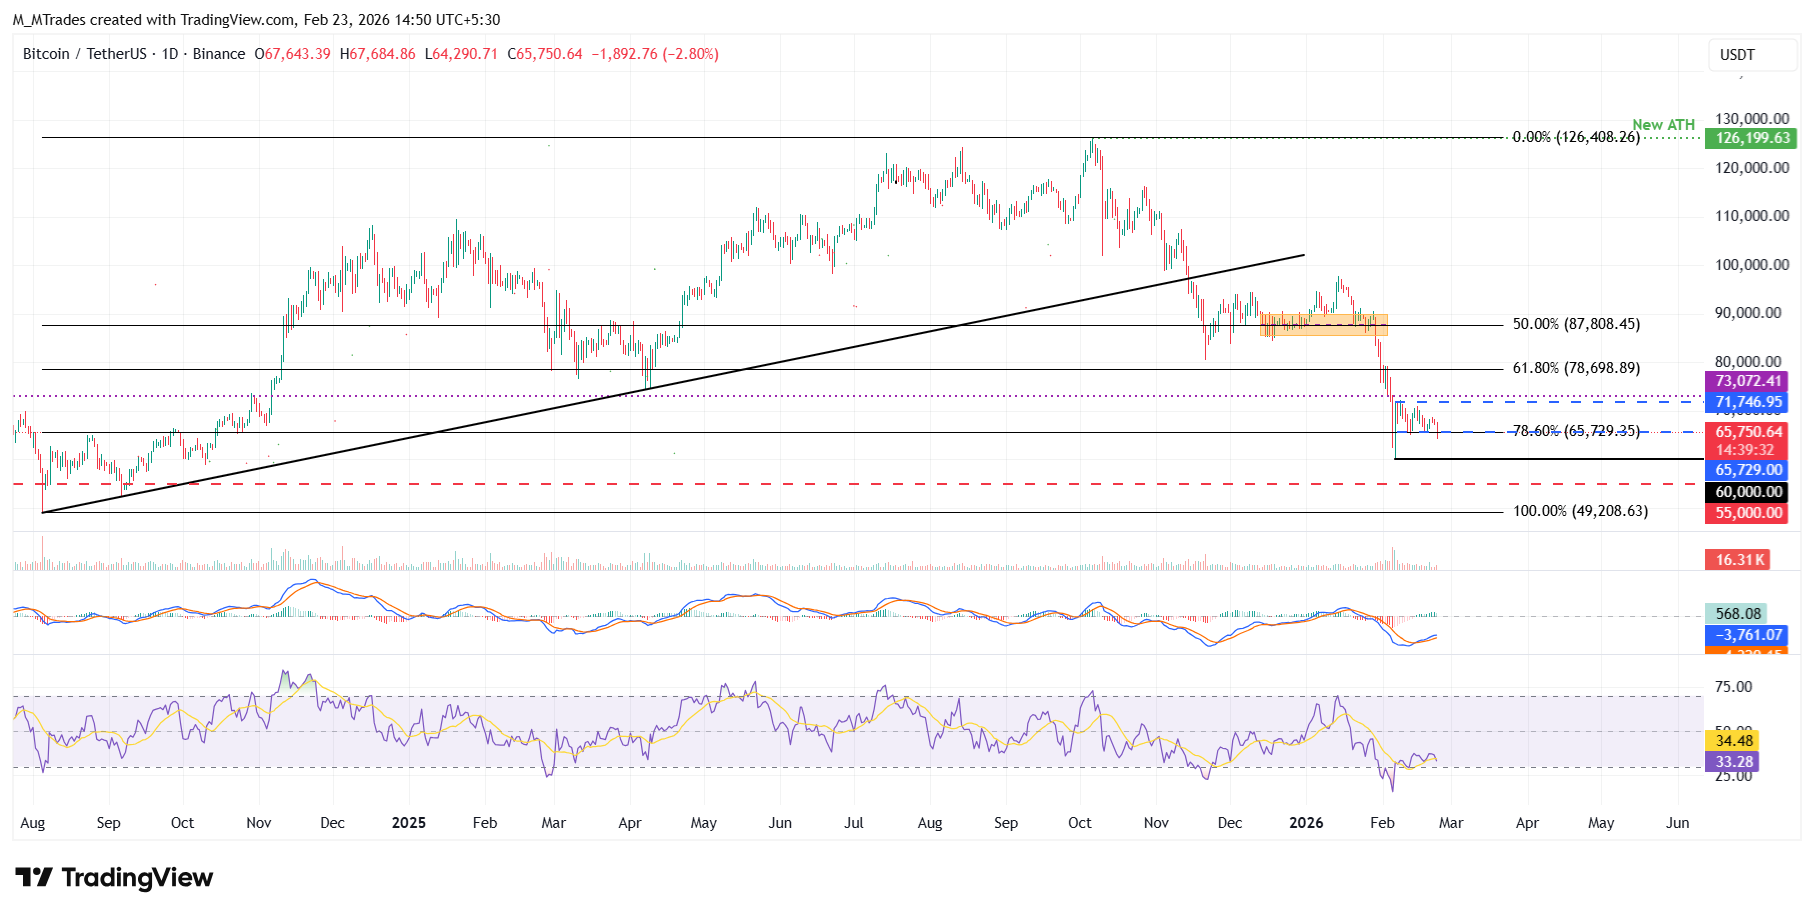
If BTC finds support around the lower consolidation range at $65,729, it could extend the advance toward the upper consolidation range at $71,746.
Bitcoin, altcoins, stablecoins FAQs
Bitcoin is the largest cryptocurrency by market capitalization, a virtual currency designed to serve as money. This form of payment cannot be controlled by any one person, group, or entity, which eliminates the need for third-party participation during financial transactions.
Altcoins are any cryptocurrency apart from Bitcoin, but some also regard Ethereum as a non-altcoin because it is from these two cryptocurrencies that forking happens. If this is true, then Litecoin is the first altcoin, forked from the Bitcoin protocol and, therefore, an “improved” version of it.
Stablecoins are cryptocurrencies designed to have a stable price, with their value backed by a reserve of the asset it represents. To achieve this, the value of any one stablecoin is pegged to a commodity or financial instrument, such as the US Dollar (USD), with its supply regulated by an algorithm or demand. The main goal of stablecoins is to provide an on/off-ramp for investors willing to trade and invest in cryptocurrencies. Stablecoins also allow investors to store value since cryptocurrencies, in general, are subject to volatility.
Bitcoin dominance is the ratio of Bitcoin's market capitalization to the total market capitalization of all cryptocurrencies combined. It provides a clear picture of Bitcoin’s interest among investors. A high BTC dominance typically happens before and during a bull run, in which investors resort to investing in relatively stable and high market capitalization cryptocurrency like Bitcoin. A drop in BTC dominance usually means that investors are moving their capital and/or profits to altcoins in a quest for higher returns, which usually triggers an explosion of altcoin rallies.

Acuity Trading เป็นฟินเทคในลอนดอนก่อตั้งปี 2013 เชี่ยวชาญข้อมูลทางเลือกและการวิเคราะห์ Sentiment ด้วย AI สำหรับการเทรดและการลงทุน พวกเขาปฏิวัติประสบการณ์การเทรดออนไลน์ด้วยเครื่องมือข่าวและ Sentiment แบบภาพ และยังคงเป็นผู้นำตลาดด้วยข้อมูลทางเลือกที่สร้างอัลฟาและเครื่องมือเทรดที่มีการมีส่วนร่วมสูงโดยใช้การวิจัยและเทคโนโลยี AI ล่าสุด
อ่านเพิ่มเติม


