
Bitcoin Price Forecast: BTC on brink of breakdown amid US-Iran war
โดย Manish Chhetri
วันที่เผยแพร่: 2 Mar 2026 | วันที่แก้ไข: 2 Mar 2026


บทความยอดนิยม

Bitcoin (BTC) remains under pressure near the key support level of $65,700. Trading at $66,400 at the time of writing on Monday, a breakdown below this critical level would suggest a deeper correction ahead.
- Bitcoin under pressure near the lower consolidation range at $65,700 on Monday.
- Middle East tensions have weighed on risk sentiment, prompting investors toward safe-haven assets like Gold.
- Reports highlight that the conflict is still in its early stages, with risks of regional spillovers and disruptions to key trade routes, such as the Strait of Hormuz.
Bitcoin (BTC) remains under pressure near the key support level of $65,700. Trading at $66,400 at the time of writing on Monday, a breakdown below this critical level would suggest a deeper correction ahead. Risk-off sentiment persists, as the escalating military aggression in the Middle East over the weekend continues to weigh on the Crypto King.
Middle-East tension dampens risk-on sentiment
Bitcoin price starts the week on a cautious note, with the Crypto King trading near the lower boundary of a one-month consolidation range on Monday, following the United States and Israel coordinated attack on Iran over the weekend.
The conflict continues to escalate as BBC News reports that Iranian strikes around the region continue early Monday, with explosions reported in Bahrain and Dubai, and smoke seen near the US embassy in Kuwait.
These rising tensions dampen risk-on sentiment and prompt investors toward safe-haven assets like Gold (XAU) and Silver (XAG), which rise by over 2.5% and 1.8%, respectively, as of Monday. In addition, the Oil price also opened sharply higher on Monday, as Iran’s Islamic Revolutionary Guard Corps (IRGC) announced that no vessels are permitted to cross the Strait of Hormuz.
QCP Capital’s report on Monday highlights that the crypto market appeared relatively well-positioned for a volatile weekend, given the warning signs throughout last week and possibly less concern about ripple effects after a similar strike last June.
“If we recall the previous US strike on Iran last June (also a weekend), BTC broke below $100K as the news broke only to trade back above on Monday, and subsequently rallied to a high of $123K a few weeks later,” says the QCP Capital Analyst.
The analyst further explains that while the scale of this attack is far greater than last year’s, price action could be hinting at early signs of history repeating itself.
Options data show that, despite rising geopolitical tensions, some traders used Saturday’s volatility to position for a potential rebound in March, after five consecutive down months.
The analyst concludes that, despite price action looking fairly constructive, traders should remain cautious as tensions and uncertainty continue to build. As the conflict is still in its early stages, with risks of regional spillovers and disruptions to key trade routes, such as the Strait of Hormuz, it could further weigh on riskier assets such as Bitcoin.
Institutional demand returns
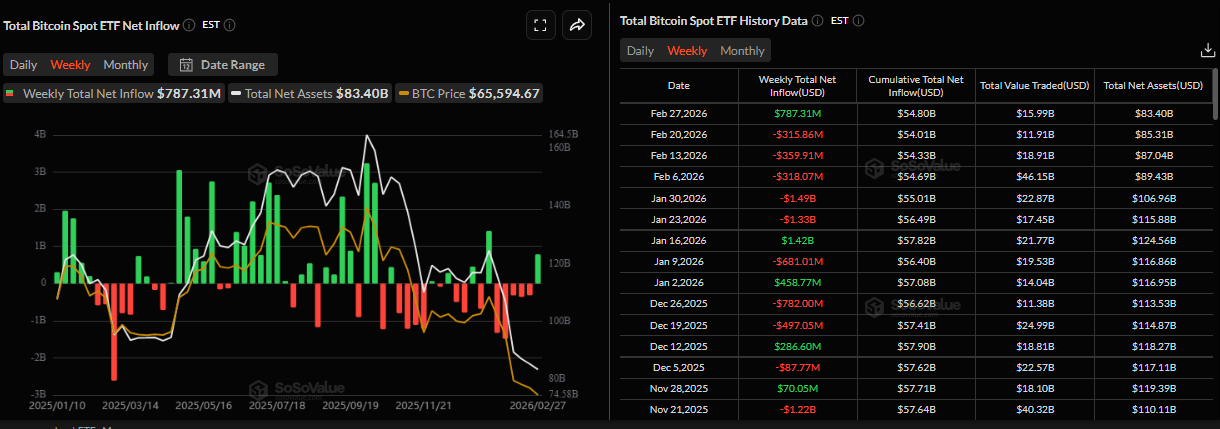
Institutional demand showed some signs of optimism last week. According to SoSoValue data, spot Bitcoin ETFs recorded inflows of $787.31 million last week, after five straight weeks of outflows. If these inflows continue and intensify, BTC could see a recovery in the upcoming weeks.
Bitcoin Price Forecast: BTC could extend deeper correction if it closes below key support
The Crypto King is retesting a lower consolidating range, trading at $66,400 as of Monday. The near-term tone is mildly bullish as price holds above the 50-period Exponential Moving Average (EMA) on the 4-hour chart while remaining capped beneath the descending 100-period EMA, framing a recovery within a broader consolidation.
The Relative Strength Index (RSI) on the 4-hour chart around 50 signals balanced momentum after rebounding from the mid-30s, consistent with stabilizing demand rather than aggressive trend extension. The Moving Average Convergence Divergence (MACD) has turned back into positive territory with the MACD line above the signal line, and a modestly positive histogram, suggesting recovering upside momentum that supports a gradual grind higher rather than a sharp breakout.
Immediate resistance emerges near the 100-period EMA around $67,650, and a sustained break above this area would expose the recent range highs toward $69,000 as the next upside objective. Beyond that, the upper boundary of the consolidation range near $71,700 stands as a stronger resistance zone where buying pressure would be tested.
On the downside, initial support is seen at the 50-period EMA near $66,500, with a move below this level opening the way toward $65,800, last week’s reaction area.
A sustained break above $68,500 would soften the bearish tone, with a recovery toward the upper consolidating boundary near $71,700, while a drop back through $63,000 would expose $60,000 first, then toward the technical target of $58,822.
(The technical analysis of this story was written with the help of an AI tool.)
Bitcoin, altcoins, stablecoins FAQs
Bitcoin is the largest cryptocurrency by market capitalization, a virtual currency designed to serve as money. This form of payment cannot be controlled by any one person, group, or entity, which eliminates the need for third-party participation during financial transactions.
Altcoins are any cryptocurrency apart from Bitcoin, but some also regard Ethereum as a non-altcoin because it is from these two cryptocurrencies that forking happens. If this is true, then Litecoin is the first altcoin, forked from the Bitcoin protocol and, therefore, an “improved” version of it.
Stablecoins are cryptocurrencies designed to have a stable price, with their value backed by a reserve of the asset it represents. To achieve this, the value of any one stablecoin is pegged to a commodity or financial instrument, such as the US Dollar (USD), with its supply regulated by an algorithm or demand. The main goal of stablecoins is to provide an on/off-ramp for investors willing to trade and invest in cryptocurrencies. Stablecoins also allow investors to store value since cryptocurrencies, in general, are subject to volatility.
Bitcoin dominance is the ratio of Bitcoin's market capitalization to the total market capitalization of all cryptocurrencies combined. It provides a clear picture of Bitcoin’s interest among investors. A high BTC dominance typically happens before and during a bull run, in which investors resort to investing in relatively stable and high market capitalization cryptocurrency like Bitcoin. A drop in BTC dominance usually means that investors are moving their capital and/or profits to altcoins in a quest for higher returns, which usually triggers an explosion of altcoin rallies.

ผู้ใช้กว่าหนึ่งล้านคนพึ่งพา FXStreet สำหรับข้อมูลตลาดเรียลไทม์ เครื่องมือกราฟ การวิเคราะห์จากผู้เชี่ยวชาญ และข่าวฟอเร็กซ์ ปฏิทินเศรษฐกิจที่ครอบคลุมและเว็บบินาร์การศึกษาช่วยให้เทรดเดอร์ทันเหตุการณ์และตัดสินใจอย่างรอบคอบ FXStreet มีทีมงานประมาณ 60 คน แบ่งระหว่างสำนักงานใหญ่บาร์เซโลนาและภูมิภาคต่าง ๆ ทั่วโลก
อ่านเพิ่มเติม


