
Cardano Price Forecast: ADA risks lowest yearly close as bearish bets mount
โดย Vishal Dixit
วันที่เผยแพร่: 1 Dec 2025 | วันที่แก้ไข: 1 Dec 2025


บทความยอดนิยม

Cardano (ADA) price is down over 6% at press time on Monday, starting December in the red and risking the lowest 2025 daily close. The derivatives market sees a buildup of short positions as investor sentiment turns bearish.
- Cardano drops over 6% on Monday, extending the 32% decline from November.
- Derivatives data show an increase in bearish bets as the funding rate turns negative.
- The technical outlook for Cardano indicates a bearish bias, as the RSI is oversold.
Cardano (ADA) price is down over 6% at press time on Monday, starting December in the red and risking the lowest 2025 daily close. The derivatives market sees a buildup of short positions as investor sentiment turns bearish. Technically, Cardano risks further losses as the Relative Strength Index (RSI) turns oversold and the Moving Average Convergence Divergence (MACD) indicator inches toward a potential crossover.
Bearish bets mount against Cardano as the broader market weakens
The Cardano derivatives market sees a decline in traders' interest as ADA futures Open Interest (OI) drops 6.82% over the last 24 hours to $693 million. This sudden decline in capital at risk from investors aligns with the broader crypto market sell-off.
Additionally, the OI-weighted funding rate stands at -0.0057% suggesting increased confidence among bearish-aligned traders, who are willing to pay a premium to hold short positions.
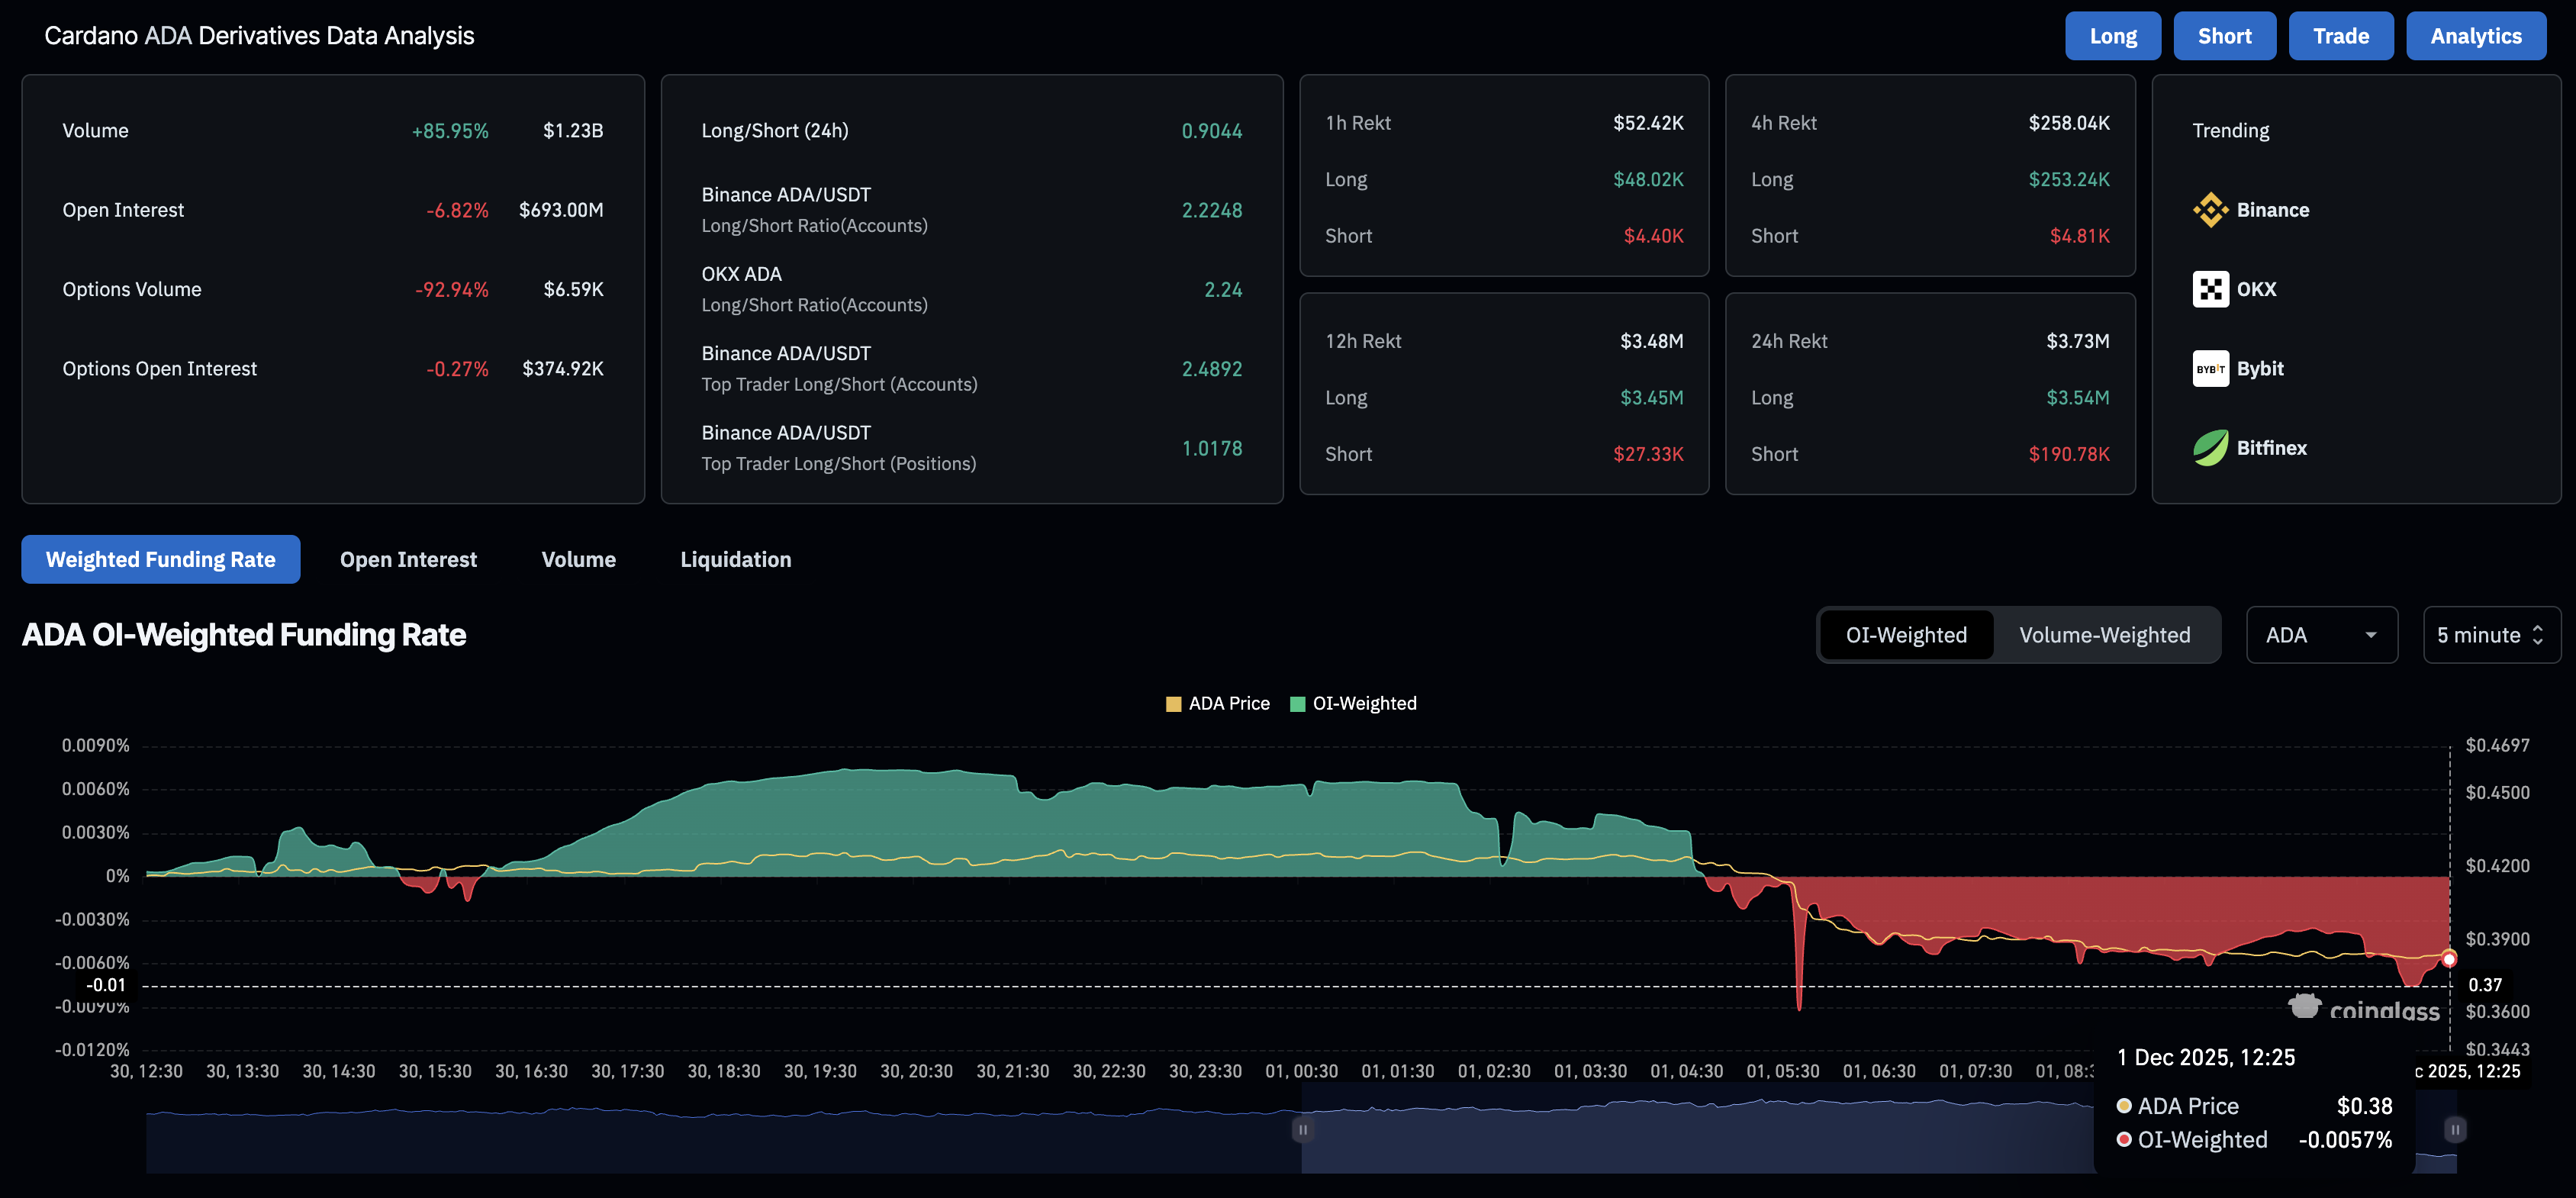
In line with increased selling, the long-to-short ratio stands at 0.8765, with short positions building to 53.29% of all derivatives contracts over the last 24 hours. This indicates a sell-side dominance in Cardano derivatives as traders anticipate a further decline in ADA prices.

Technical outlook: Is Cardano at a 15% downside risk?
Cardano extends its correction below $0.4000 after more than 30% loss in November, indicating a downward trend. At the time of writing, ADA is down over 6% on Monday, risking the lowest annual close so far.
The technical indicators on the daily chart reflect an increase in overhead supply pressure as the RSI is at 26, extending the fluctuations near the oversold zone. If RSI remains under 30, Cardano remains at risk of steeper corrections.
At the same time, the MACD shifts towards the signal line, potentially leading to a bearish crossover. If it occurs, the indicator would confirm a refreshed bearish momentum and a sell signal for Cardano.
A daily close below the November 21 low of $0.3876 could trigger a nearly 15% drop from the current market price to the September 16, 2024, low of $0.3264.
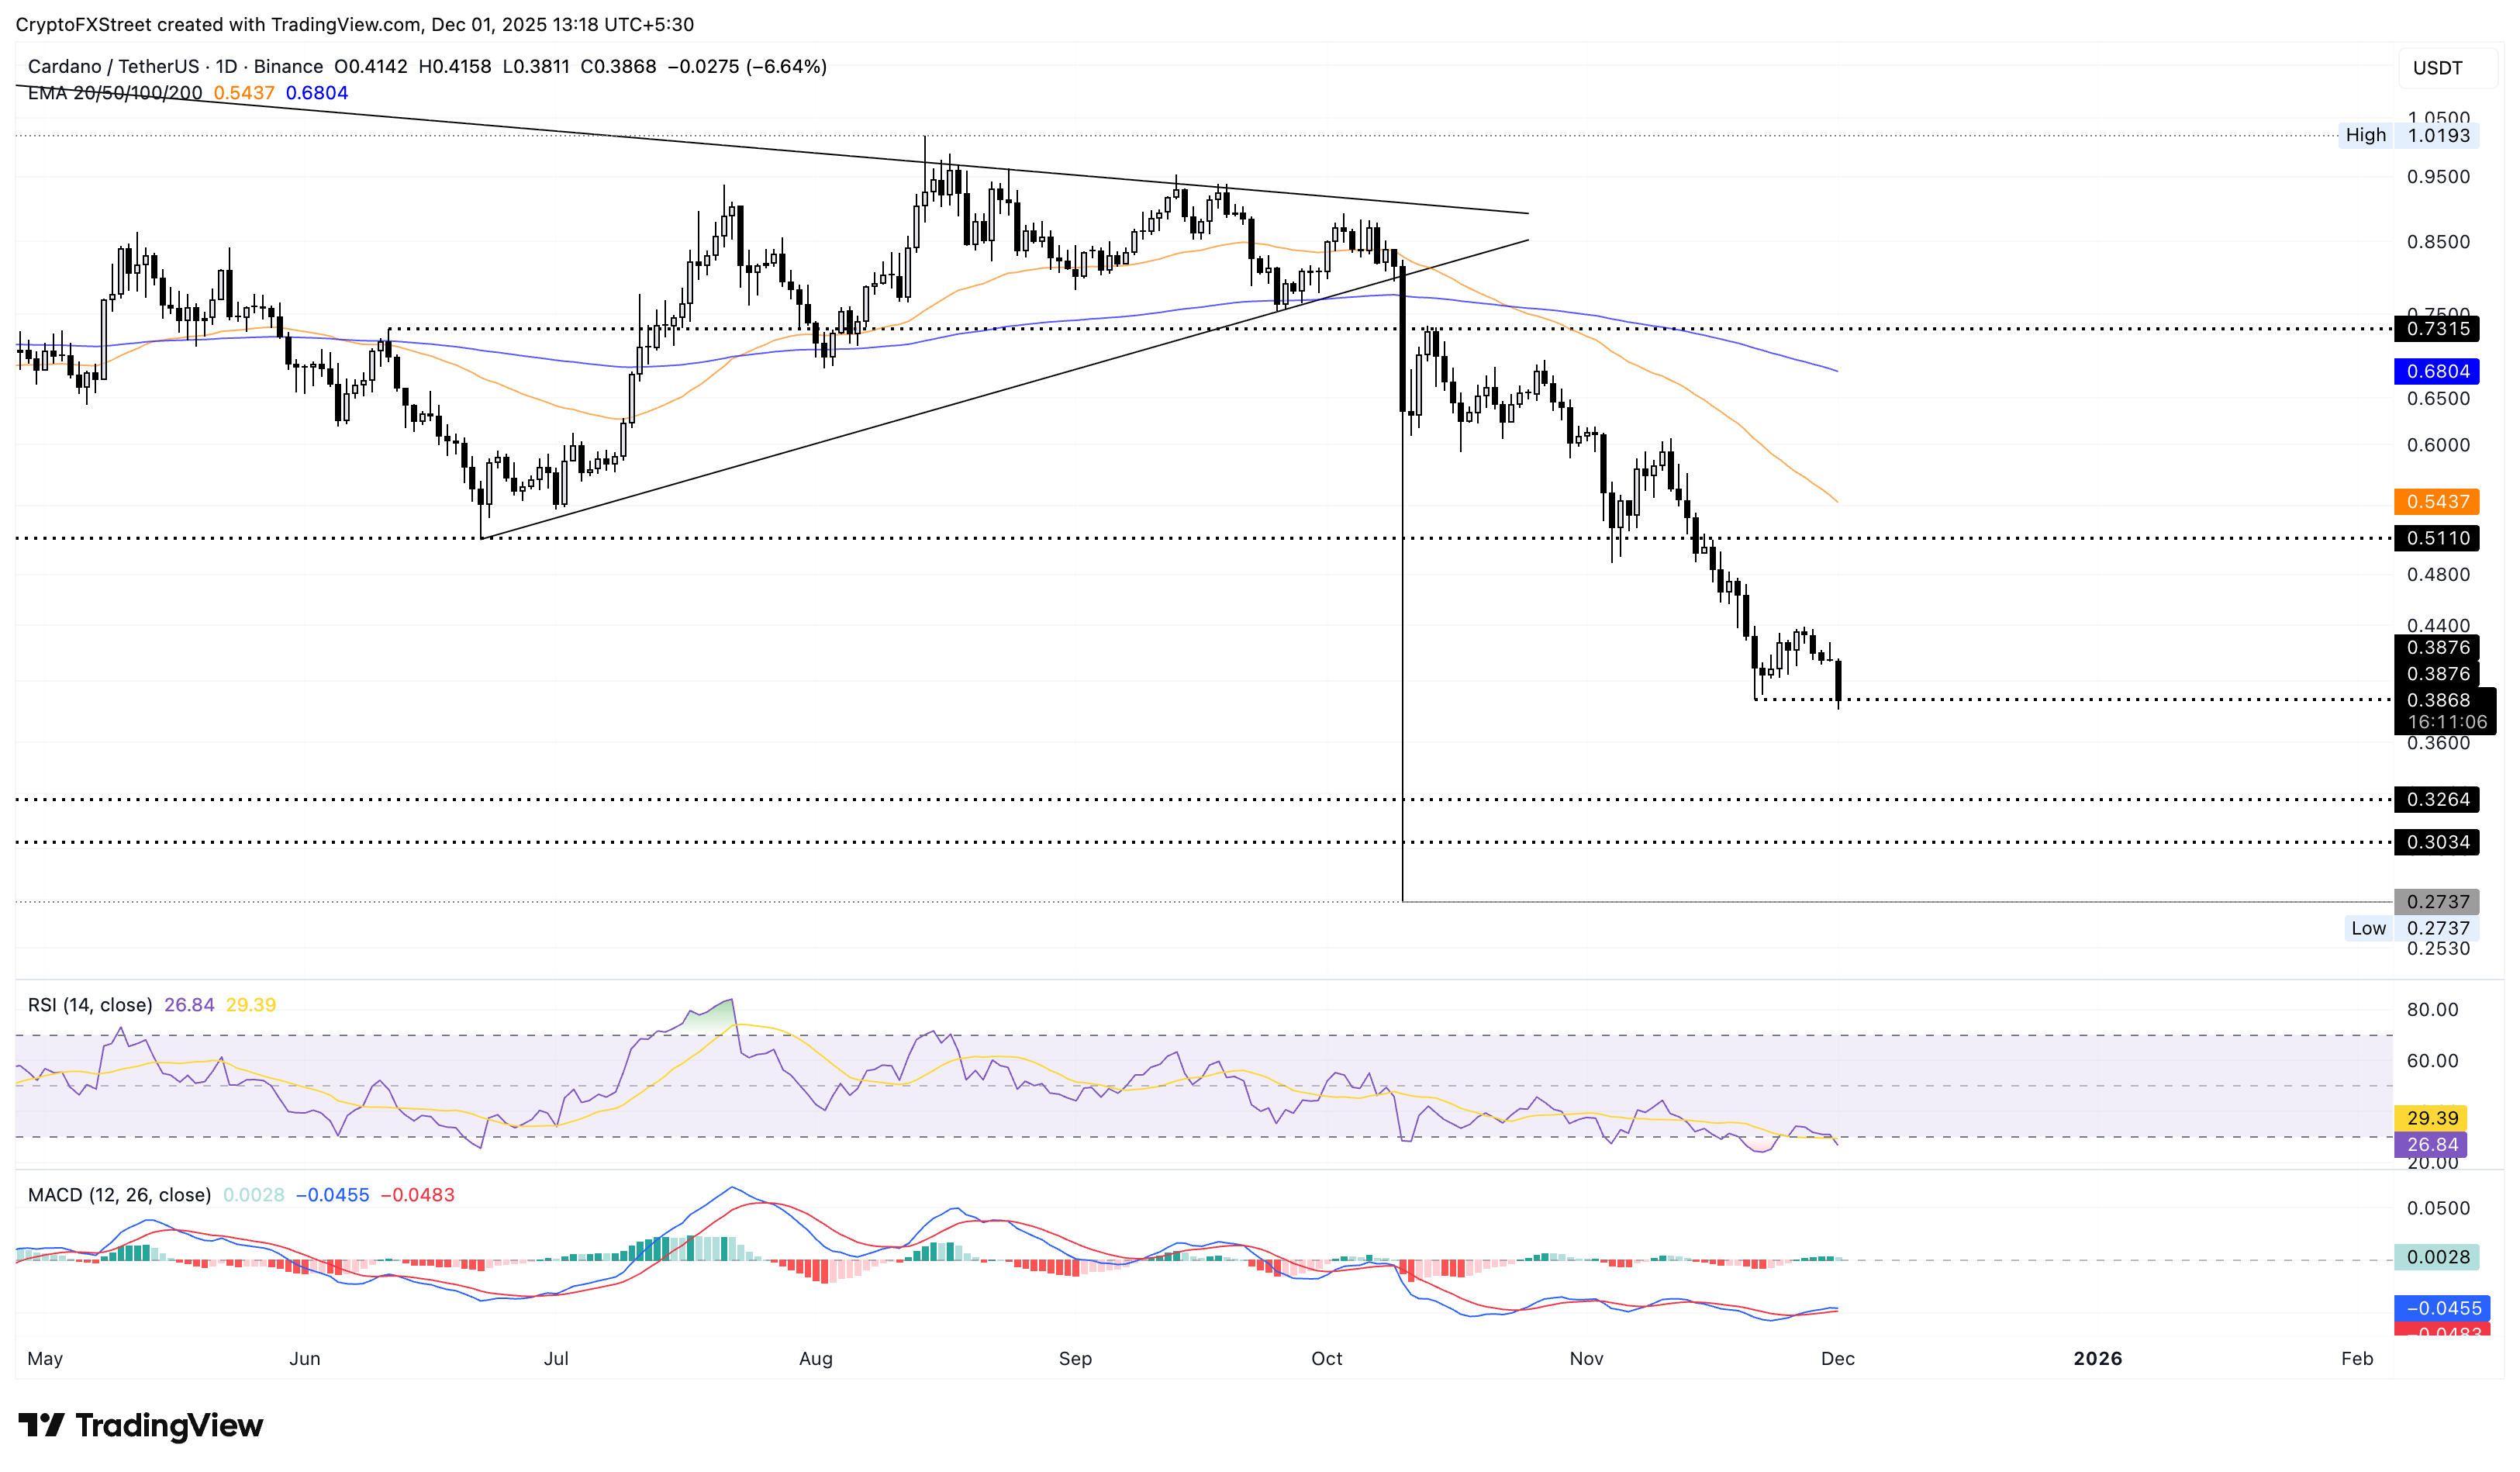
However, if Cardano bulls keep the prices buoyant above $0.3876, it could resurface above $0.4000 and potentially target the $0.5000 psychological level.

ผู้ใช้กว่าหนึ่งล้านคนพึ่งพา FXStreet สำหรับข้อมูลตลาดเรียลไทม์ เครื่องมือกราฟ การวิเคราะห์จากผู้เชี่ยวชาญ และข่าวฟอเร็กซ์ ปฏิทินเศรษฐกิจที่ครอบคลุมและเว็บบินาร์การศึกษาช่วยให้เทรดเดอร์ทันเหตุการณ์และตัดสินใจอย่างรอบคอบ FXStreet มีทีมงานประมาณ 60 คน แบ่งระหว่างสำนักงานใหญ่บาร์เซโลนาและภูมิภาคต่าง ๆ ทั่วโลก
อ่านเพิ่มเติม


