
Crypto Market Overview: Bitcoin slows recovery as US SEC defines crypto assets, River, Kaspa, DeXe rise
โดย Vishal Dixit
วันที่เผยแพร่: 18 Mar 2026 | วันที่แก้ไข: 18 Mar 2026


บทความยอดนิยม

Bitcoin (BTC) holds above $74,000 at press time on Wednesday, slowing its recovery after eight consecutive days of gains, with a bearish close on the previous day.
- Bitcoin hovers above $74,000 on Wednesday as market sentiment remains steady amid profit-taking.
- The US SEC issued its first-ever definitions of crypto assets on Tuesday as digital commodities, collectibles, tools, stablecoins, and securities.
- River, Kaspa, and DeXe sustain gains and emerge as top gainers over the last 24 hours.
Bitcoin (BTC) holds above $74,000 at press time on Wednesday, slowing its recovery after eight consecutive days of gains, with a bearish close on the previous day. Sentiments remain neutral while the US Securities and Exchange Commission (SEC) has released its first-ever definition of crypto assets, improving regulatory clarity.
River (RIVER), Kaspa (KAS), and DeXe (DEXE) sustain recovery so far this week, emerging as top gainers in the last 24 hours.
Crypto recovery slows amid US SEC’s crypto definition release
Bitcoin retreats to $74,000 at the time of writing on Wednesday, after a bearish close on Tuesday, ending an eight-day rally. BTC holds its recovery above the 50-day Exponential Moving Average (EMA) at $72,980, hinting at a potential consolidation.
The immediate resistance for Bitcoin is at the 50% trend-based Fibonacci retracement at $75,124, capping the upside to the 100-day EMA at $79,264.
Momentum shows a largely bullish bias, with the Moving Average Convergence Divergence (MACD) rising above its zero line and moving higher into positive territory as bullish histograms expand. Meanwhile, the Relative Strength Index (RSI) at 59 maintains a largely upward trend above the midline, with further room to the upside before reaching the overbought zone.
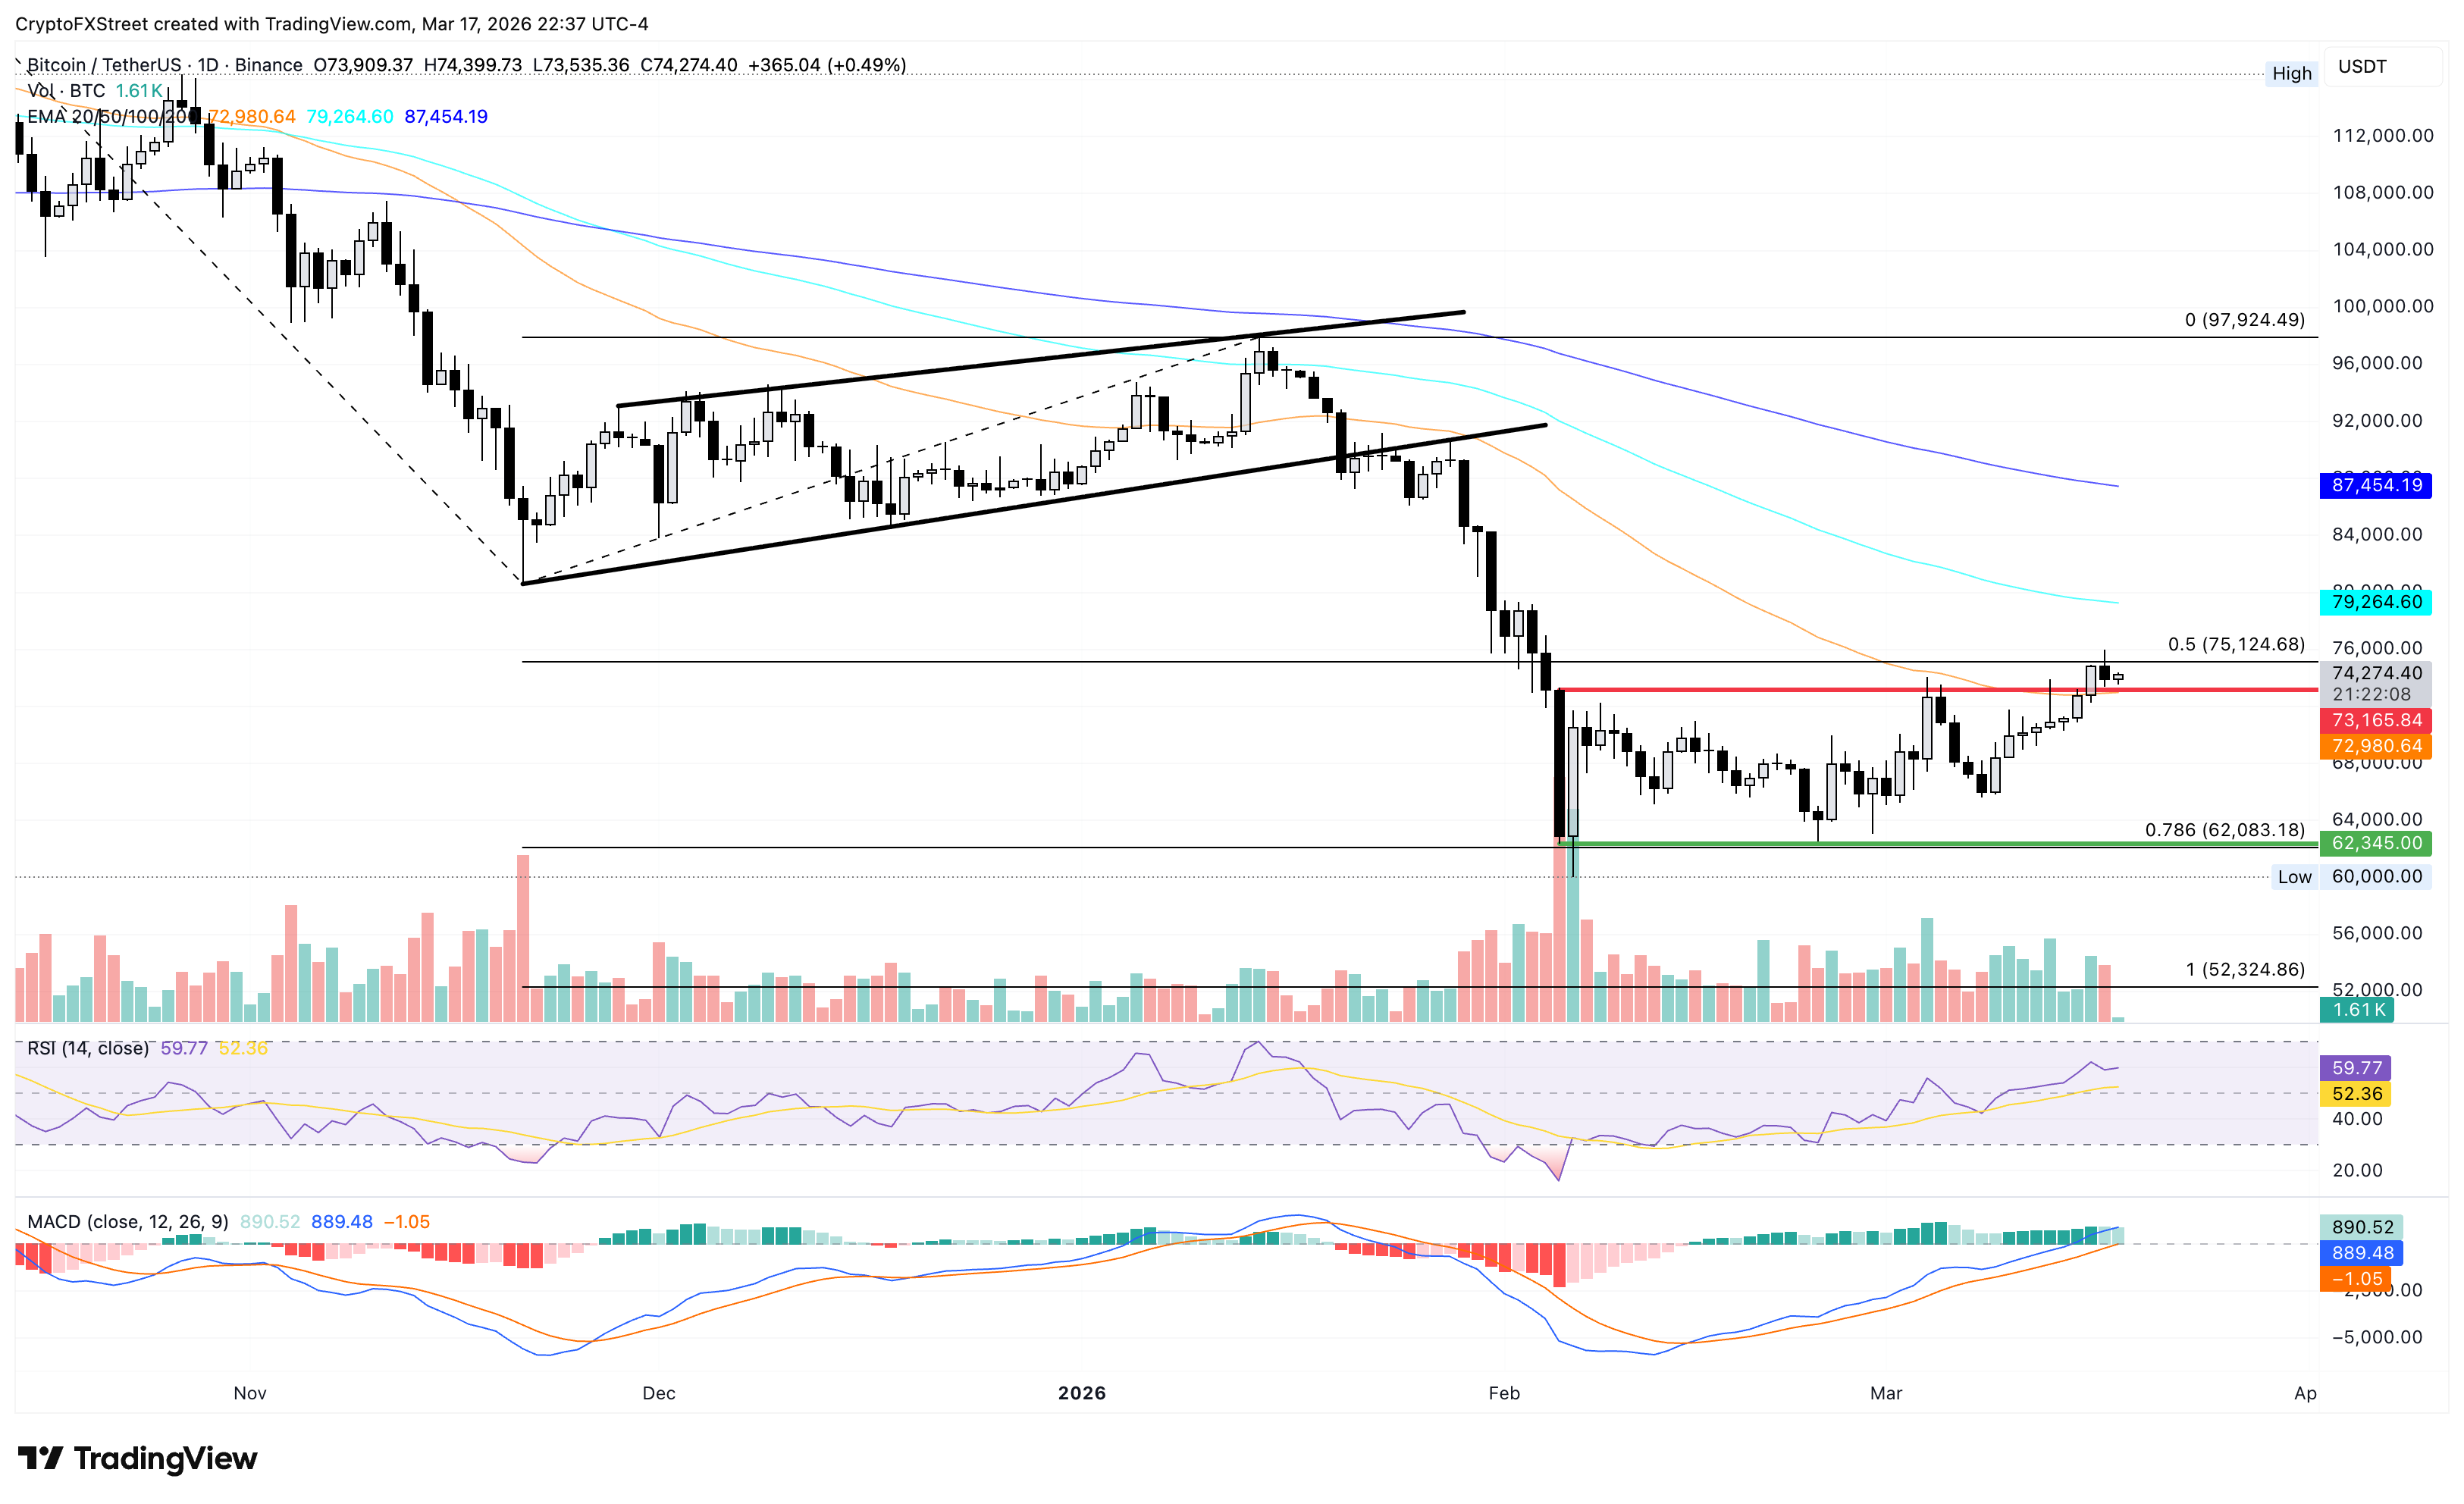
On the flip side, a slip below the 50-day EMA could risk a steep decline to the February 5th low at $62,345.
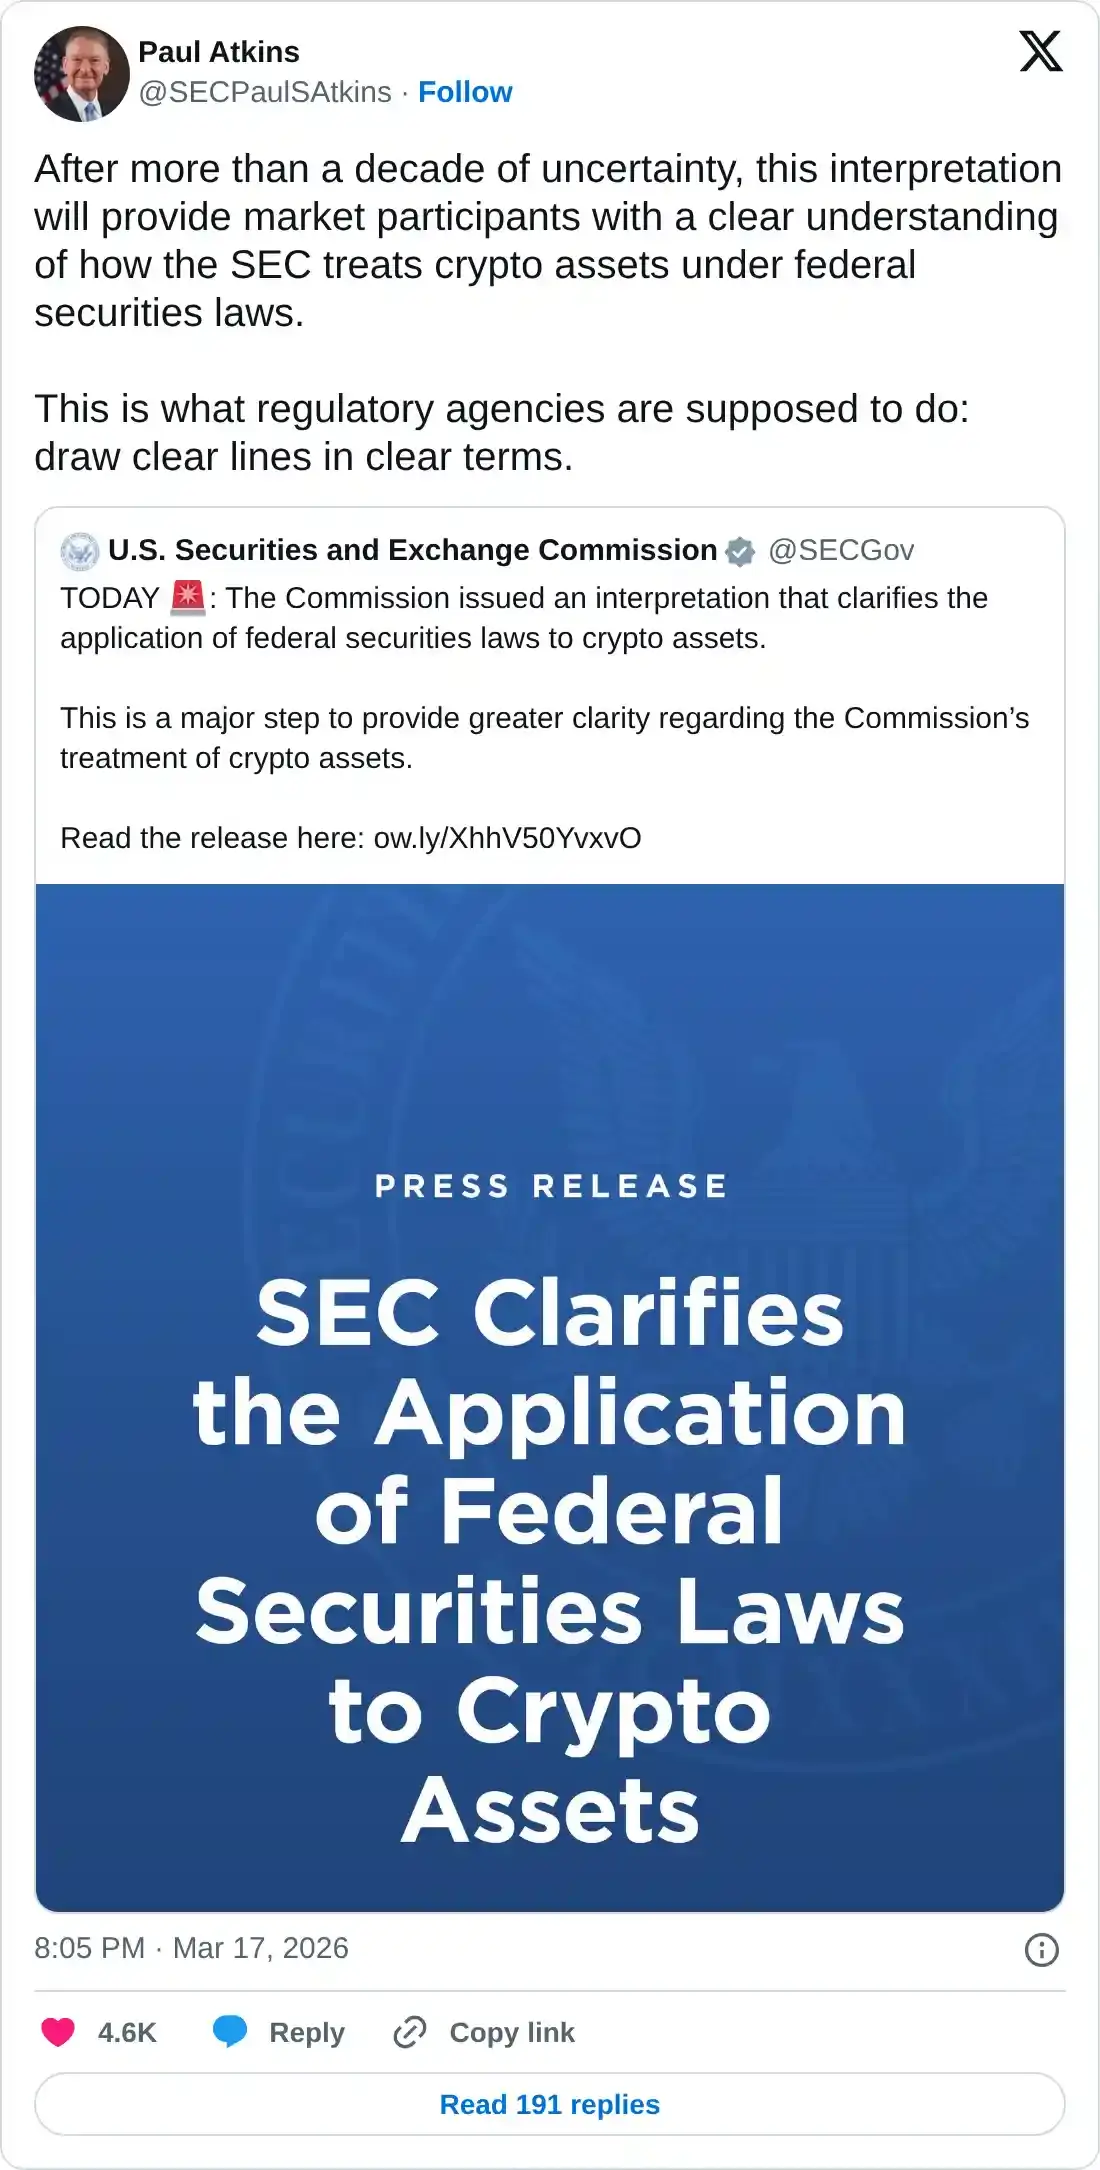
As Bitcoin struggles to hold the curves, extended support trend, USSEC has released its first-ever definition of crypto assets. The SEC Chair Paul Atkins announced that the assets will be classified as digital commodities, digital collectibles, digital tools, stablecoins, and securities.
The criteria for determining crypto as an SEC security remains the Howey test, where an asset is sold with the promise of the issuer, with the promise that the issuer will build something, and investors expect profits from their efforts, it becomes an investment contract. And once the project becomes fully functional and decentralized, or the contract ends, the token will no longer be treated as a security.
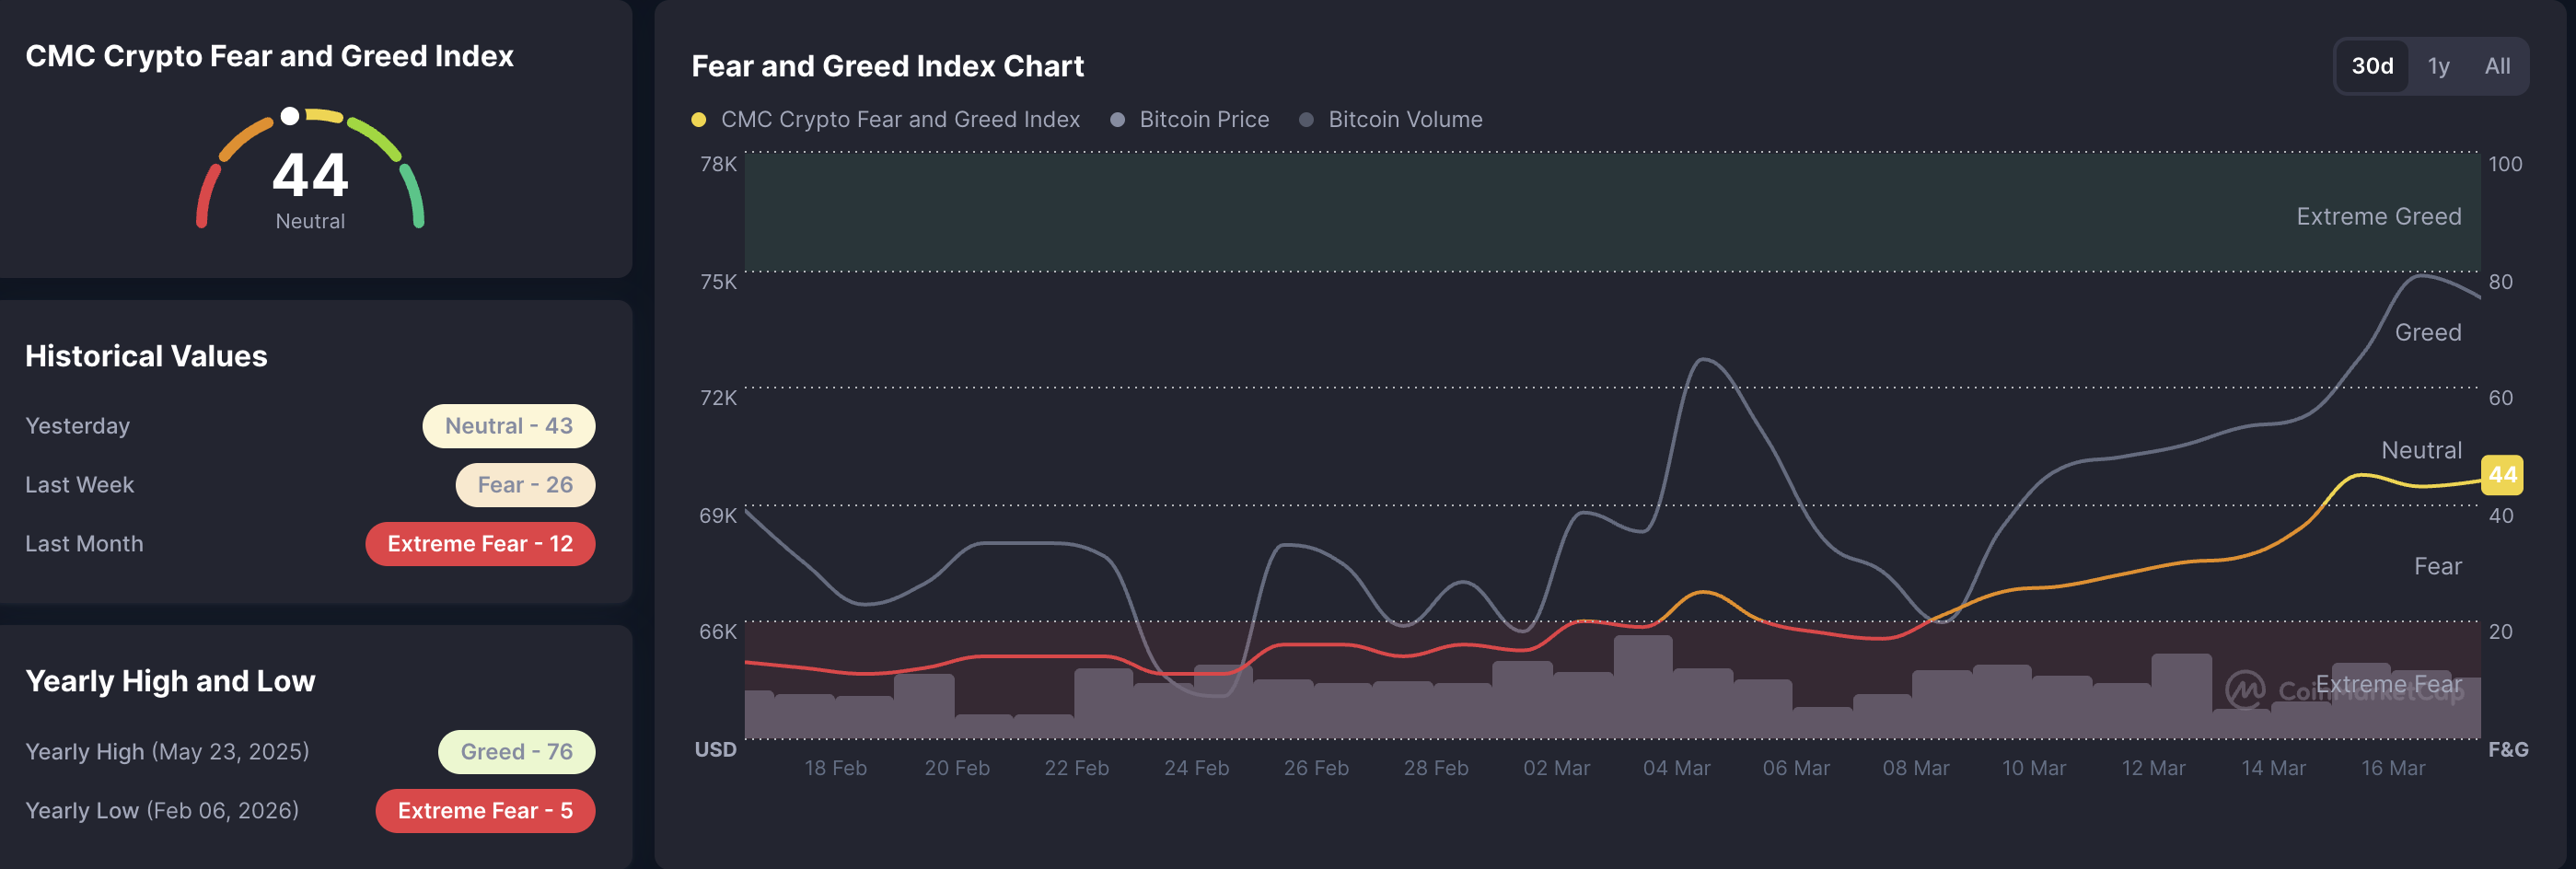
Despite the short-term pullback in Bitcoin's recovery rally, the broader market sentiment remains neutral, according to CoinMarketCap's Crypto Fear and Greed Index, which sits at 44. Readings between 40 and 60 suggest neutral market sentiment, while readings above 60 reflect greed and below 40 indicate fear.
Top Crypto Gainers: River, Kaspa and DeXe face key resistance levels
River is up 4% at press time on Wednesday, holding above $20. The near-term bias is cautiously bullish, as RIVER holds well above the 50-day EMA, preserving a medium-term uptrend.
Immediate resistance emerges near the 50% retracement at $25.22, measured from the $87.60 high to the $7.26 low. A daily close above this level would open the way toward the 78.6% Fibonacci retracement level at $51.41.
The MACD line remains above its signal and in positive territory, while the histogram has stopped expanding, suggesting bullish momentum persists but is no longer accelerating. The RSI at 63 stays below overbought conditions, indicating buyers retain control without excessive stretch.
On the downside, initial support is seen at $21.50, with a deeper pullback eyeing the 50-day EMA around $17.50.
Meanwhile, Kaspa extends the streak of consecutive gains for the fifth day, approaching the 100-day EMA at $0.03850. At the time of writing, KAS is up 2% on Wednesday, building on the 7% gains from the previous day.
The near-term bias is bullish as KAS extends its rally after piercing the descending trendline, with the breakout region near $0.0355 now acting as a pivot. Still, the descending 50-, 100-, and 200-day EMAs frame the move as an early recovery within a broader corrective structure.
On the upside, a breakout above the 100-day EMA at $0.03850 could face opposition from the S2 and S3 Pivot Points at $0.04001 and $0.04501, respectively.
The MACD histograms expand into positive territory, and the MACD line extends above its signal line, suggesting strengthening upside momentum. The RSI at 75 signals overbought conditions, which could slow the advance, but does not negate the nascent bullish tone.
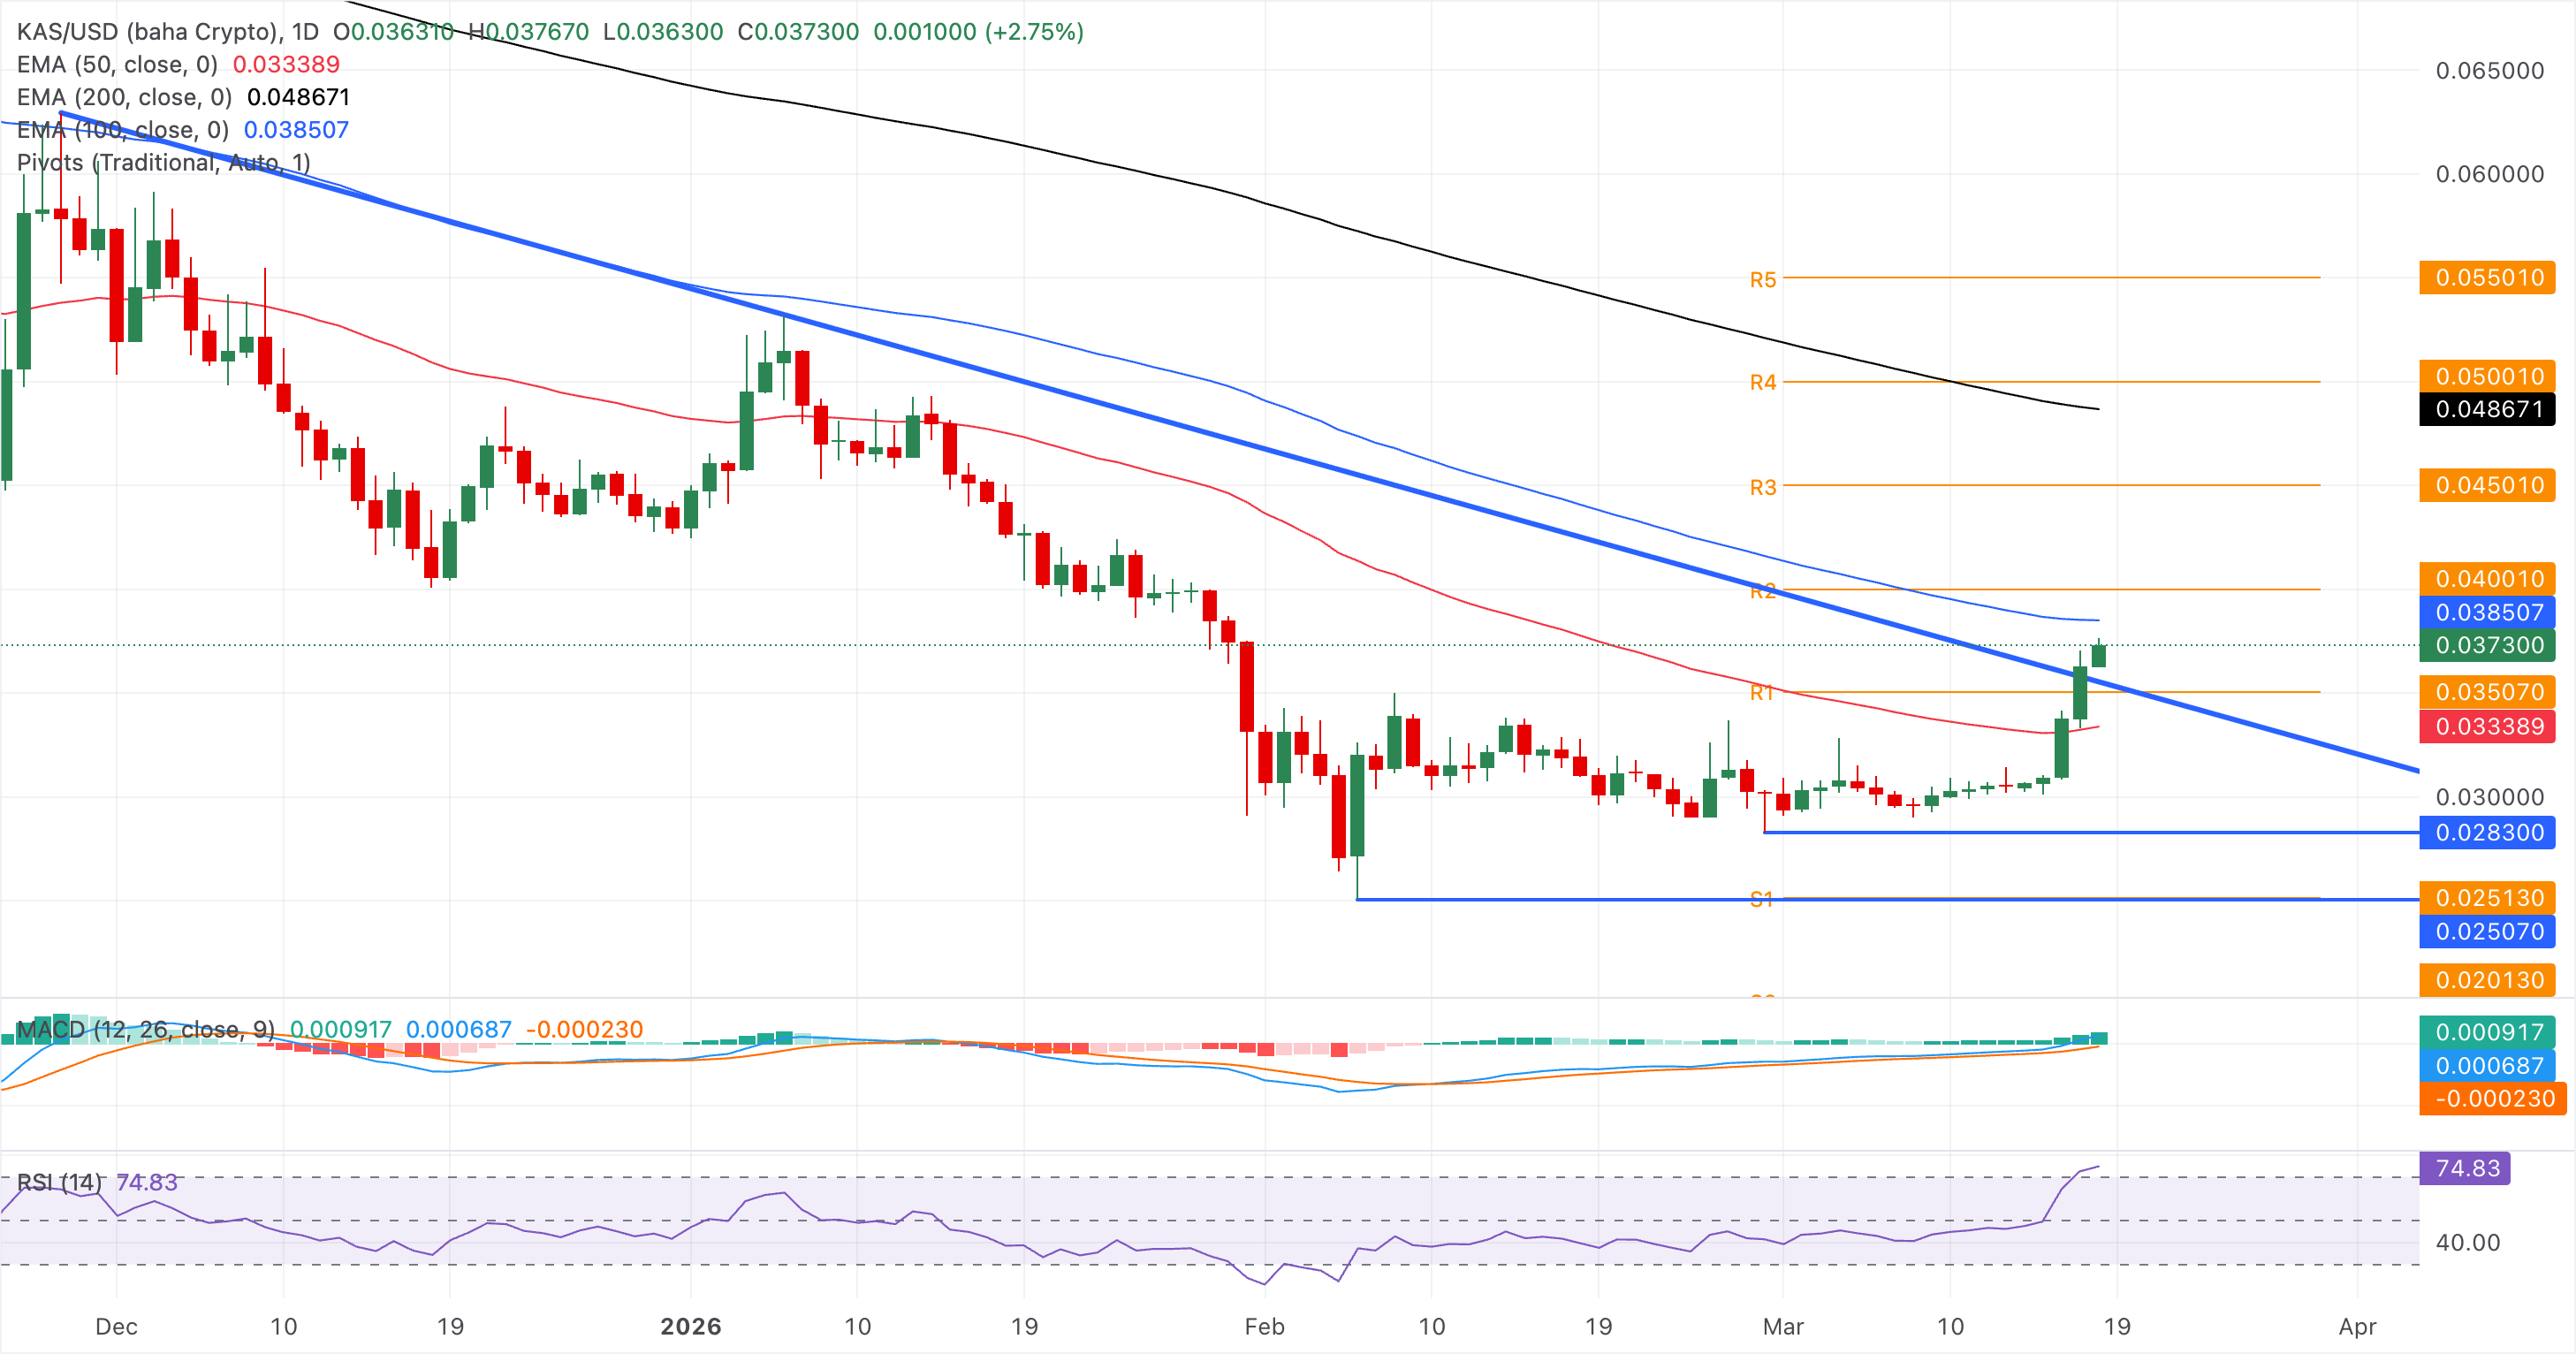
Looking down, the support lies at the broken trendline zone around $0.0355, with further downside protection at the 50-day EMA near $0.03338.
On the other hand, DeXe holds steady above $5.00 at press time on Wednesday, after a 7% jump from the 200-day EMA at $5.19.The near-term bias is bullish, with the 50- and 100-day EMAs converging for a potential crossover.
The MACD holds in positive territory with the line above its signal, although the latest tick shows slight contraction, suggesting buyers remain in control but upside momentum cools at elevated levels. The RSI at 76 stays in overbought territory, flagging stretched conditions but not yet signalling a completed reversal.
A sustained hold above the 78.6% Fibonacci retracement at $5.52, measured from the $7.63 high to the $1.73 low, could extend the rally to $7.63.
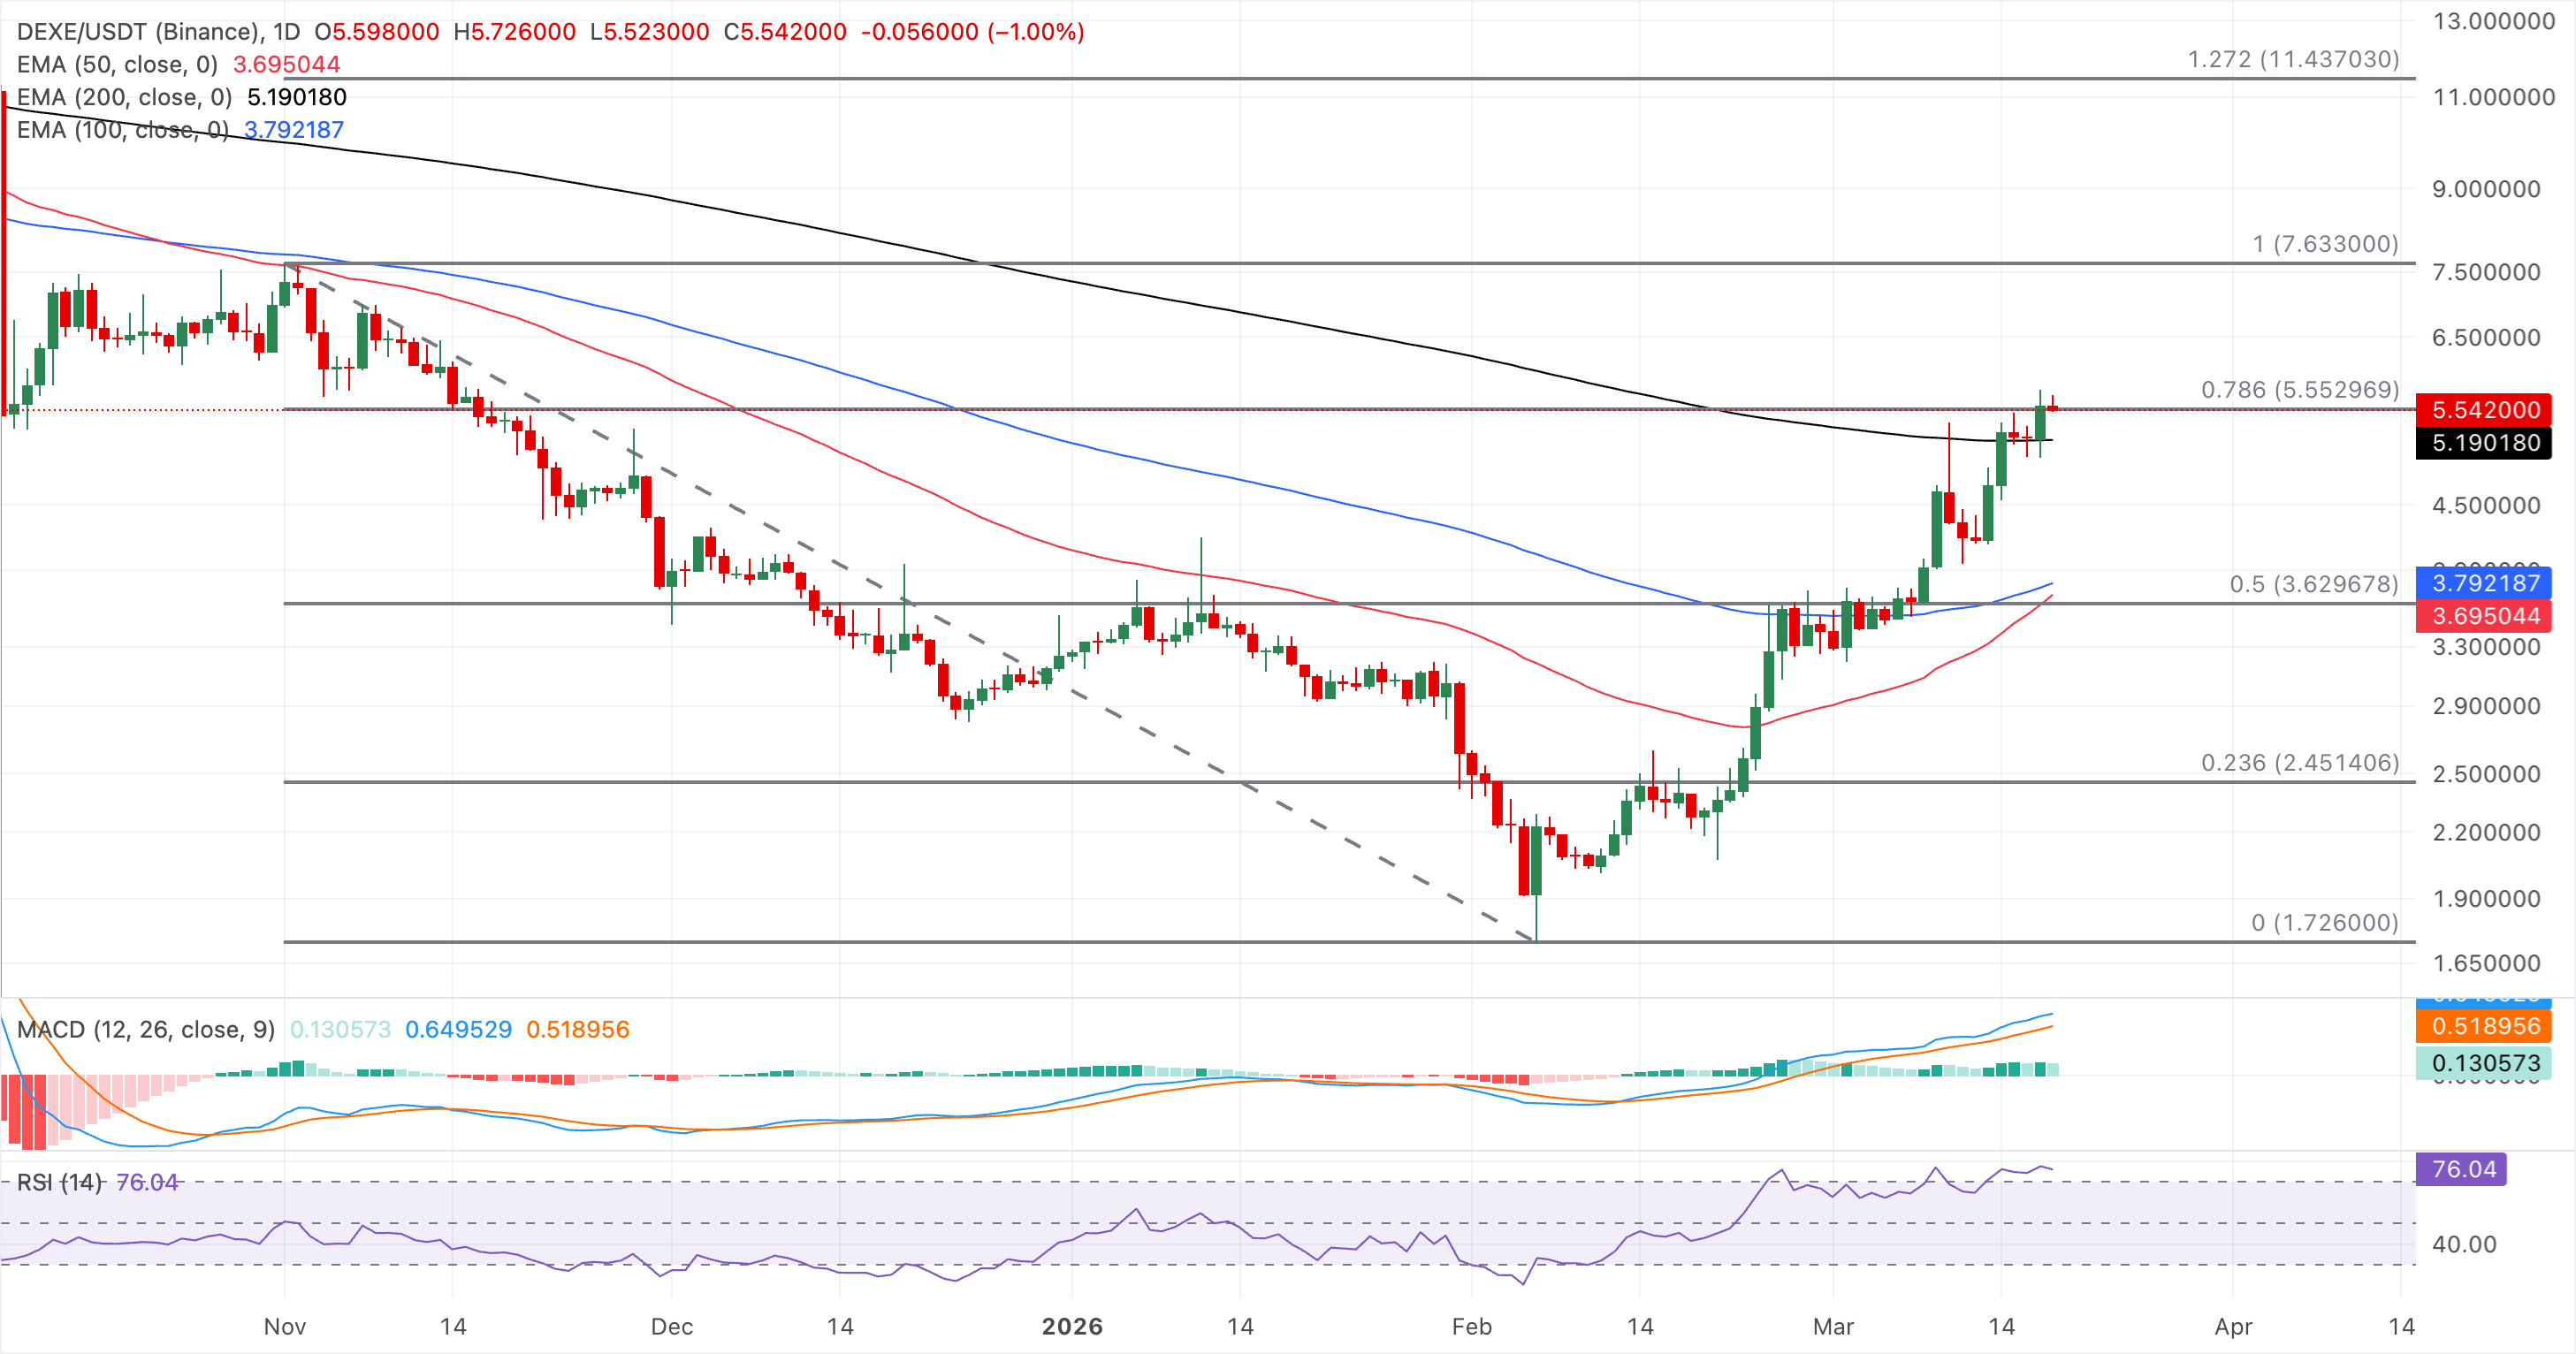
Immediate support below the 200-day EMA at $5.19 emerges at the 50% retracement at $3.62.
(The technical analysis of this story was written with the help of an AI tool.)

ผู้ใช้กว่าหนึ่งล้านคนพึ่งพา FXStreet สำหรับข้อมูลตลาดเรียลไทม์ เครื่องมือกราฟ การวิเคราะห์จากผู้เชี่ยวชาญ และข่าวฟอเร็กซ์ ปฏิทินเศรษฐกิจที่ครอบคลุมและเว็บบินาร์การศึกษาช่วยให้เทรดเดอร์ทันเหตุการณ์และตัดสินใจอย่างรอบคอบ FXStreet มีทีมงานประมาณ 60 คน แบ่งระหว่างสำนักงานใหญ่บาร์เซโลนาและภูมิภาคต่าง ๆ ทั่วโลก
อ่านเพิ่มเติม


