
Crypto Today: Bitcoin, Ethereum, XRP advance breakout after US-Iran ceasefire extension
โดย John Isige
อัปเดตแล้ว: 22 Apr 2026


บทความยอดนิยม

Cryptocurrency prices are broadly grinding up on Wednesday, with Bitcoin (BTC) rising above the pivotal $78,000 level as of writing. Ethereum (ETH) shows signs of extending its rebound, trading near $2,400, while Ripple (XRP) hovers above the reclaimed immediate support at $1.45.
- Bitcoin broadens its recovery, breaking the $78,000 hurdle after Trump extended the US-Iran ceasefire to allow peace talks to continue.
- Ethereum bulls test breakout strength as price nears $2,400 with the 50-day and 200-day EMAs offering support.
- XRP holds above $1.45 as momentum indicators signal a strengthening neutral-to-bullish outlook.
Cryptocurrency prices are broadly grinding up on Wednesday, with Bitcoin (BTC) rising above the pivotal $78,000 level as of writing. Ethereum (ETH) shows signs of extending its rebound, trading near $2,400, while Ripple (XRP) hovers above the reclaimed immediate support at $1.45.
Trump extends US-Iran ceasefire lifting BTC, ETH and XRP recovery optimism
US President Donald Trump announced on Tuesday that he had extended the ceasefire in the war with Iran “until such a time their leaders and representatives can come up with a unified proposal.”
Although the second round of peace talks in Pakistan’s capital, Islamabad, remains uncertain, Vice President JD Vance is expected to lead the US delegation when the time comes. Meanwhile, Iran is yet to confirm its participation in the peace talks, citing the continued US blockade of its ports and what the regime terms as negotiating under “the shadow of threat.”
The ceasefire extension has buoyed sentiment across the crypto market, boosting total market capitalization by 1.8% over the last 24 hours to $2.7 trillion, according to CoinGecko. Overall, sentiment holds in the fear territory on Wednesday, up from the extreme fear region last week, as highlighted by the crypto Fear & Greed Index.
A steady increase in sentiment could boost risk appetite, raising the odds of an extended recovery.
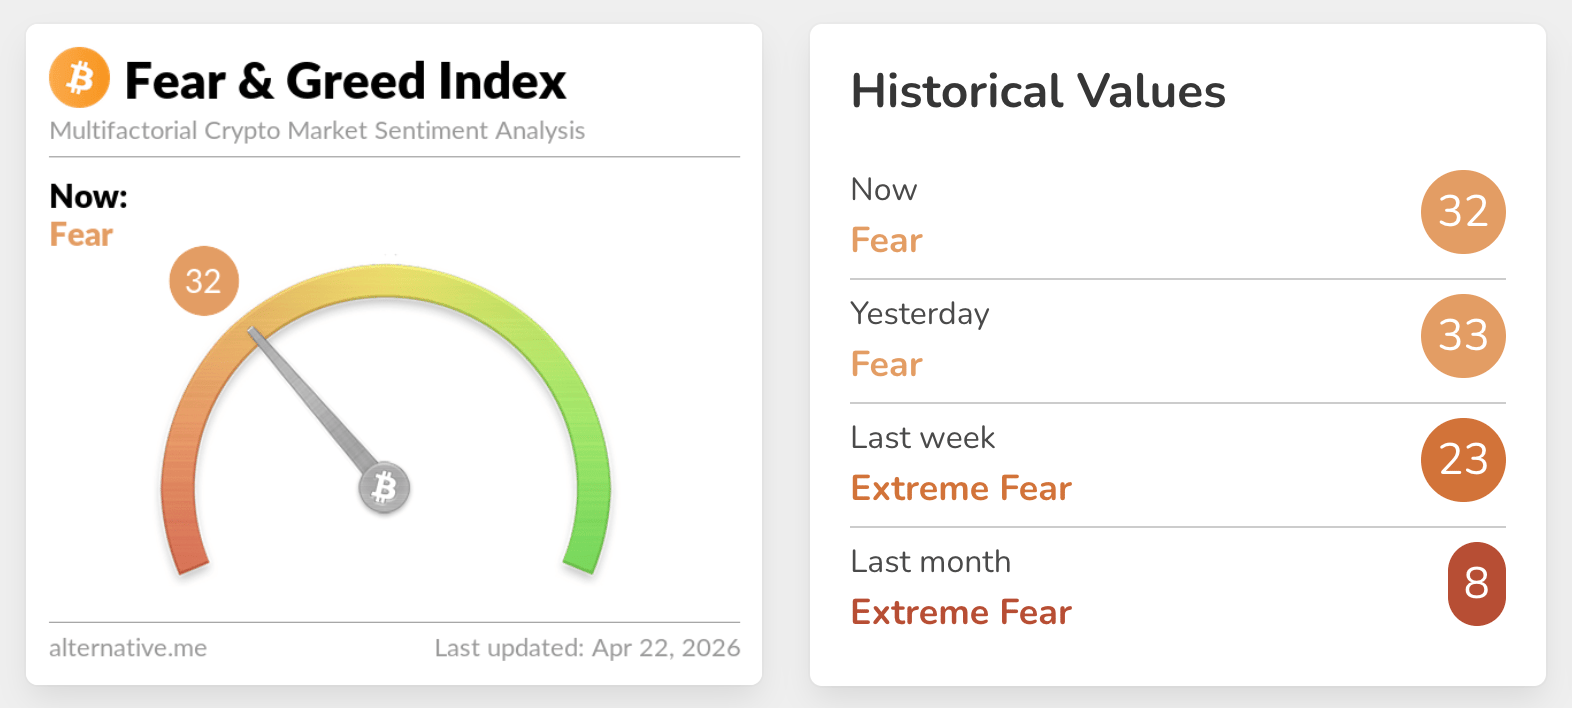
Chart of the day: Bitcoin set to tackle $80,000 psychological resistance
Bitcoin trades at $78,145, holding a bullish near-term bias as price extends well above the 50-day and 100-day Exponential Moving Averages (EMAs) at $72,351 and $75,379, respectively. Both moving averages reinforce a constructive trend despite the longer-term 200-day EMA at $82,574 still capping the broader upside.
The Relative Strength Index (RSI) at 65 on the daily chart leans toward bullish territory without signaling extreme overbought conditions, while the Moving Average Convergence Divergence (MACD) histogram remains positive, hinting that upside momentum is firm.
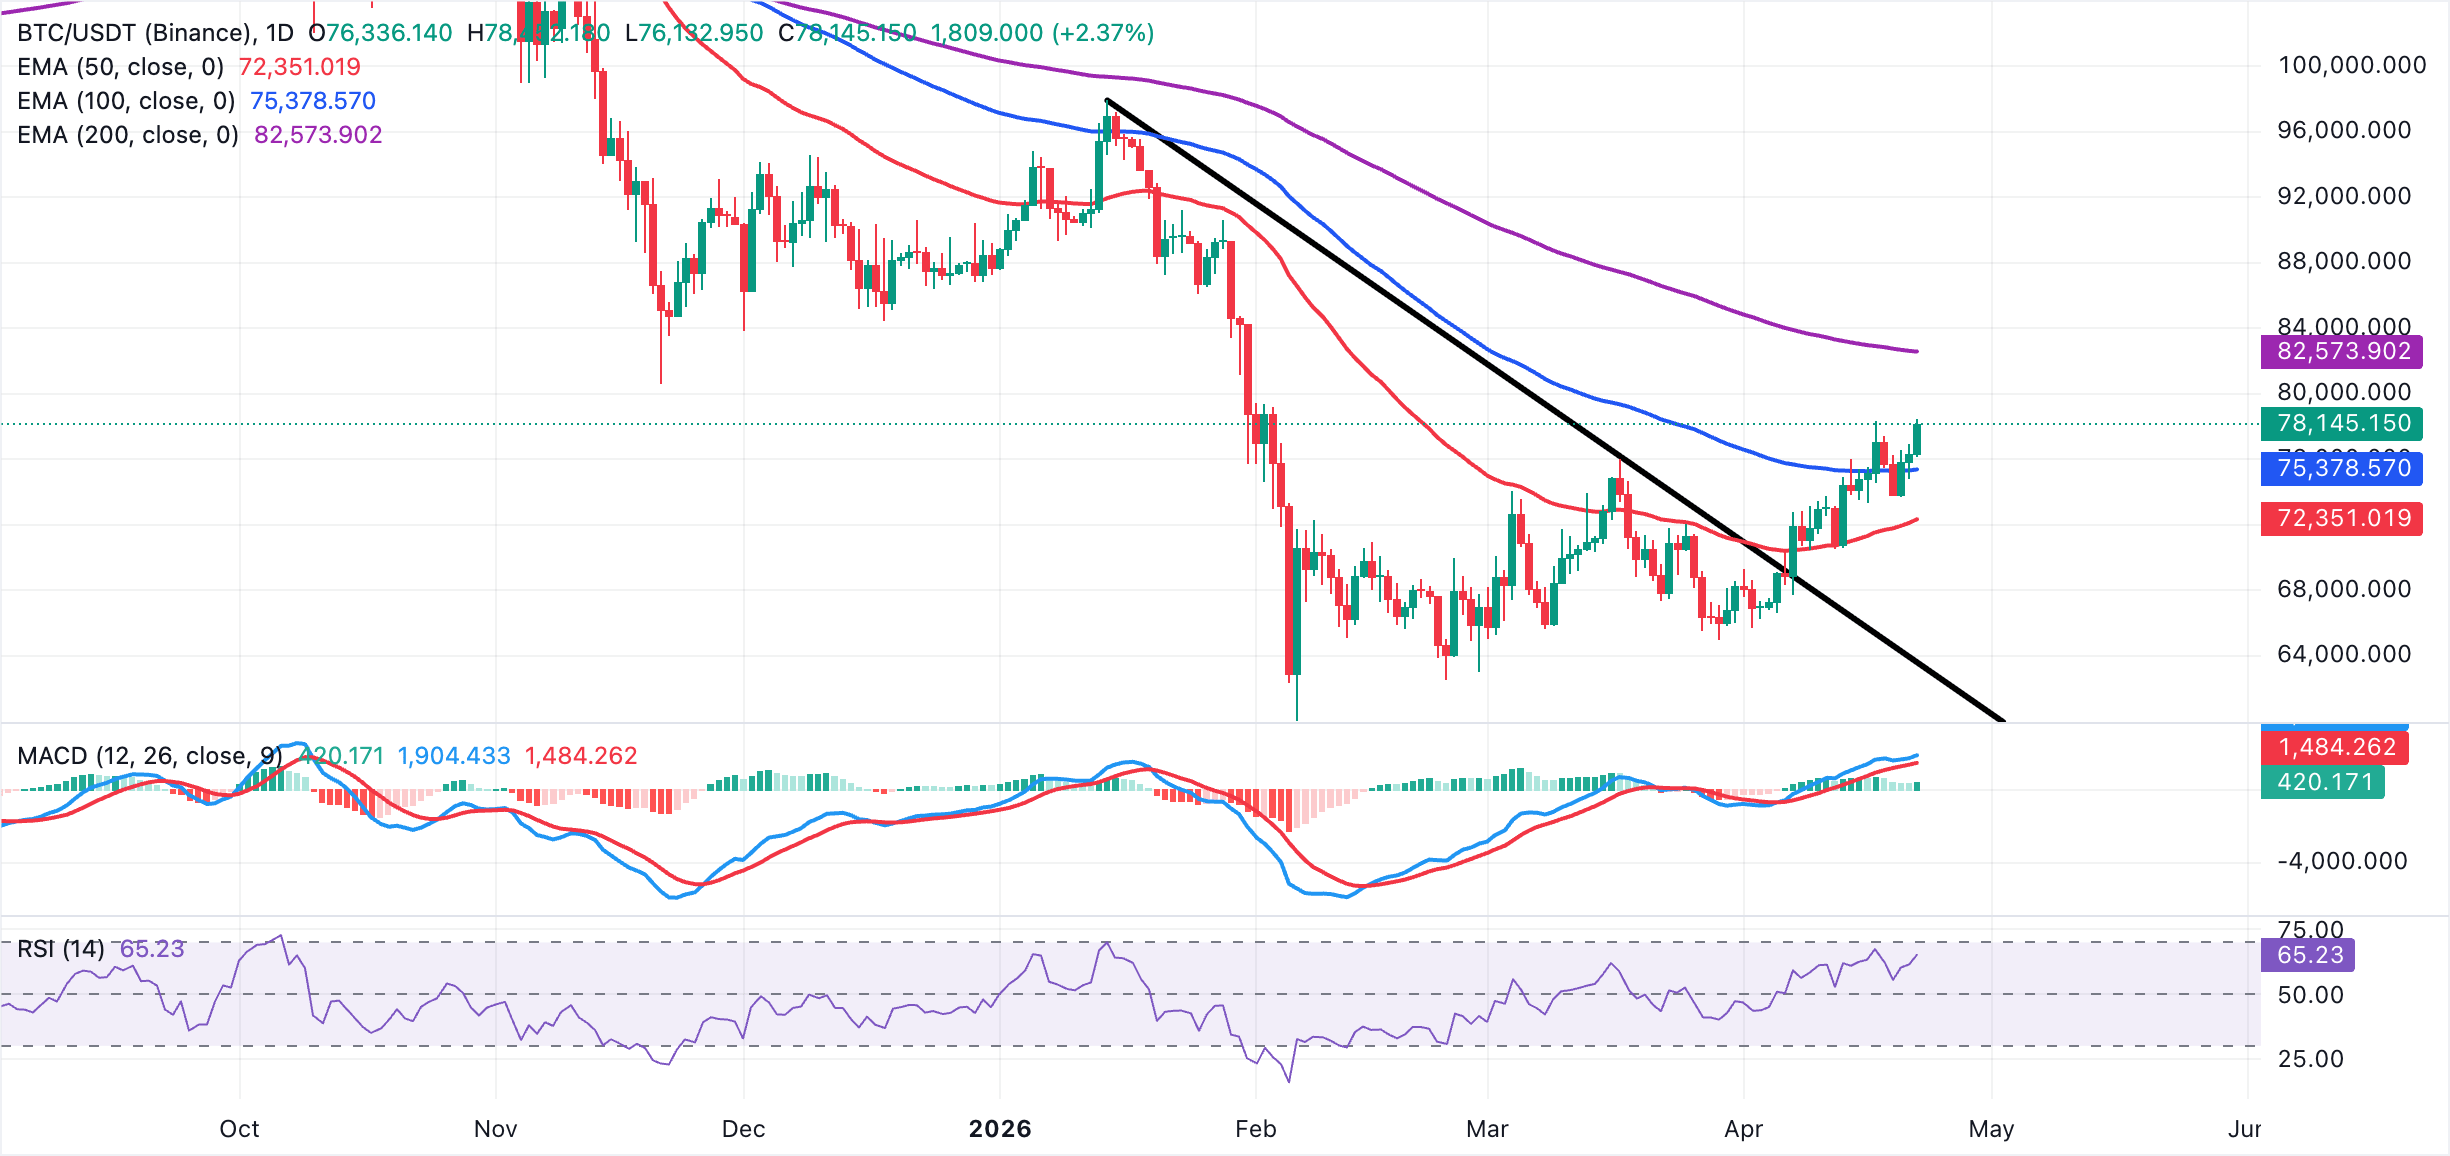
On the topside, initial resistance is defined by the psychological resistance at $80,000, followed by the 200-day EMA at $82,574, which represents the next meaningful obstacle for buyers and a potential profit-taking zone if tested. On the downside, immediate support emerges at the 100-day EMA near $75,379, with the 50-day EMA at $72,351 providing a deeper layer of trend support. A daily close below these moving averages would weaken the current bullish structure and expose a broader corrective phase.
Altcoins technical outlook: Ethereum and XRP retain recovery momentum
Ethereum trades at $2,387, maintaining a bullish near-term bias as price holds above the 50-day and 100-day EMAs at roughly $2,223 and $2,355, and well beyond the broken downward resistance trendline around $2,153. Momentum conditions support the constructive tone, with the RSI hovering near 60 on the daily chart and the MACD histogram slightly positive, suggesting buyers still have the upper hand.
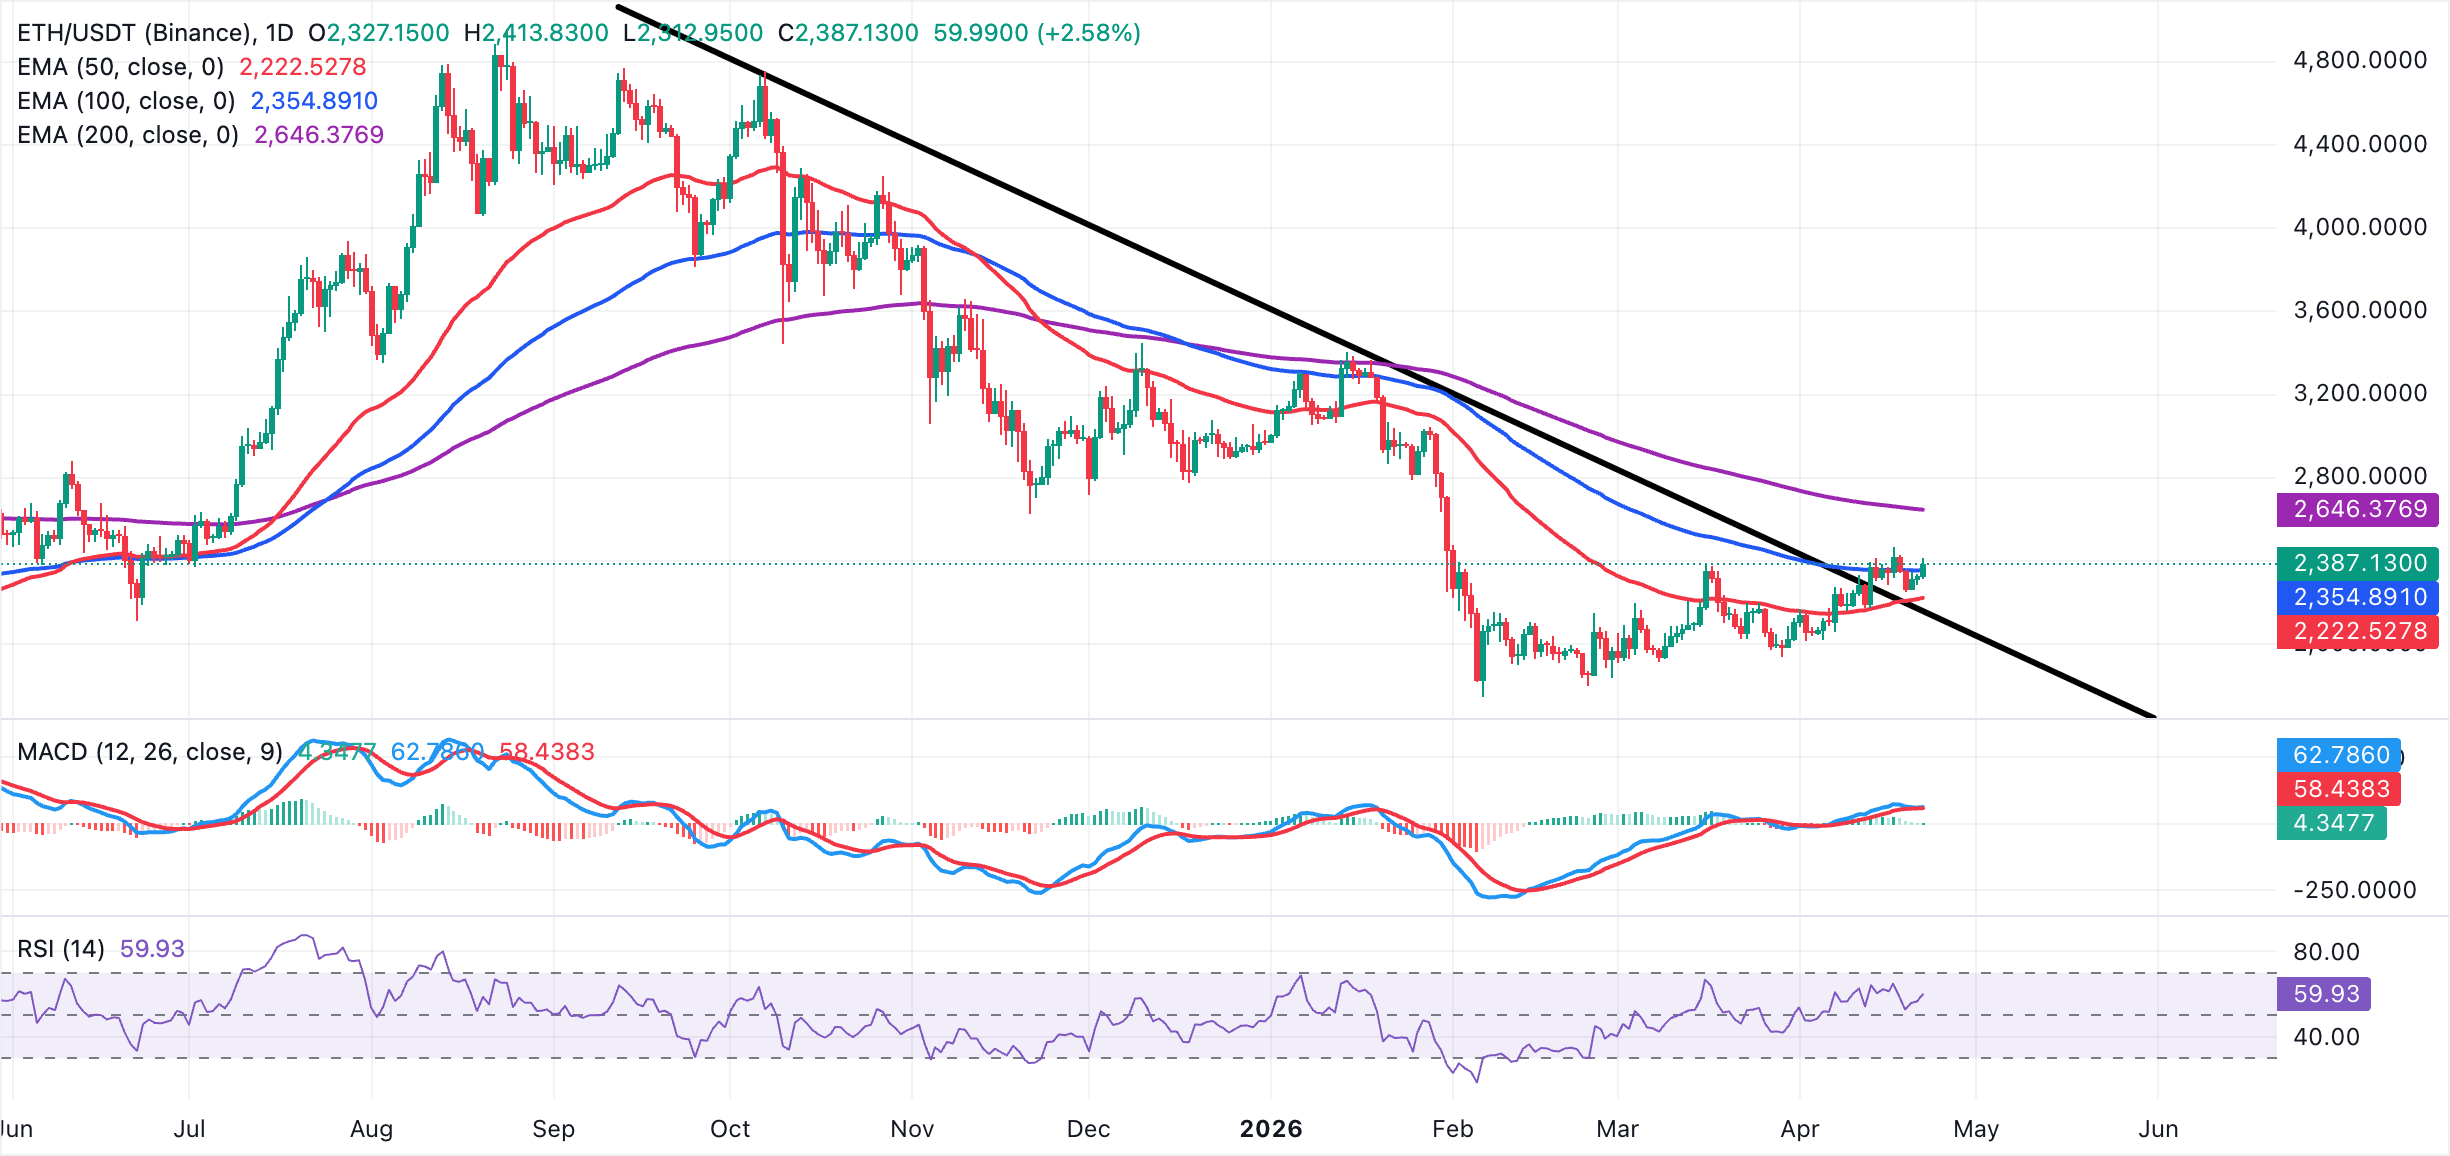
On the topside, the next notable hurdle is last week's peak at $2,465, followed by the 200-day EMA at $2,646, where medium-term sellers could attempt to reassert control. On the downside, immediate support is seen first at the 100-day EMA near $2,355, followed by the 50-day EMA around $2,223. A deeper pullback toward the former downtrend break area at $2,153 would likely attract fresh dip-buying while that zone holds.
On the other hand, XRP trades at $1.45, holding above the 50-day EMA at $1.41. Still, the remittance token remains capped by the higher 100-day EMA at $1.54 and the 200-day EMA at $1.78, keeping the broader bias tilted to the bearish side despite the recent bounce.
Notably, the MACD histogram remains in positive territory on the daily chart, while the RSI is near 59, suggesting improving bullish pressure but not yet overbought.
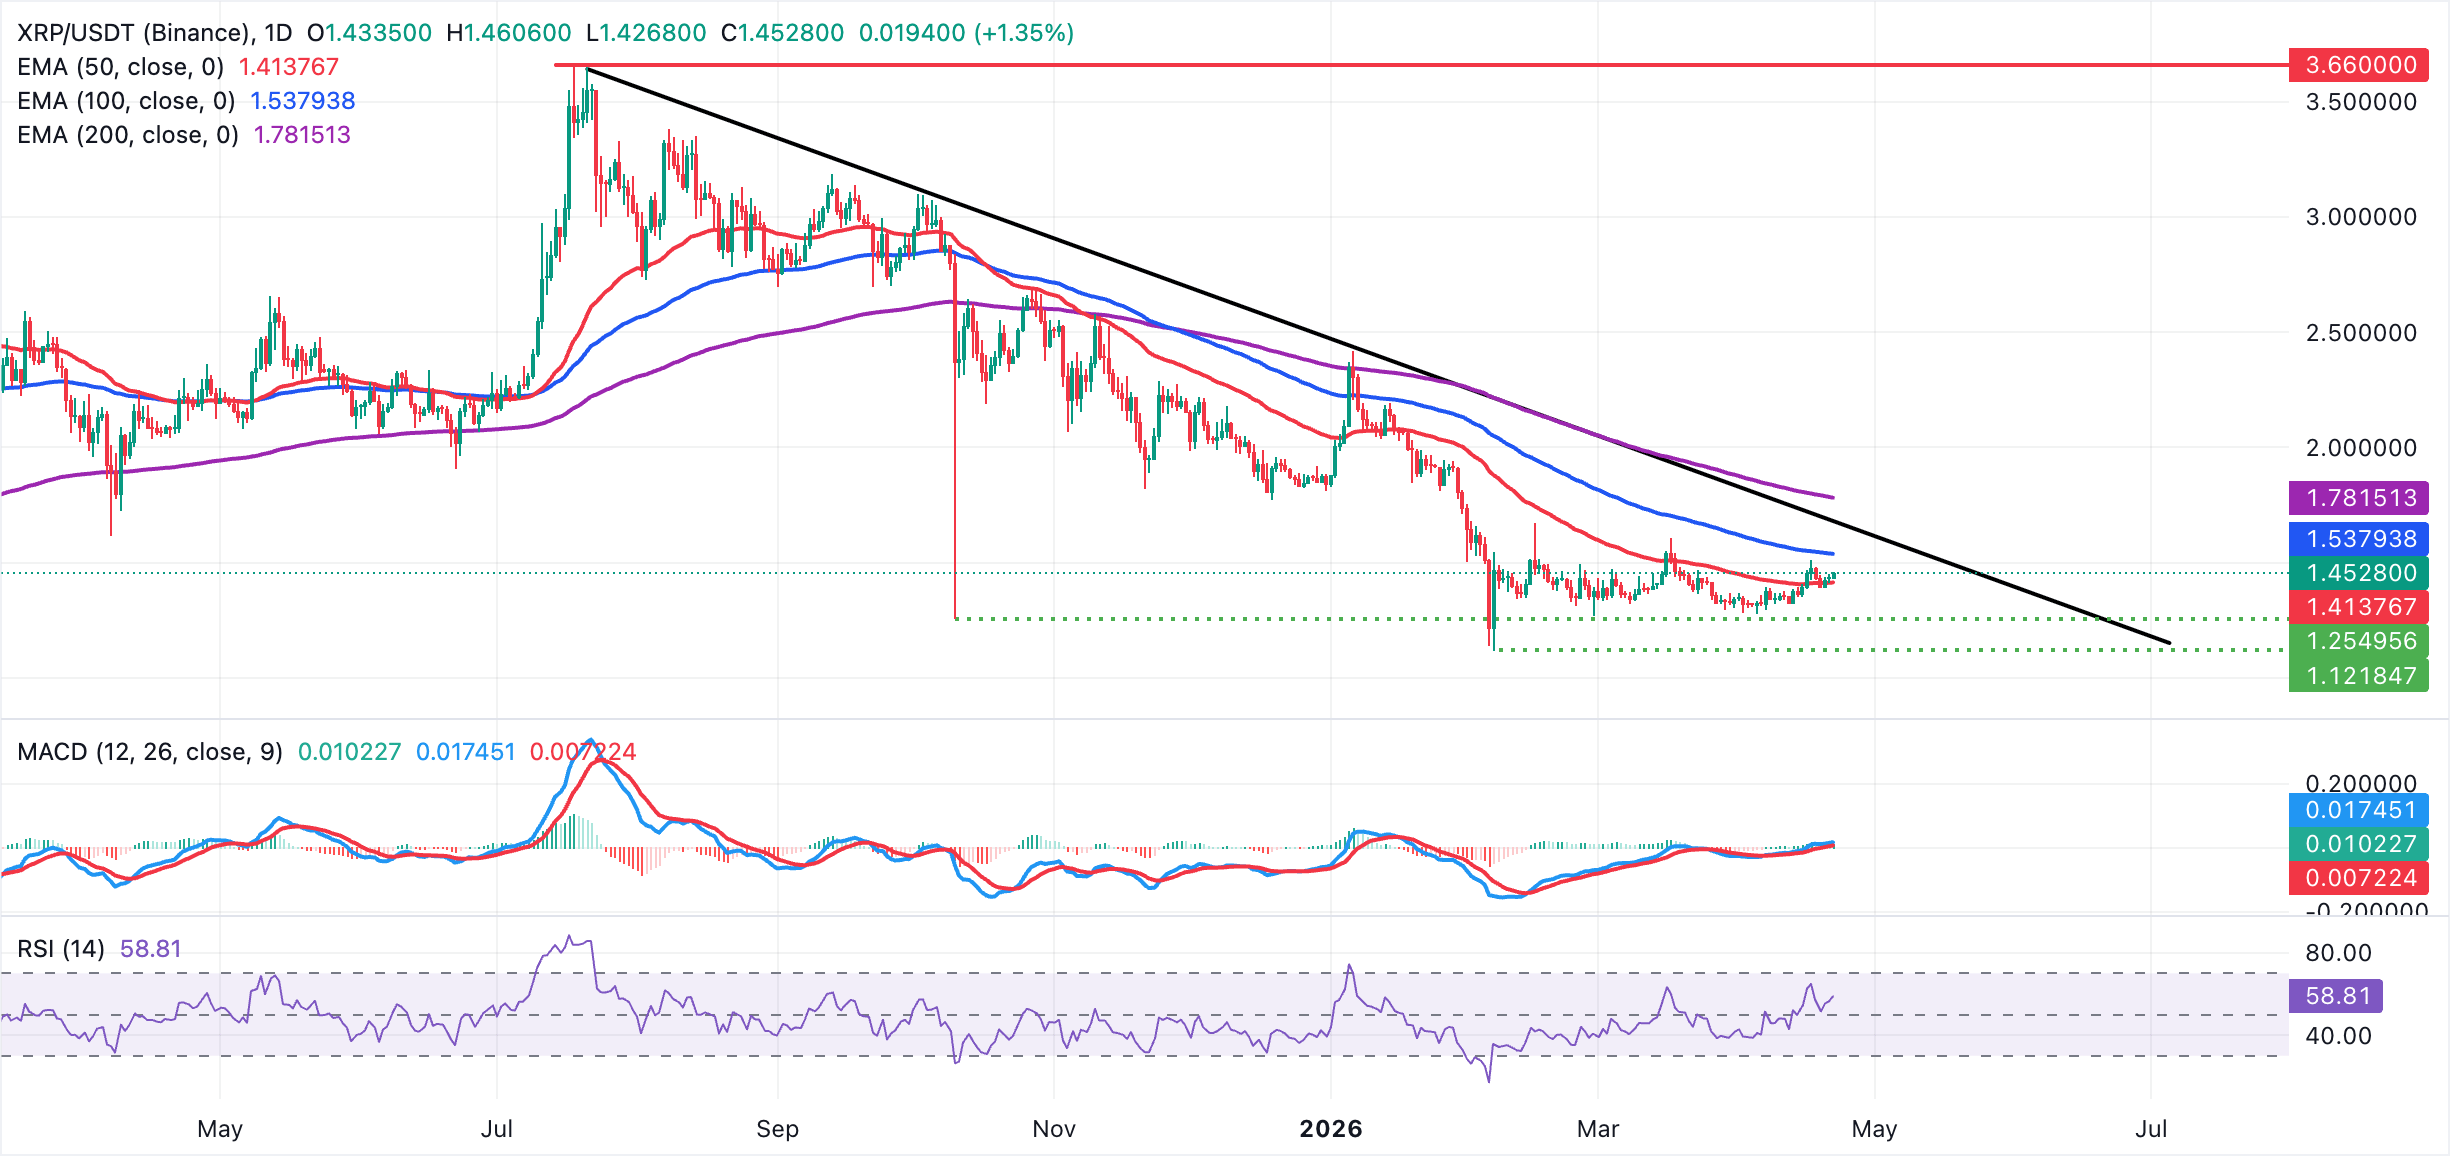
On the topside, initial resistance emerges at the 100-day EMA around $1.54, with a stronger barrier further up at the 200-day EMA roughly at $1.78, where the longer-term downtrend remains intact. On the downside, immediate support lies at the 50-day EMA around $1.41. A decisive drop back below this level would expose a deeper retracement and signal that the latest recovery is losing traction.
(The technical analysis of this story was written with the help of an AI tool.)
Bitcoin, altcoins, stablecoins FAQs
Bitcoin is the largest cryptocurrency by market capitalization, a virtual currency designed to serve as money. This form of payment cannot be controlled by any one person, group, or entity, which eliminates the need for third-party participation during financial transactions.
Altcoins are any cryptocurrency apart from Bitcoin, but some also regard Ethereum as a non-altcoin because it is from these two cryptocurrencies that forking happens. If this is true, then Litecoin is the first altcoin, forked from the Bitcoin protocol and, therefore, an “improved” version of it.
Stablecoins are cryptocurrencies designed to have a stable price, with their value backed by a reserve of the asset it represents. To achieve this, the value of any one stablecoin is pegged to a commodity or financial instrument, such as the US Dollar (USD), with its supply regulated by an algorithm or demand. The main goal of stablecoins is to provide an on/off-ramp for investors willing to trade and invest in cryptocurrencies. Stablecoins also allow investors to store value since cryptocurrencies, in general, are subject to volatility.
Bitcoin dominance is the ratio of Bitcoin's market capitalization to the total market capitalization of all cryptocurrencies combined. It provides a clear picture of Bitcoin’s interest among investors. A high BTC dominance typically happens before and during a bull run, in which investors resort to investing in relatively stable and high market capitalization cryptocurrency like Bitcoin. A drop in BTC dominance usually means that investors are moving their capital and/or profits to altcoins in a quest for higher returns, which usually triggers an explosion of altcoin rallies.

ผู้ใช้กว่าหนึ่งล้านคนพึ่งพา FXStreet สำหรับข้อมูลตลาดเรียลไทม์ เครื่องมือกราฟ การวิเคราะห์จากผู้เชี่ยวชาญ และข่าวฟอเร็กซ์ ปฏิทินเศรษฐกิจที่ครอบคลุมและเว็บบินาร์การศึกษาช่วยให้เทรดเดอร์ทันเหตุการณ์และตัดสินใจอย่างรอบคอบ FXStreet มีทีมงานประมาณ 60 คน แบ่งระหว่างสำนักงานใหญ่บาร์เซโลนาและภูมิภาคต่าง ๆ ทั่วโลก
อ่านเพิ่มเติม


