
Crypto Today: Bitcoin, Ethereum, XRP sustain mild gains despite extreme fear
โดย John Isige
อัปเดตแล้ว: 1 Apr 2026


บทความยอดนิยม

The cryptocurrency market remains on edge on Wednesday despite minor price increases across the board amid significantly depressed sentiment driven by the Iran war.
- Bitcoin ticks up above $68,000, rising for the third consecutive day despite war-driven extreme fear sentiment.
- Ethereum extends its rebound above $2,100, supported by growing interest in US-listed spot ETFs.
- XRP bulls are tightening their grip on Wednesday, with the price lifting above $1.35 amid muted ETF activity.
The cryptocurrency market remains on edge on Wednesday despite minor price increases across the board amid significantly depressed sentiment driven by the Iran war.
Bitcoin (BTC) mirrors a neutral-to-bullish outlook, rising above $68,000 at the time of writing, while Ethereum (ETH) follows suit, steadying above $2,100. Meanwhile, Ripple (XRP) shows subtle signs of a rebound, trending above $1.35 despite muted institutional interest in related digital investment products.
Bitcoin, Ethereum and XRP tick up amid depressed sentiment
The United States (US) and Israel’s war with Iran, which is now in its second month, has continued to weigh on crypto assets as recovery attempts are quickly absorbed, leading to frequent pullbacks.
Sentiment, as reflected in the Fear & Greed Index, which shows a reading of 8 on Wednesday, has remained in extreme fear territory since March 19. There was a brief spike to 28 on March 17, but the index retreated, signaling that the broader crypto market sentiment remains weak.
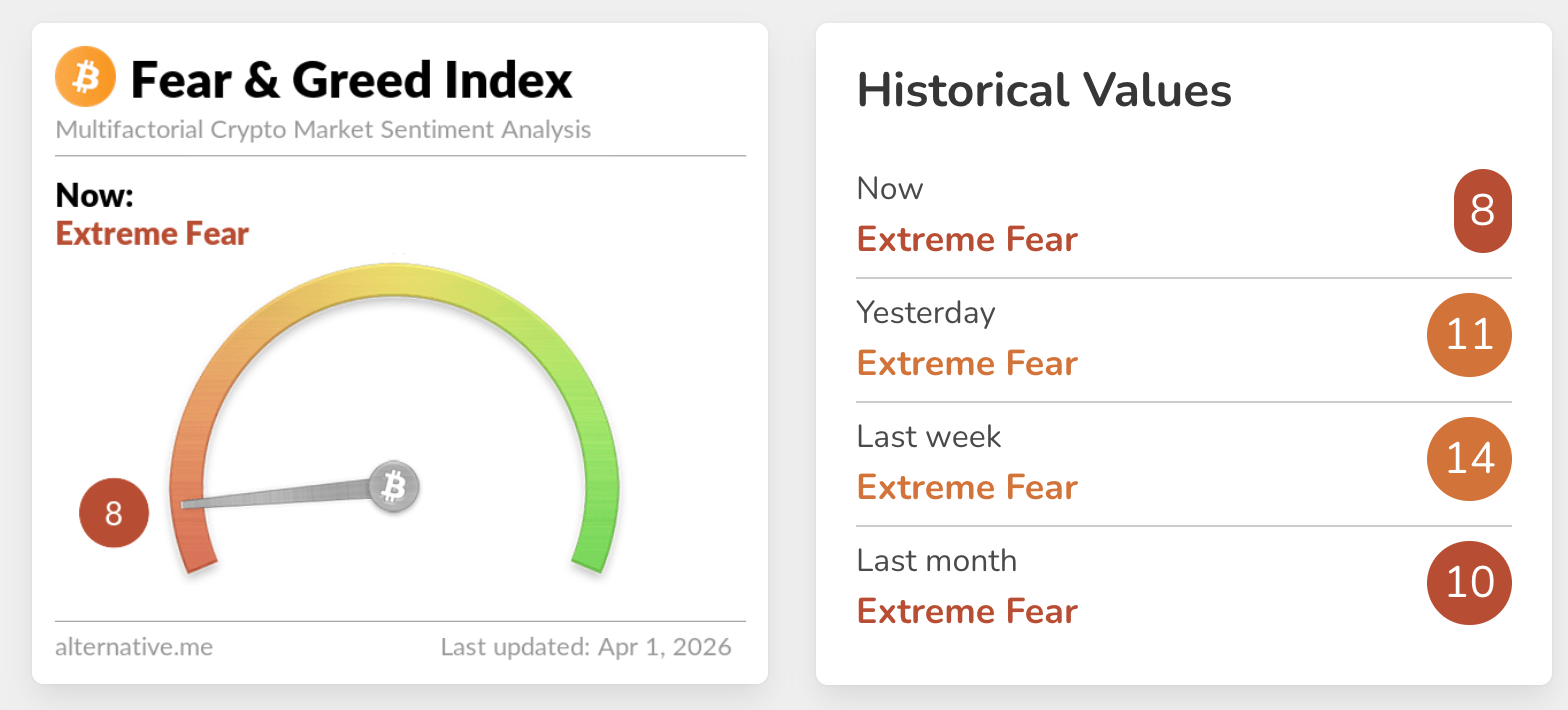
The war in the Middle East, macroeconomic uncertainty and the overall bearish sentiment are among the factors contributing to weak market sentiment. If these conditions fail to improve, recoveries may quickly be snuffed out with pullbacks taking center stage.
Inflows favor Bitcoin and Ethereum ETFs
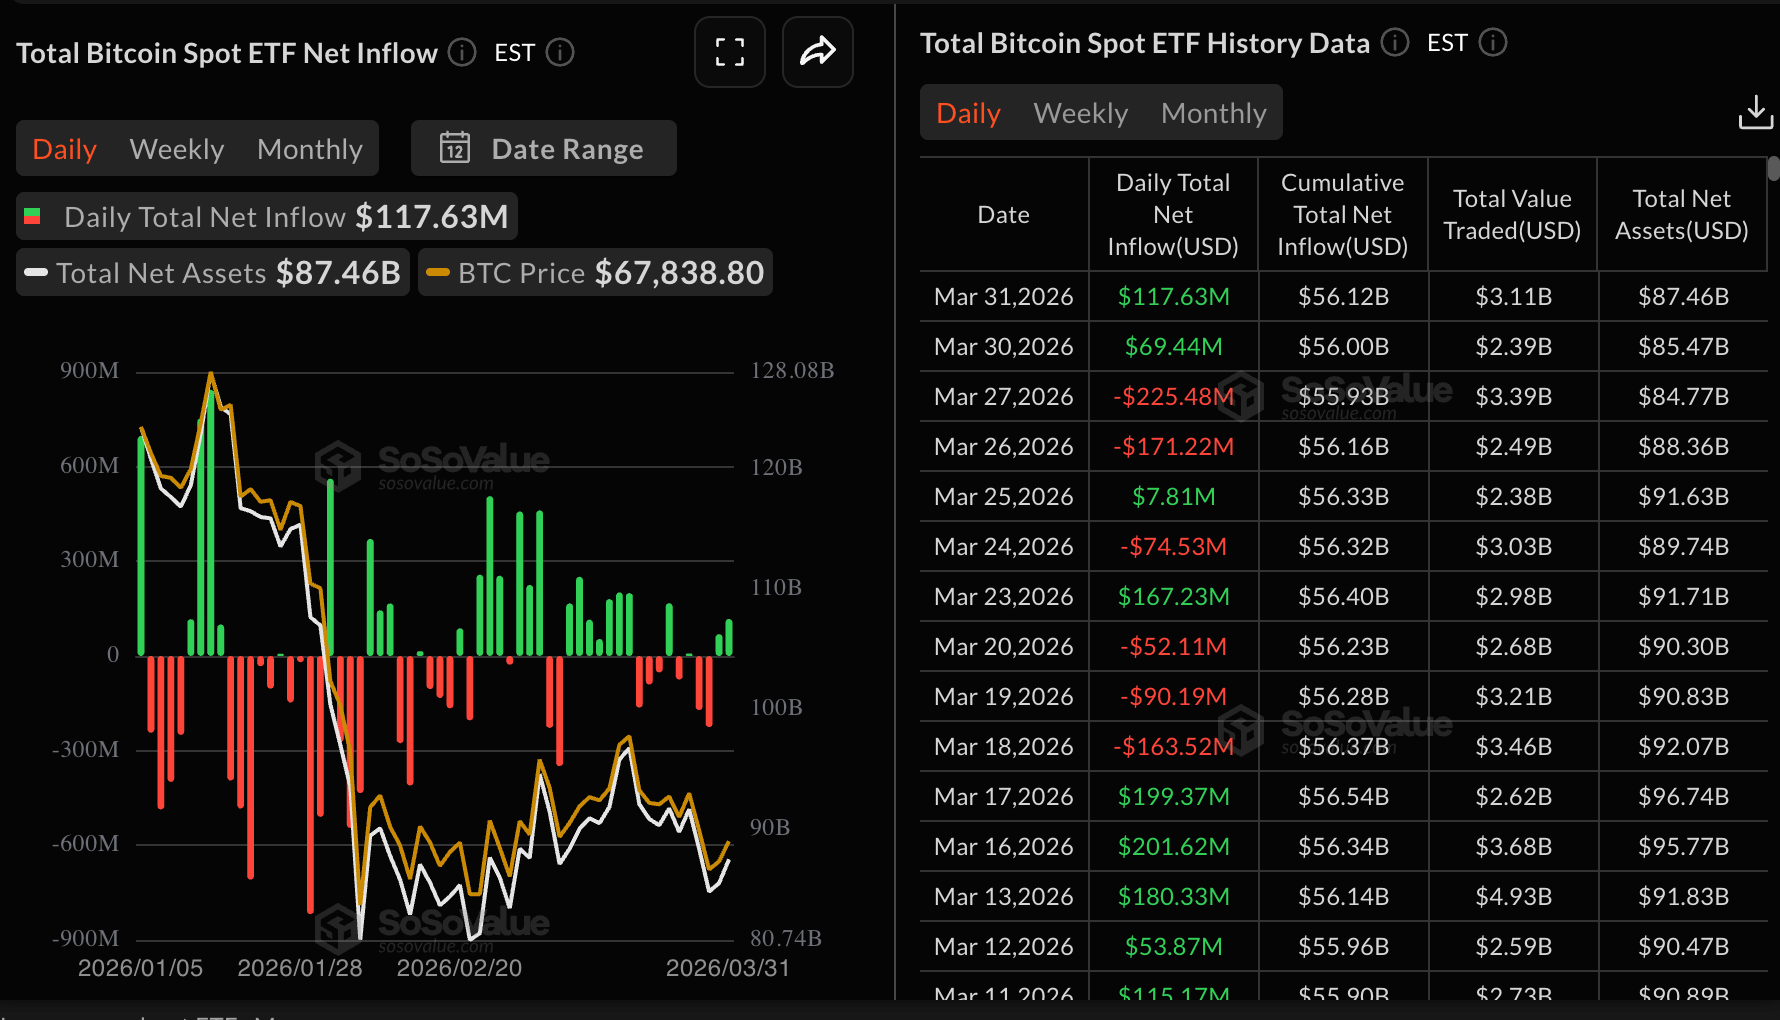
Interest in Bitcoin spot Exchange-Traded Funds (ETFs) remained steady with nearly $118 million in inflows recorded on Tuesday, up from roughly $69 million on Monday.
The turnaround in US-listed BTC ETFs has seen cumulative inflows average $56.12 billion, with net assets under management at $87.46 billion. If inflows remain steady this week, sentiment around Bitcoin could improve and back a sustained price recovery.
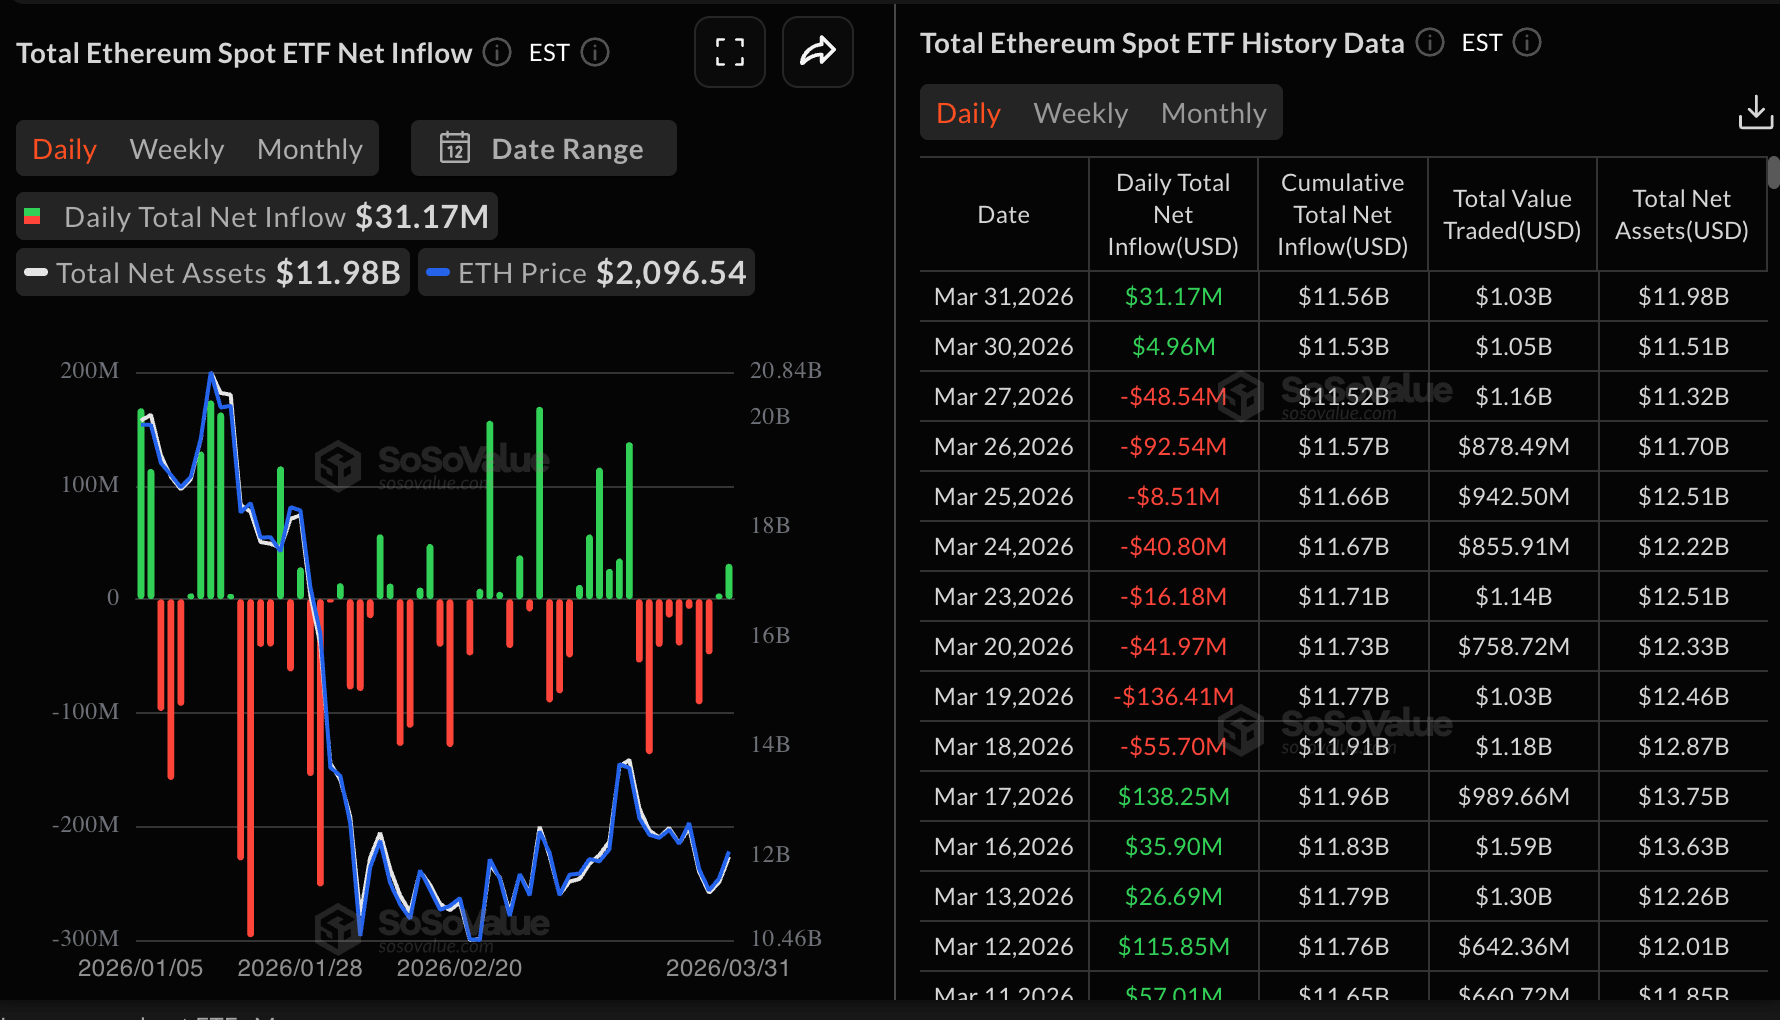
Ethereum similarly recorded inflows of roughly $31 million on Tuesday, from nearly $5 million on Monday. SoSoValue data shows cumulative inflows totaling $11.56 billion, while net assets average $11.98 billion.
Meanwhile, institutional demand for XRP digital investment products has dropped significantly over the last few weeks, as evidenced by muted spot ETF activity on Tuesday. Moreover, outflows totaling $2.3 million were recorded on Monday, undermining investor interest.
Cumulative inflows have steadied at $1.21 billion, while net assets under management have dropped to around $944 million, from the record $1.65 billion on January 1.
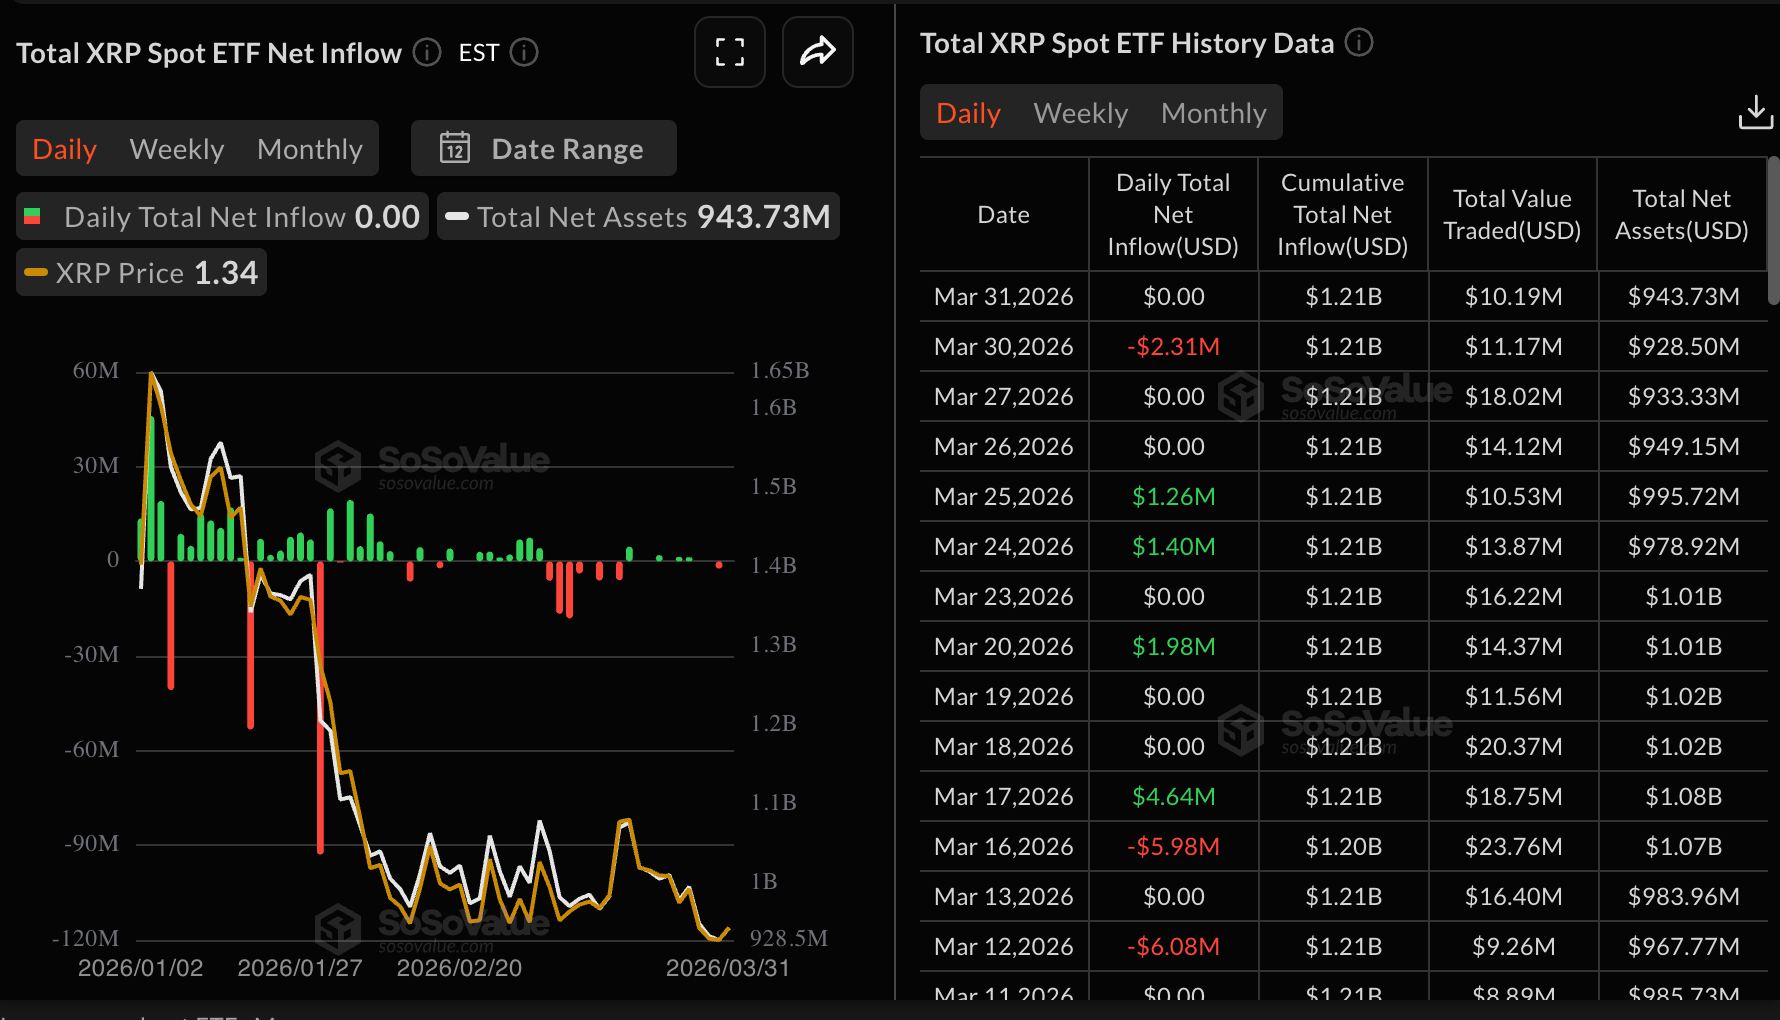
Chart of the day: Bitcoin holds steady above support
Bitcoin is trading at $68,574 amid a neutral bias, with a slight bearish tilt, as spot holds below the descending resistance line, which now caps the upside near $73,900. The price also sits below the 50-day Exponential Moving Average (EMA), while remaining well above the 100-day and 200-day EMAs, outlining a medium-term uptrend under short-term pressure.
Meanwhile, the Moving Average Convergence Divergence (MACD) indicator on the daily chart is below the signal line, with a modestly negative histogram, suggesting fading bullish momentum and reinforcing the consolidative tone. The Relative Strength Index (RSI) near 48 on the same chart stays close to the midline, indicating balanced forces after the recent pullback.
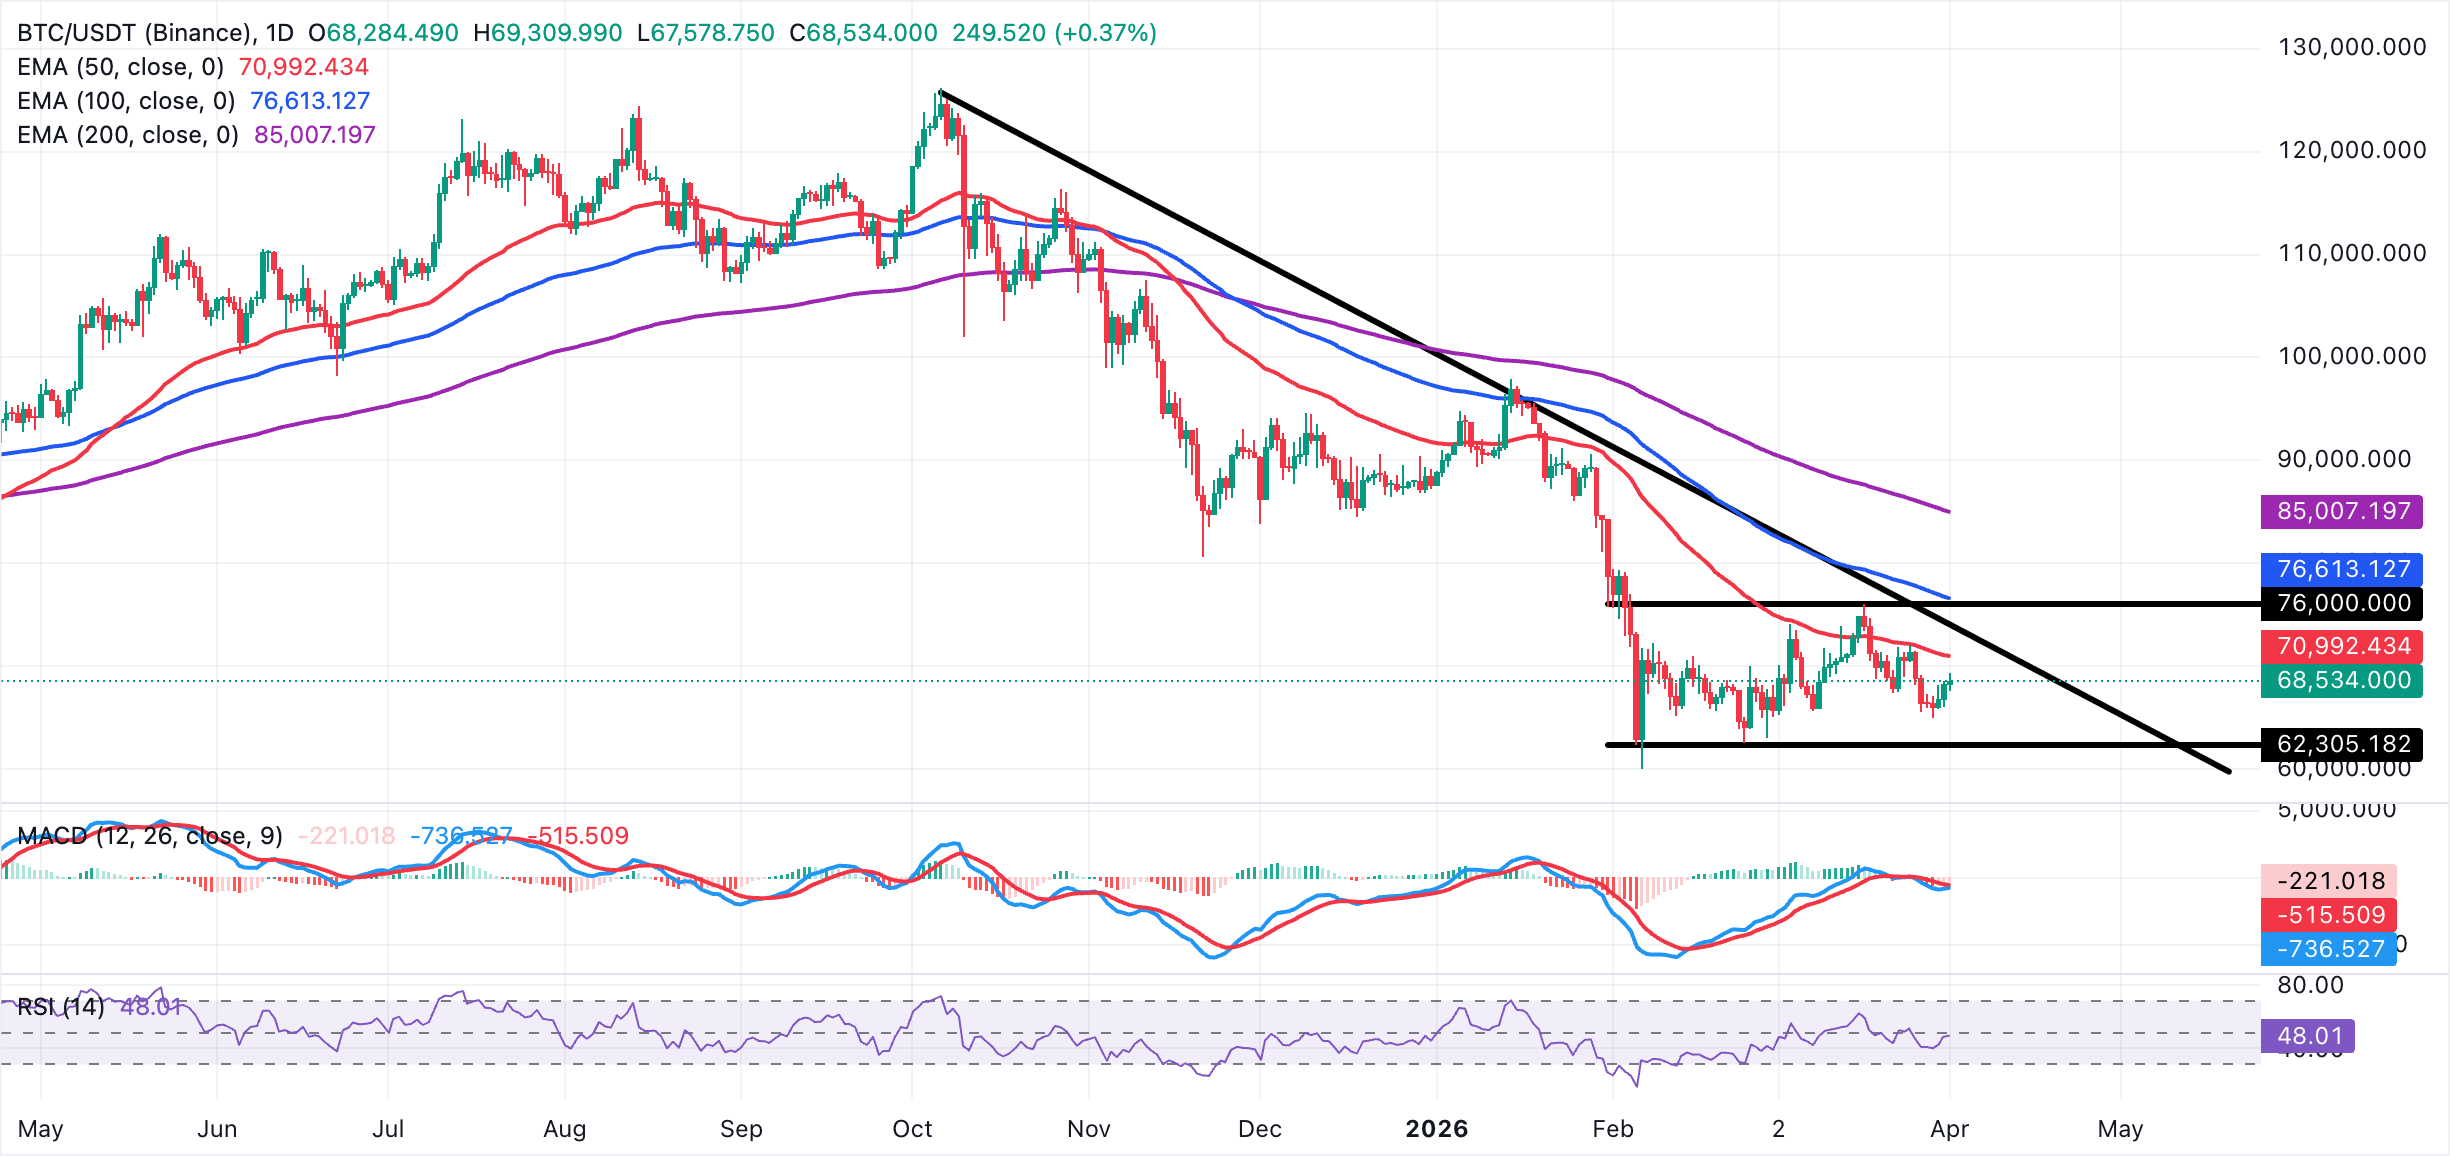
Bitcoin's immediate resistance lies at the 50-day EMA around $71,000, followed by the recent high zone near $72,800 and the descending trendline break area at $73,900. A daily close above that cluster would reopen the path toward the March high of $76,000. On the downside, initial support is seen around $68,000, ahead of the late-March lows near $65,000. A break below $65,000 would expose deeper retracement toward the yearly low at $60,000.
Altcoins technical update: Ethereum and XRP extend gains
Ethereum is trading above $2,100 at the time of writing on Wednesday. Its near-term bias is mildly bullish as price holds above the rising support trendline that originates near $1,745, keeping the broader recovery structure intact despite recent consolidation. The 50-day EMA around $2,160 flattens just above spot, capping immediate upside for now, while the 100-day and 200-day EMAs are well above $2,400 and $2,700, respectively, and still reflect a longer-term corrective backdrop.
The MACD indicator rises toward the zero line as histogram bars contract on the daily chart, suggesting fading downside momentum rather than aggressive selling. The RSI at 53, around neutral territory on the same chart, supports a range-to-upward bias.
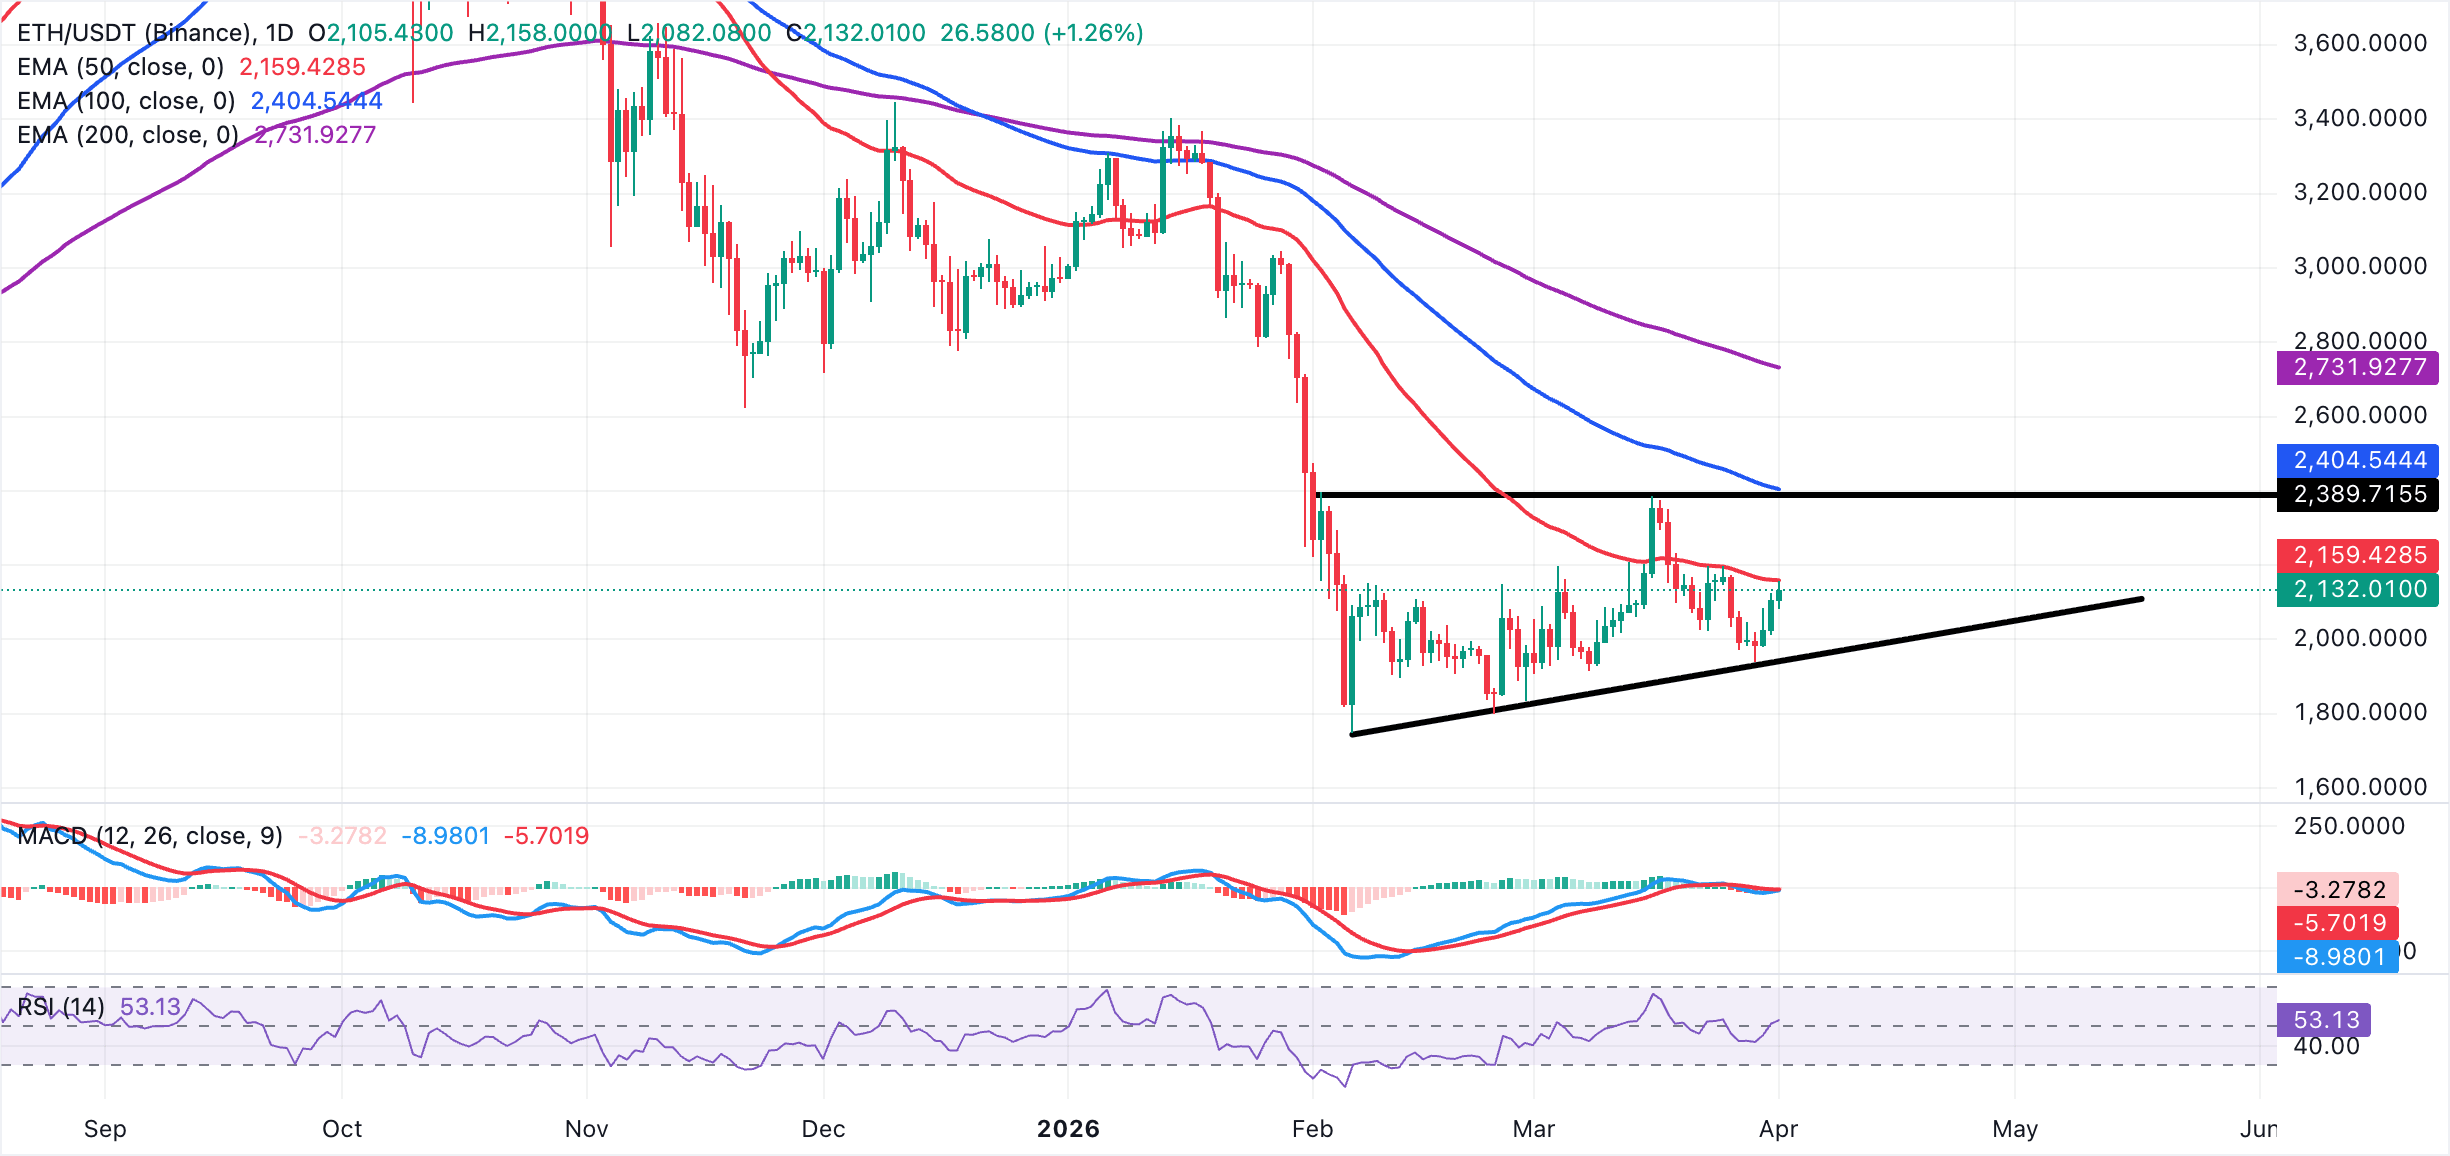
Ethereum's initial resistance sits at the 50-day EMA near $2,160, followed by the recent swing zone at $2,200 and then the mid-March high around $2,386. A clear daily close above $2,200 would open the way for a retest of $2,386, where previous supply aligns with the broader corrective trend context. On the downside, immediate support is seen at $2,050, ahead of the rising trendline area around $1,950, which is the key level to maintain the current bullish bias. A sustained break below $1,950 would expose further weakness toward $1,900 and shift the focus back to a deeper corrective phase.
As for XRP, the price holds above $1.35, with a near-term bias mildly bearish as it sits below the downward-sloping trendline. The latest rejection occurred near $1.44 and remains capped by the 50-day, 100-day, and 200-day EMAs, which are clustered between $1.45 and $1.90.
The MACD indicator remains below its signal line and has slipped below the zero line on the daily chart, while the negative histogram bars widen, suggesting strengthening bearish momentum. At the same time, RSI at 44 on the same chart points to sub-50 momentum and aligns with fading buying pressure rather than outright oversold conditions.
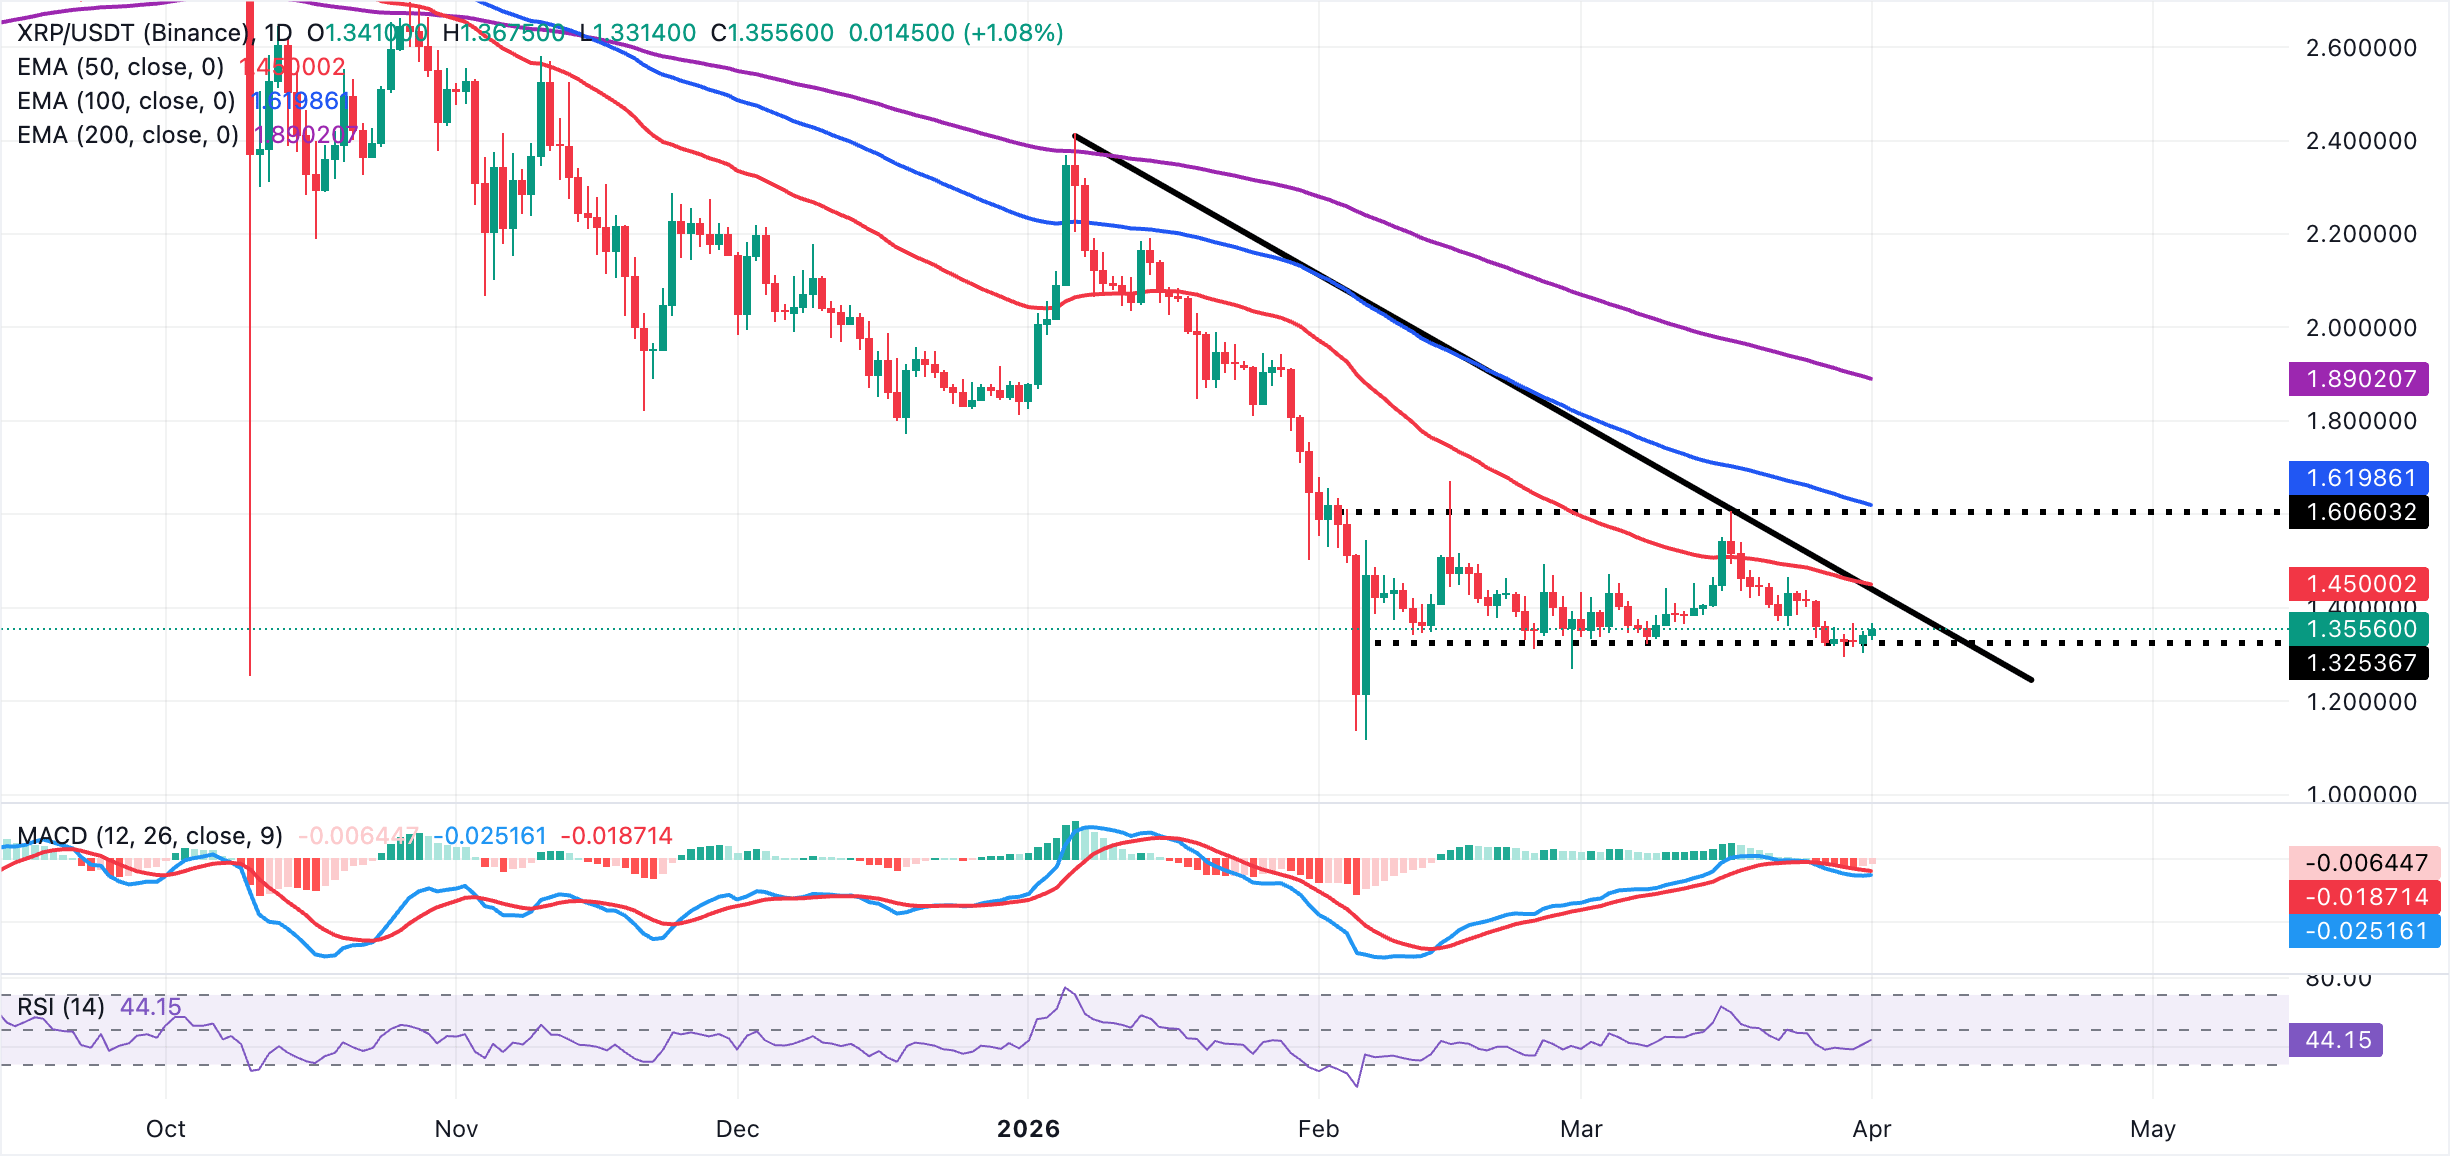
Bitcoin's immediate resistance is seen around $1.40, where recent highs converge ahead of the descending trendline break level at $1.44. A daily close above this zone is needed to ease downside pressure and expose the $1.51 area next. On the downside, initial support comes at $1.33, followed by last week’s low near $1.30. A break there would open the way toward $1.25. As long as XRP trades below $1.44, rallies are vulnerable to selling interest, while a sustained move above that level would be required to shift the bias toward a more constructive recovery phase.
Crypto ETF FAQs
An Exchange-Traded Fund (ETF) is an investment vehicle or an index that tracks the price of an underlying asset. ETFs can not only track a single asset, but a group of assets and sectors. For example, a Bitcoin ETF tracks Bitcoin’s price. ETF is a tool used by investors to gain exposure to a certain asset.
Yes. The first Bitcoin futures ETF in the US was approved by the US Securities & Exchange Commission in October 2021. A total of seven Bitcoin futures ETFs have been approved, with more than 20 still waiting for the regulator’s permission. The SEC says that the cryptocurrency industry is new and subject to manipulation, which is why it has been delaying crypto-related futures ETFs for the last few years.
Yes. The SEC approved in January 2024 the listing and trading of several Bitcoin spot Exchange-Traded Funds, opening the door to institutional capital and mainstream investors to trade the main crypto currency. The decision was hailed by the industry as a game changer.
The main advantage of crypto ETFs is the possibility of gaining exposure to a cryptocurrency without ownership, reducing the risk and cost of holding the asset. Other pros are a lower learning curve and higher security for investors since ETFs take charge of securing the underlying asset holdings. As for the main drawbacks, the main one is that as an investor you can’t have direct ownership of the asset, or, as they say in crypto, “not your keys, not your coins.” Other disadvantages are higher costs associated with holding crypto since ETFs charge fees for active management. Finally, even though investing in ETFs reduces the risk of holding an asset, price swings in the underlying cryptocurrency are likely to be reflected in the investment vehicle too.
(The technical analysis of this story was written with the help of an AI tool.)

ผู้ใช้กว่าหนึ่งล้านคนพึ่งพา FXStreet สำหรับข้อมูลตลาดเรียลไทม์ เครื่องมือกราฟ การวิเคราะห์จากผู้เชี่ยวชาญ และข่าวฟอเร็กซ์ ปฏิทินเศรษฐกิจที่ครอบคลุมและเว็บบินาร์การศึกษาช่วยให้เทรดเดอร์ทันเหตุการณ์และตัดสินใจอย่างรอบคอบ FXStreet มีทีมงานประมาณ 60 คน แบ่งระหว่างสำนักงานใหญ่บาร์เซโลนาและภูมิภาคต่าง ๆ ทั่วโลก
อ่านเพิ่มเติม


