
Decred Price Prediction: DCR gears up for a breakout amid falling market
โดย Vishal Dixit
วันที่เผยแพร่: 23 Feb 2026 | วันที่แก้ไข: 23 Feb 2026


บทความยอดนิยม

Decred (DCR) extends gains by 5% at press time on Monday for the fifth consecutive day, with bulls challenging a crucial resistance level. The low liquidity of DCR tokens in the market, driven by steady user staking and treasury buildup, fuels upside moves.
- Decred rises 5% on Monday, building on over 6% gains from last week.
- Tight liquidity and steady treasury buildup cap downside risk and boost upside moves.
- The technical outlook focuses on the crucial resistance with bulls aiming for a breakout rally.
Decred (DCR) extends gains by 5% at press time on Monday for the fifth consecutive day, with bulls challenging a crucial resistance level. The low liquidity of DCR tokens in the market, driven by steady user staking and treasury buildup, fuels upside moves. Technically, Decred is at a crucial crossroads amid rising buying pressure.
Limited supply boosts DCR demand
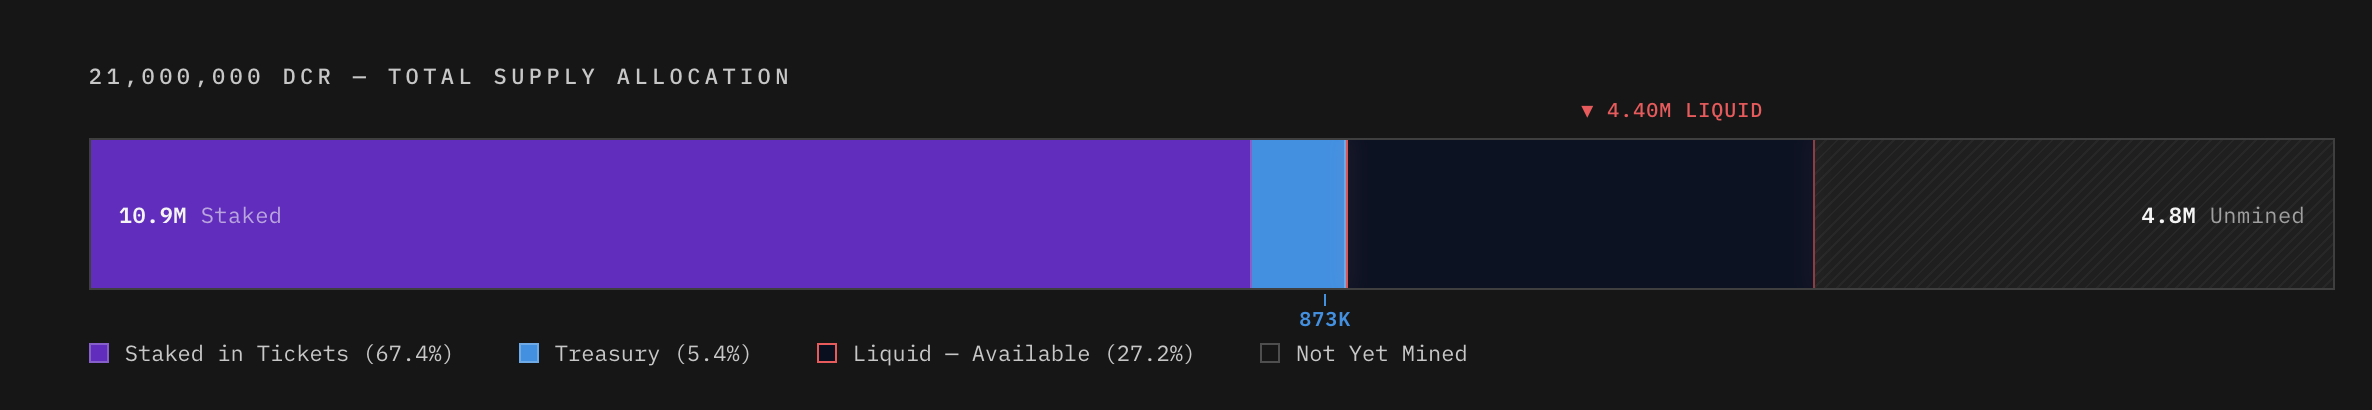
On-chain data shows 10.9 million DCR is staked, representing 67.4% of all mined DCR (16.2 million DCR), and cannot be sold for 142 days. Additionally, the treasury holds over 873,000 DCR tokens, removing 5.4% from the circulating supply, limiting the liquidity to 4.40 million DCR. The limited supply in the market boosts demand for the privacy coin among investors.
Technical outlook: Will Decred extend gains for a breakout rally?
Decred is up 5% at the time of writing on Monday, crossing above the $25.00 level. The short-term recovery tests the 38.2% Fibonacci retracement level at $26.13, measured from the November 4 high at $70 to the December 23 low at $14.21. The crucial resistance has previously capped gains since late November, showcasing intense supply pressure.
A decisive close above this level could target the 50% and 61.8% Fibonacci retracement levels at $31.54 and $38.07, respectively.
The Relative Strength Index (RSI) is at 63 on the daily chart, edging higher, extending its rebound from the halfway line as buying pressure increases. The indicator shows further upside before reaching the overbought zone, suggesting bullish potential. The Moving Average Convergence Divergence (MACD) crosses above its signal line, signaling renewed bullish momentum.

However, a downside reversal from $26.13 could signal renewed downside pressure, opening the door to a retest of the 50-day Exponential Moving Average (EMA) at $21.96.

ผู้ใช้กว่าหนึ่งล้านคนพึ่งพา FXStreet สำหรับข้อมูลตลาดเรียลไทม์ เครื่องมือกราฟ การวิเคราะห์จากผู้เชี่ยวชาญ และข่าวฟอเร็กซ์ ปฏิทินเศรษฐกิจที่ครอบคลุมและเว็บบินาร์การศึกษาช่วยให้เทรดเดอร์ทันเหตุการณ์และตัดสินใจอย่างรอบคอบ FXStreet มีทีมงานประมาณ 60 คน แบ่งระหว่างสำนักงานใหญ่บาร์เซโลนาและภูมิภาคต่าง ๆ ทั่วโลก
อ่านเพิ่มเติม


