
EUR/GBP Price Forecast: Supported by converging SMAs but capped below 0.8750
โดย Vishal Chaturvedi
อัปเดตแล้ว: 6 Apr 2026


บทความยอดนิยม

EUR/GBP trades with a negative bias on Monday as diplomatic efforts to end the US-Iran war lift market sentiment and support risk-sensitive currencies, with the British Pound (GBP) relatively outperforming the Euro (EUR).
- EUR/GBP edges lower as diplomatic efforts to end the US–Iran war lift sentiment and support risk-sensitive currencies.
- GBP shows relative strength against the Euro, keeping the cross under pressure near recent highs.
- Technically, EUR/GBP maintains a mildly bullish bias while holding above key moving averages, with RSI and MACD in positive territory.
EUR/GBP trades with a negative bias on Monday as diplomatic efforts to end the US-Iran war lift market sentiment and support risk-sensitive currencies, with the British Pound (GBP) relatively outperforming the Euro (EUR).
At the time of writing, the cross is trading around 0.8721, though it lacks strong follow-through selling and remains confined near the upper end of last week’s range.
According to Axios, the United States and Iran, along with regional mediators, are discussing a potential 45-day ceasefire that could help end the war. Separately, Reuters reported that both sides have received a proposal for a two-step deal, starting with a ceasefire followed by broader negotiations, which could come into effect as early as Monday and include reopening the Strait of Hormuz.
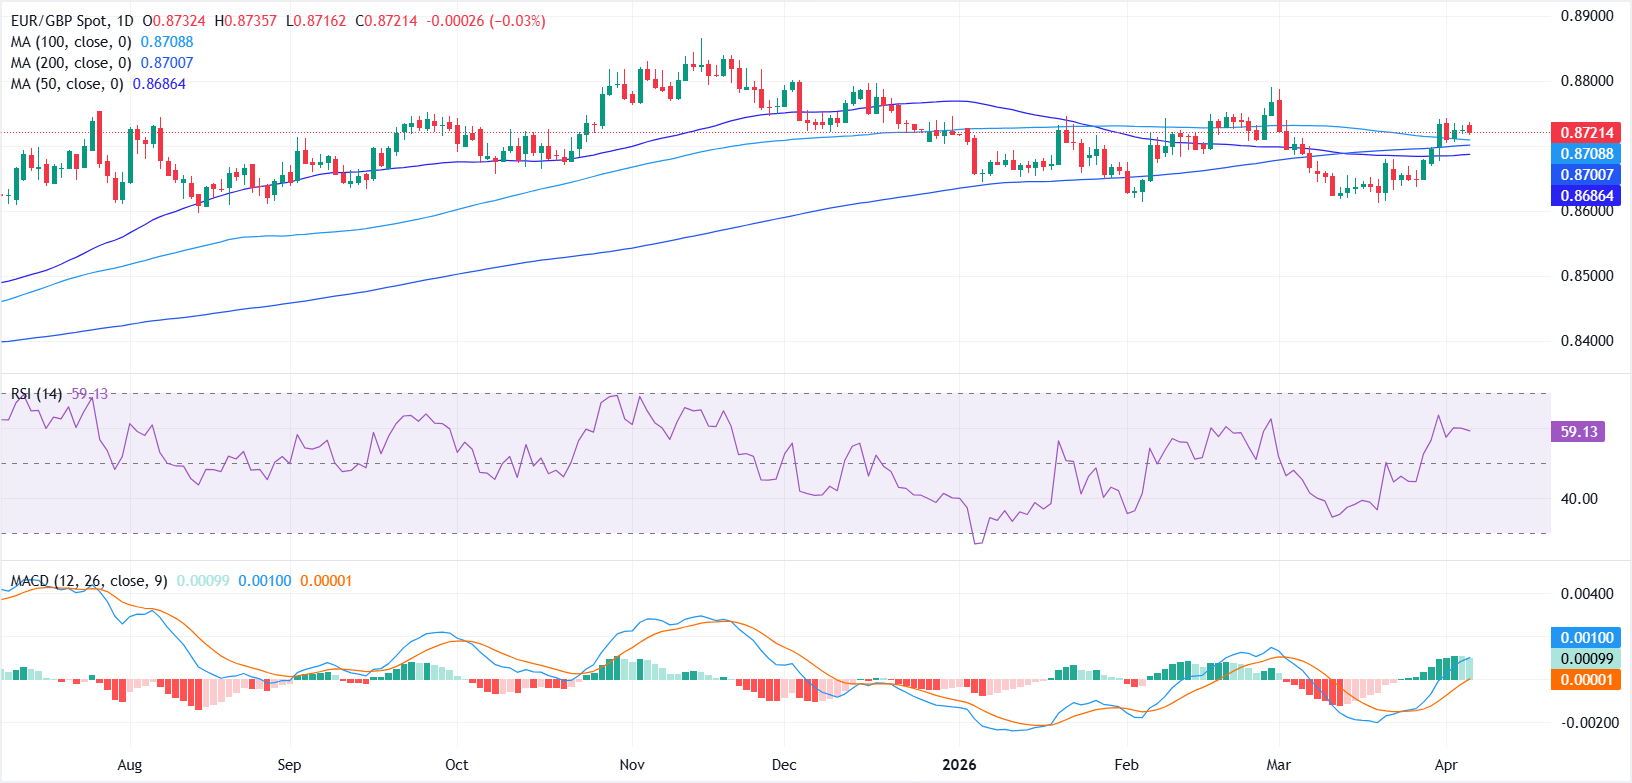
From a technical perspective, EUR/GBP shows a mildly bullish near-term bias as spot holds just above the flat 50-day Simple Moving Average (SMA) near 0.8686, while the 100-day SMA around 0.8709 and the 200-day SMA near 0.8701 converge just below current levels, forming a tentative support cluster that could cap downside attempts.
The Relative Strength Index (RSI) at 59 signals firm but not stretched upside momentum, consistent with a grind higher rather than a sharp breakout. The Moving Average Convergence Divergence (MACD) line stands above the Signal line in marginally positive territory, and the modestly positive histogram reinforces a controlled bullish tone rather than an aggressive trend.
On the upside, immediate resistance is seen at 0.8750, and a break above this level would strengthen the bullish case, opening the door toward the March swing high at 0.8789, close to the 0.8800 psychological mark.
On the downside, initial support is seen in the 0.8686-0.8708 moving average cluster. A break below this zone could weaken the near-term structure and expose the 0.8650 level, with further downside opening toward the 0.8600 psychological mark.

ผู้ใช้กว่าหนึ่งล้านคนพึ่งพา FXStreet สำหรับข้อมูลตลาดเรียลไทม์ เครื่องมือกราฟ การวิเคราะห์จากผู้เชี่ยวชาญ และข่าวฟอเร็กซ์ ปฏิทินเศรษฐกิจที่ครอบคลุมและเว็บบินาร์การศึกษาช่วยให้เทรดเดอร์ทันเหตุการณ์และตัดสินใจอย่างรอบคอบ FXStreet มีทีมงานประมาณ 60 คน แบ่งระหว่างสำนักงานใหญ่บาร์เซโลนาและภูมิภาคต่าง ๆ ทั่วโลก
อ่านเพิ่มเติม


