
EUR/USD Price Forecast: Holds near 1.1800 after pulling back from three-month highs
โดย Akhtar Faruqui
วันที่เผยแพร่: 24 Dec 2025 | วันที่แก้ไข: 24 Dec 2025


บทความยอดนิยม

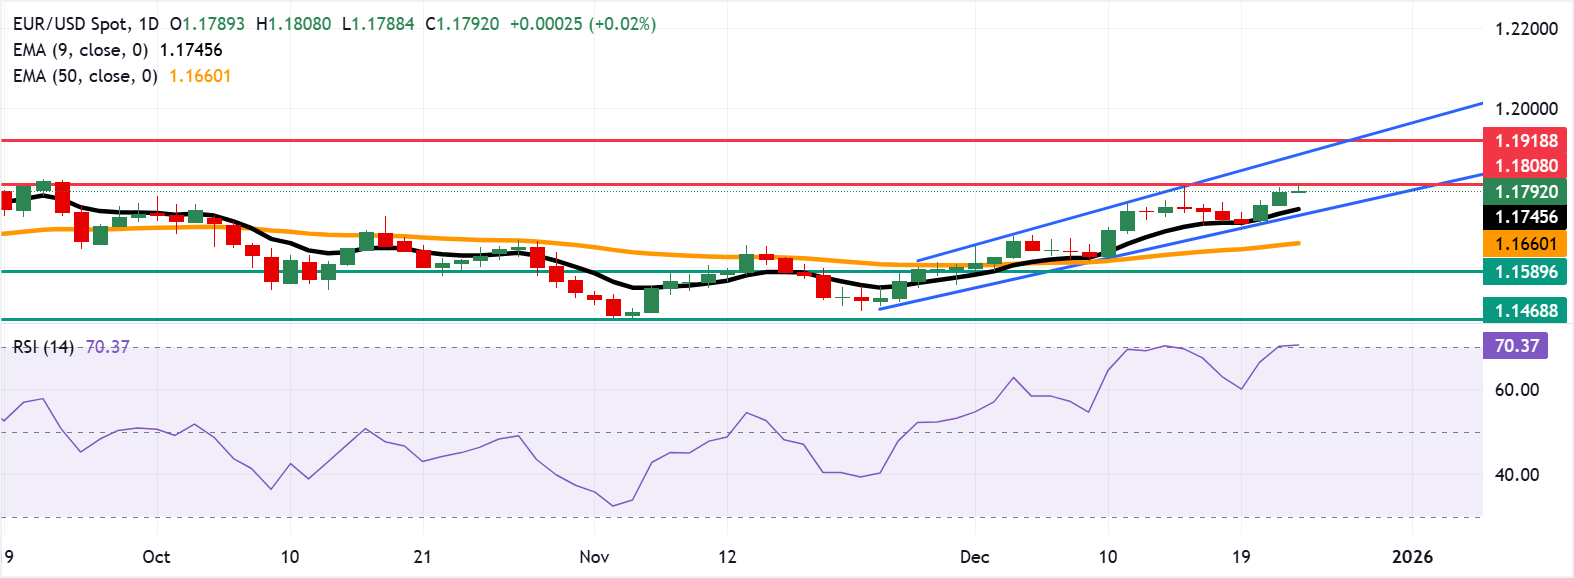
EUR/USD holds gains for the third successive session, trading around 1.1790 during the Asian hours on Wednesday. On the daily chart, technical analysis indicates a persistent bullish bias, as the pair moves upward within the ascending channel pattern.
- EUR/USD hit a three-month high of 1.1808 on Wednesday.
- The 14-day Relative Strength Index sits at 71, signaling overbought conditions that may cap near-term upside.
- The initial support lies at the nine-day EMA of 1.1745.
EUR/USD holds gains for the third successive session, trading around 1.1790 during the Asian hours on Wednesday. On the daily chart, technical analysis indicates a persistent bullish bias, as the pair moves upward within the ascending channel pattern. Additionally, the 14-day Relative Strength Index (RSI) stands at 71 (overbought), which could temper immediate upside as momentum stretches. An RSI overbought status would favor consolidation phases before trend resumption.
The nine-day Exponential Moving Average (EMA) rises above the 50-day EMA, and spot holds north of both, reinforcing a bullish bias. The longer average is turning higher, underscoring improving trend conditions. Short-term momentum remains firm while the positive EMA alignment persists.
The EUR/USD pair tests the psychological level of 1.1800, followed by the three-month high of 1.1808, which was recorded on December 24. A break above this confluence resistance area would open the doors toward the upper boundary of the ascending channel around 1.1880, followed by 1.1918, the highest level since June 2021.
On the downside, the EUR/USD pair could find its immediate support at the nine-day EMA of 1.1745, aligned with the lower ascending channel boundary around 1.1740. A break below the channel would undermine short-term momentum, exposing the pair to a test of the 50-day EMA near 1.1660. Further downside could see prices retest the three-week low at 1.1589, set on December 1.
Euro Price Today
The table below shows the percentage change of Euro (EUR) against listed major currencies today. Euro was the strongest against the US Dollar.
| USD | EUR | GBP | JPY | CAD | AUD | NZD | CHF | |
|---|---|---|---|---|---|---|---|---|
| USD | 0.01% | -0.12% | -0.22% | -0.09% | -0.08% | -0.05% | -0.05% | |
| EUR | -0.01% | -0.14% | -0.22% | -0.10% | -0.09% | -0.06% | -0.06% | |
| GBP | 0.12% | 0.14% | -0.08% | 0.04% | 0.05% | 0.08% | 0.08% | |
| JPY | 0.22% | 0.22% | 0.08% | 0.14% | 0.14% | 0.16% | 0.17% | |
| CAD | 0.09% | 0.10% | -0.04% | -0.14% | -0.00% | 0.02% | 0.04% | |
| AUD | 0.08% | 0.09% | -0.05% | -0.14% | 0.00% | 0.03% | -0.01% | |
| NZD | 0.05% | 0.06% | -0.08% | -0.16% | -0.02% | -0.03% | 0.00% | |
| CHF | 0.05% | 0.06% | -0.08% | -0.17% | -0.04% | 0.00% | -0.00% |
The heat map shows percentage changes of major currencies against each other. The base currency is picked from the left column, while the quote currency is picked from the top row. For example, if you pick the Euro from the left column and move along the horizontal line to the US Dollar, the percentage change displayed in the box will represent EUR (base)/USD (quote).
(The technical analysis of this story was written with the help of an AI tool.)

ผู้ใช้กว่าหนึ่งล้านคนพึ่งพา FXStreet สำหรับข้อมูลตลาดเรียลไทม์ เครื่องมือกราฟ การวิเคราะห์จากผู้เชี่ยวชาญ และข่าวฟอเร็กซ์ ปฏิทินเศรษฐกิจที่ครอบคลุมและเว็บบินาร์การศึกษาช่วยให้เทรดเดอร์ทันเหตุการณ์และตัดสินใจอย่างรอบคอบ FXStreet มีทีมงานประมาณ 60 คน แบ่งระหว่างสำนักงานใหญ่บาร์เซโลนาและภูมิภาคต่าง ๆ ทั่วโลก
อ่านเพิ่มเติม


