
Pi Network Price Forecast: Core team offloads supply, weighing on PI recovery
โดย Vishal Dixit
วันที่เผยแพร่: 2 Mar 2026 | วันที่แก้ไข: 2 Mar 2026


บทความยอดนิยม

Pi Network (PI) hovers below $0.1700, broadly steady at press time on Monday, attempting a recovery after a 2% loss the previous day.
- Pi Network remains below the $0.1700 mark on Monday after a 2% decline the previous day from the 50-day EMA.
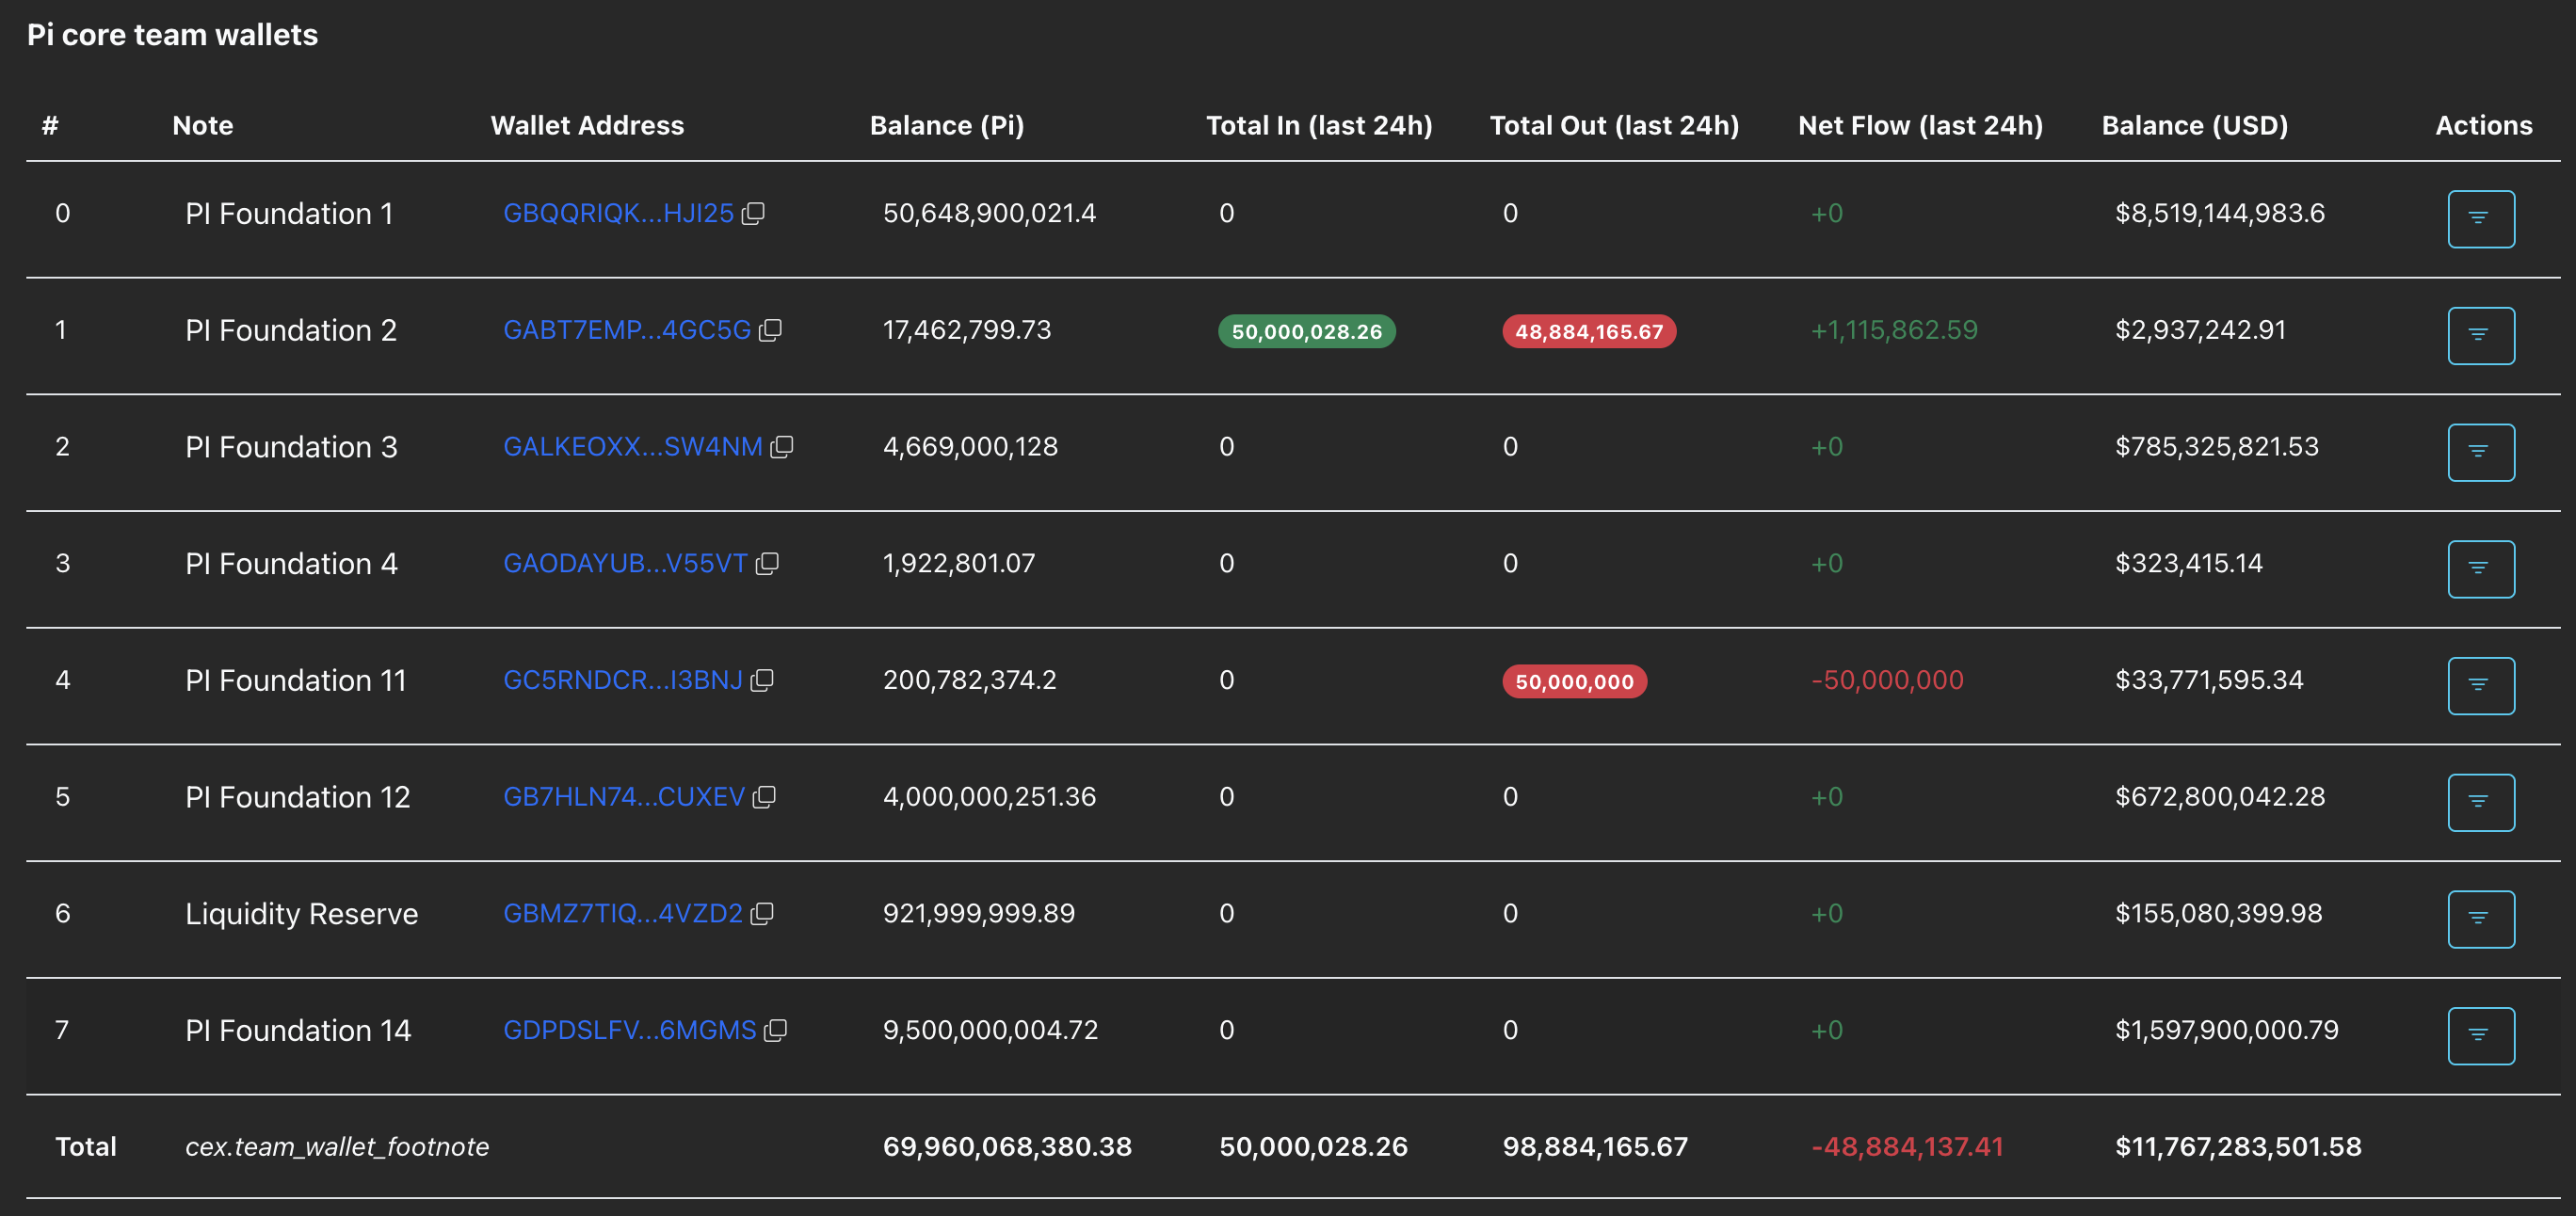
- The Pi Foundation has offloaded nearly 49 million PI tokens over the last 24 hours, boosting the selling pressure.
- The technical outlook for PI remains bearish as the 50-day EMA caps the short-term recovery and momentum skews neutral-to-bearish.
Pi Network (PI) hovers below $0.1700, broadly steady at press time on Monday, attempting a recovery after a 2% loss the previous day. Sunday’s decline aligned with nearly 49 million PI tokens offloaded by the Pi Foundation, implying a spike in supply pressure that capped the prevailing four-day recovery. Technically, PI flashes downside risk after failing to exceed the 50-day Exponential Moving Average (EMA) at $0.1740, targeting a crucial support level at $0.1533.
Pi Foundation offloading supply weighs on PI
PiScan data shows that the Pi Foundation made a strategic transfer of 50 million PI tokens within its wallets before offloading 48.88 million PI tokens into the open market. Typically, outflows from Pi core teams' wallets are attributed to claim bonuses for mainnet migration, for which community criticism persists over its lack of transparency.
Technical outlook: Will Pi Network extend losses below the 50-day EMA?
Pi Network remains under downside pressure, trading below the 50-day EMA at $0.1740. The lower sloping 50-day and 200-day EMAs maintain a near-term bearish bias.
The Moving Average Convergence Divergence (MACD) remains marginally positive, but slips closer to the signal line, suggesting fading bullish momentum and a high risk of a bearish crossover. The Relative Strength Index (RSI) is at 50, right in the neutral level.
On the downside, the immediate support for PI aligns with the October 10 low of $0.1533, followed by the February 6 low of $0.1300.
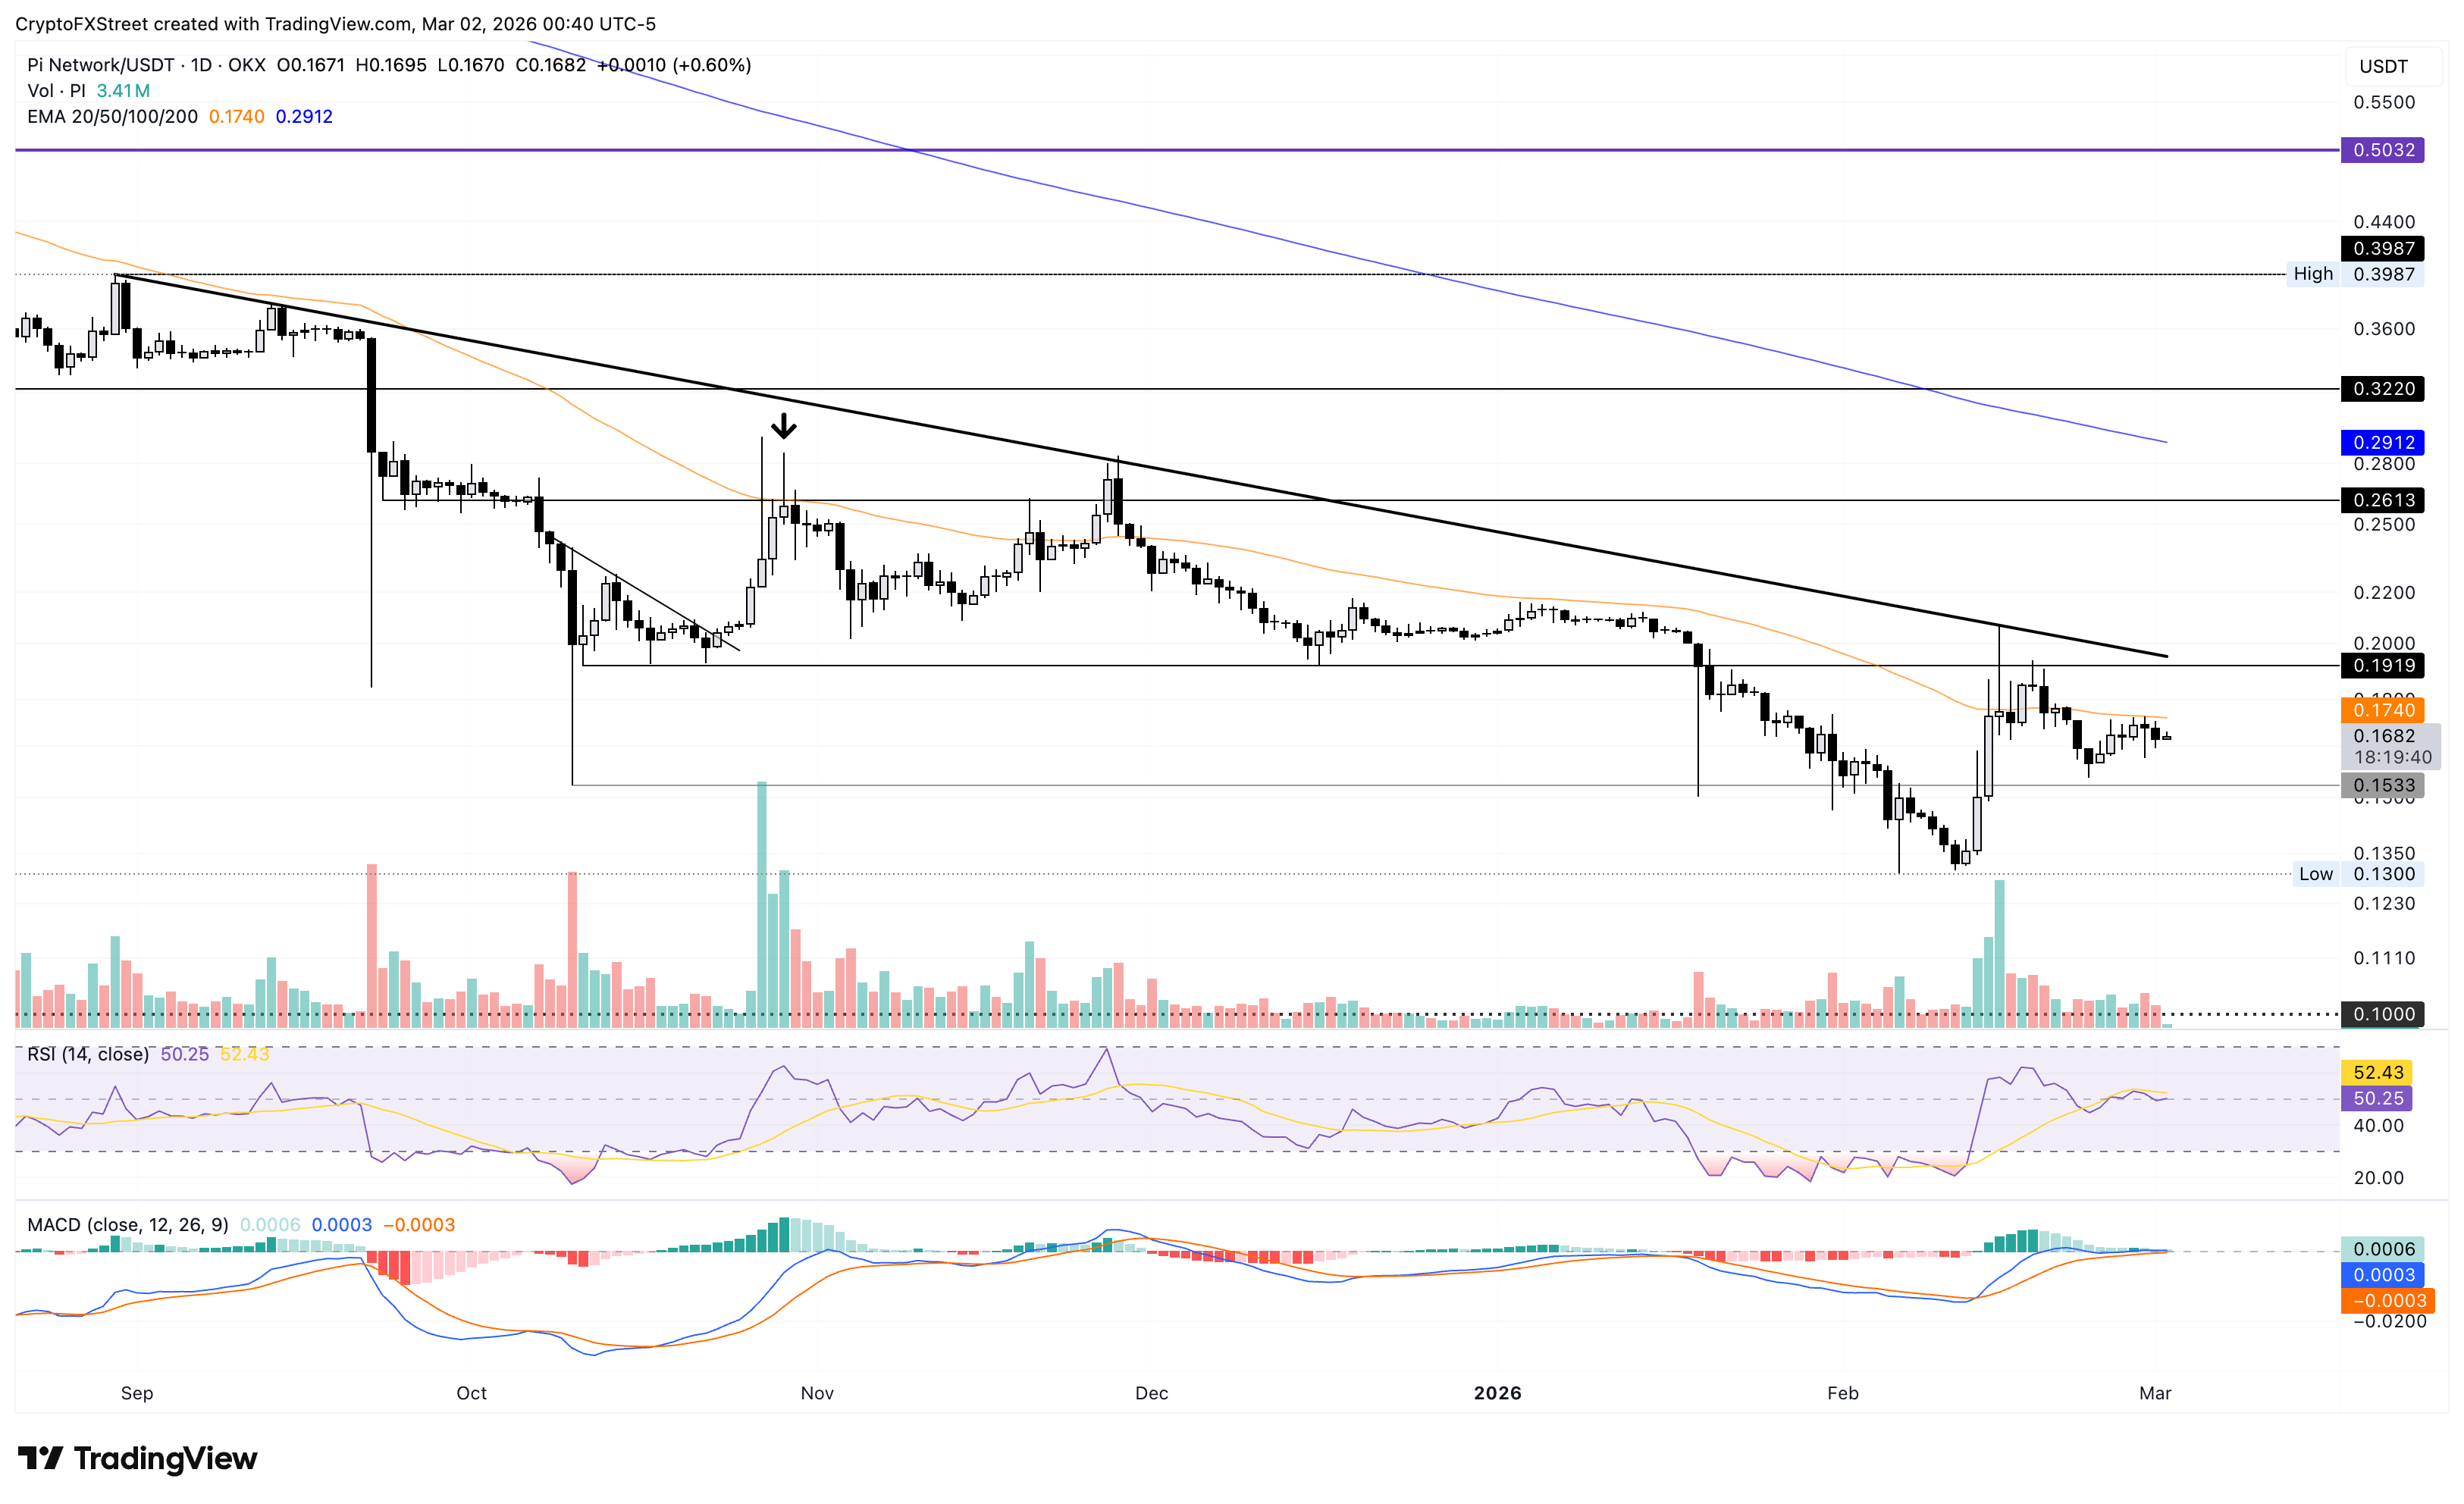
Looking up, the 50-day EMA at $0.1740 could serve as the initial resistance for a potential rebound in PI token. A decisive close above this level could target the descending resistance trendline near the October 11 low at $0.1919.
(The technical analysis of this story was written with the help of an AI tool.)

ผู้ใช้กว่าหนึ่งล้านคนพึ่งพา FXStreet สำหรับข้อมูลตลาดเรียลไทม์ เครื่องมือกราฟ การวิเคราะห์จากผู้เชี่ยวชาญ และข่าวฟอเร็กซ์ ปฏิทินเศรษฐกิจที่ครอบคลุมและเว็บบินาร์การศึกษาช่วยให้เทรดเดอร์ทันเหตุการณ์และตัดสินใจอย่างรอบคอบ FXStreet มีทีมงานประมาณ 60 คน แบ่งระหว่างสำนักงานใหญ่บาร์เซโลนาและภูมิภาคต่าง ๆ ทั่วโลก
อ่านเพิ่มเติม


