
Pi Network Price Forecast: PI extends decline as steady mainnet migration adds pressure
โดย Vishal Dixit
วันที่เผยแพร่: 9 Feb 2026 | วันที่แก้ไข: 9 Feb 2026


บทความยอดนิยม

Pi Network (PI) edges lower by over 3% at press time on Monday, marking a third consecutive day of losses. The declining trend in PI aligns with the steady mainnet migration of PI tokens, which may fuel selling pressure.
- Pi Network extends its decline for the third consecutive day after being rejected near $0.1500 last week.
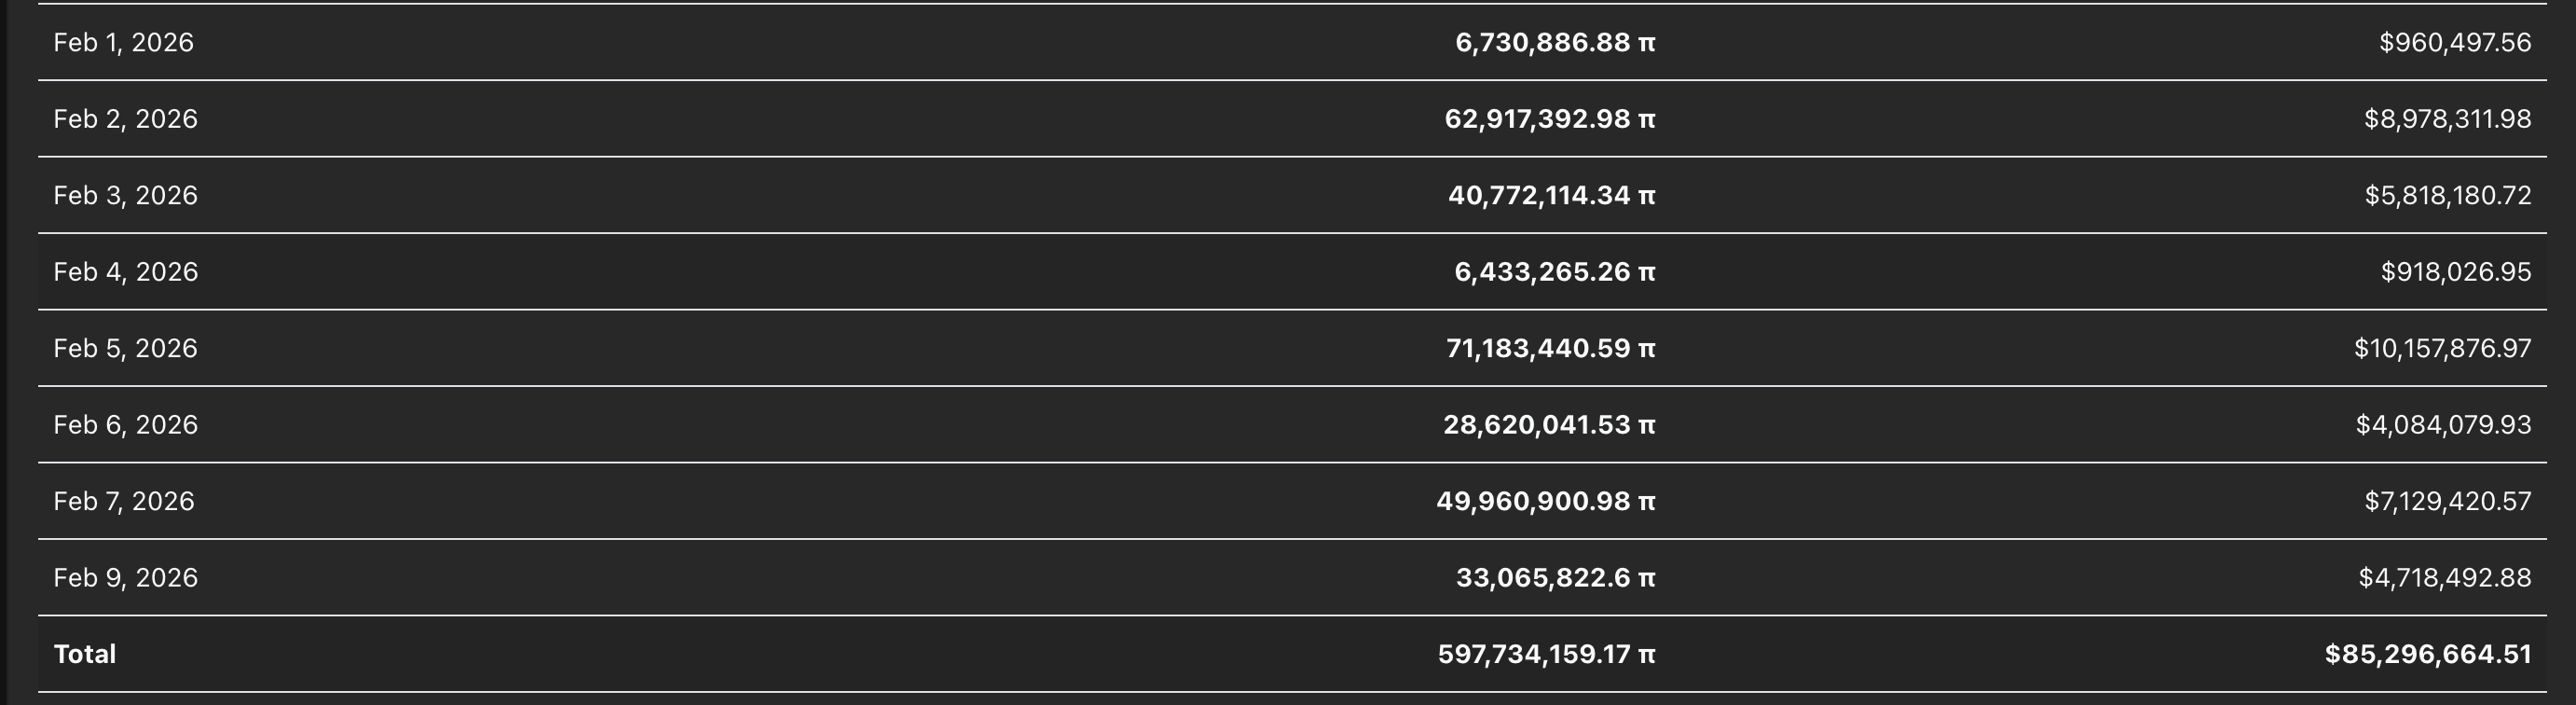
- PiScan data shows CEXs' outflows struggling to curb selling pressure as more than 33 million PI tokens migrate to the mainnet on Monday.
- The technical outlook for PI remains bearish as selling pressure grows.
Pi Network (PI) edges lower by over 3% at press time on Monday, marking a third consecutive day of losses. The declining trend in PI aligns with the steady mainnet migration of PI tokens, which may fuel selling pressure. The technical outlook for PI remains bearish, with bearish momentum persisting.
Mainnet migration adds selling pressure
PiScan data show a consistent mainnet migration, giving holders an opportunity to offload PI tokens, adding to selling pressure. PiScan data show 33.06 million PI tokens were transferred to the mainnet on Monday, bringing February's total to roughly 300 million PI tokens.
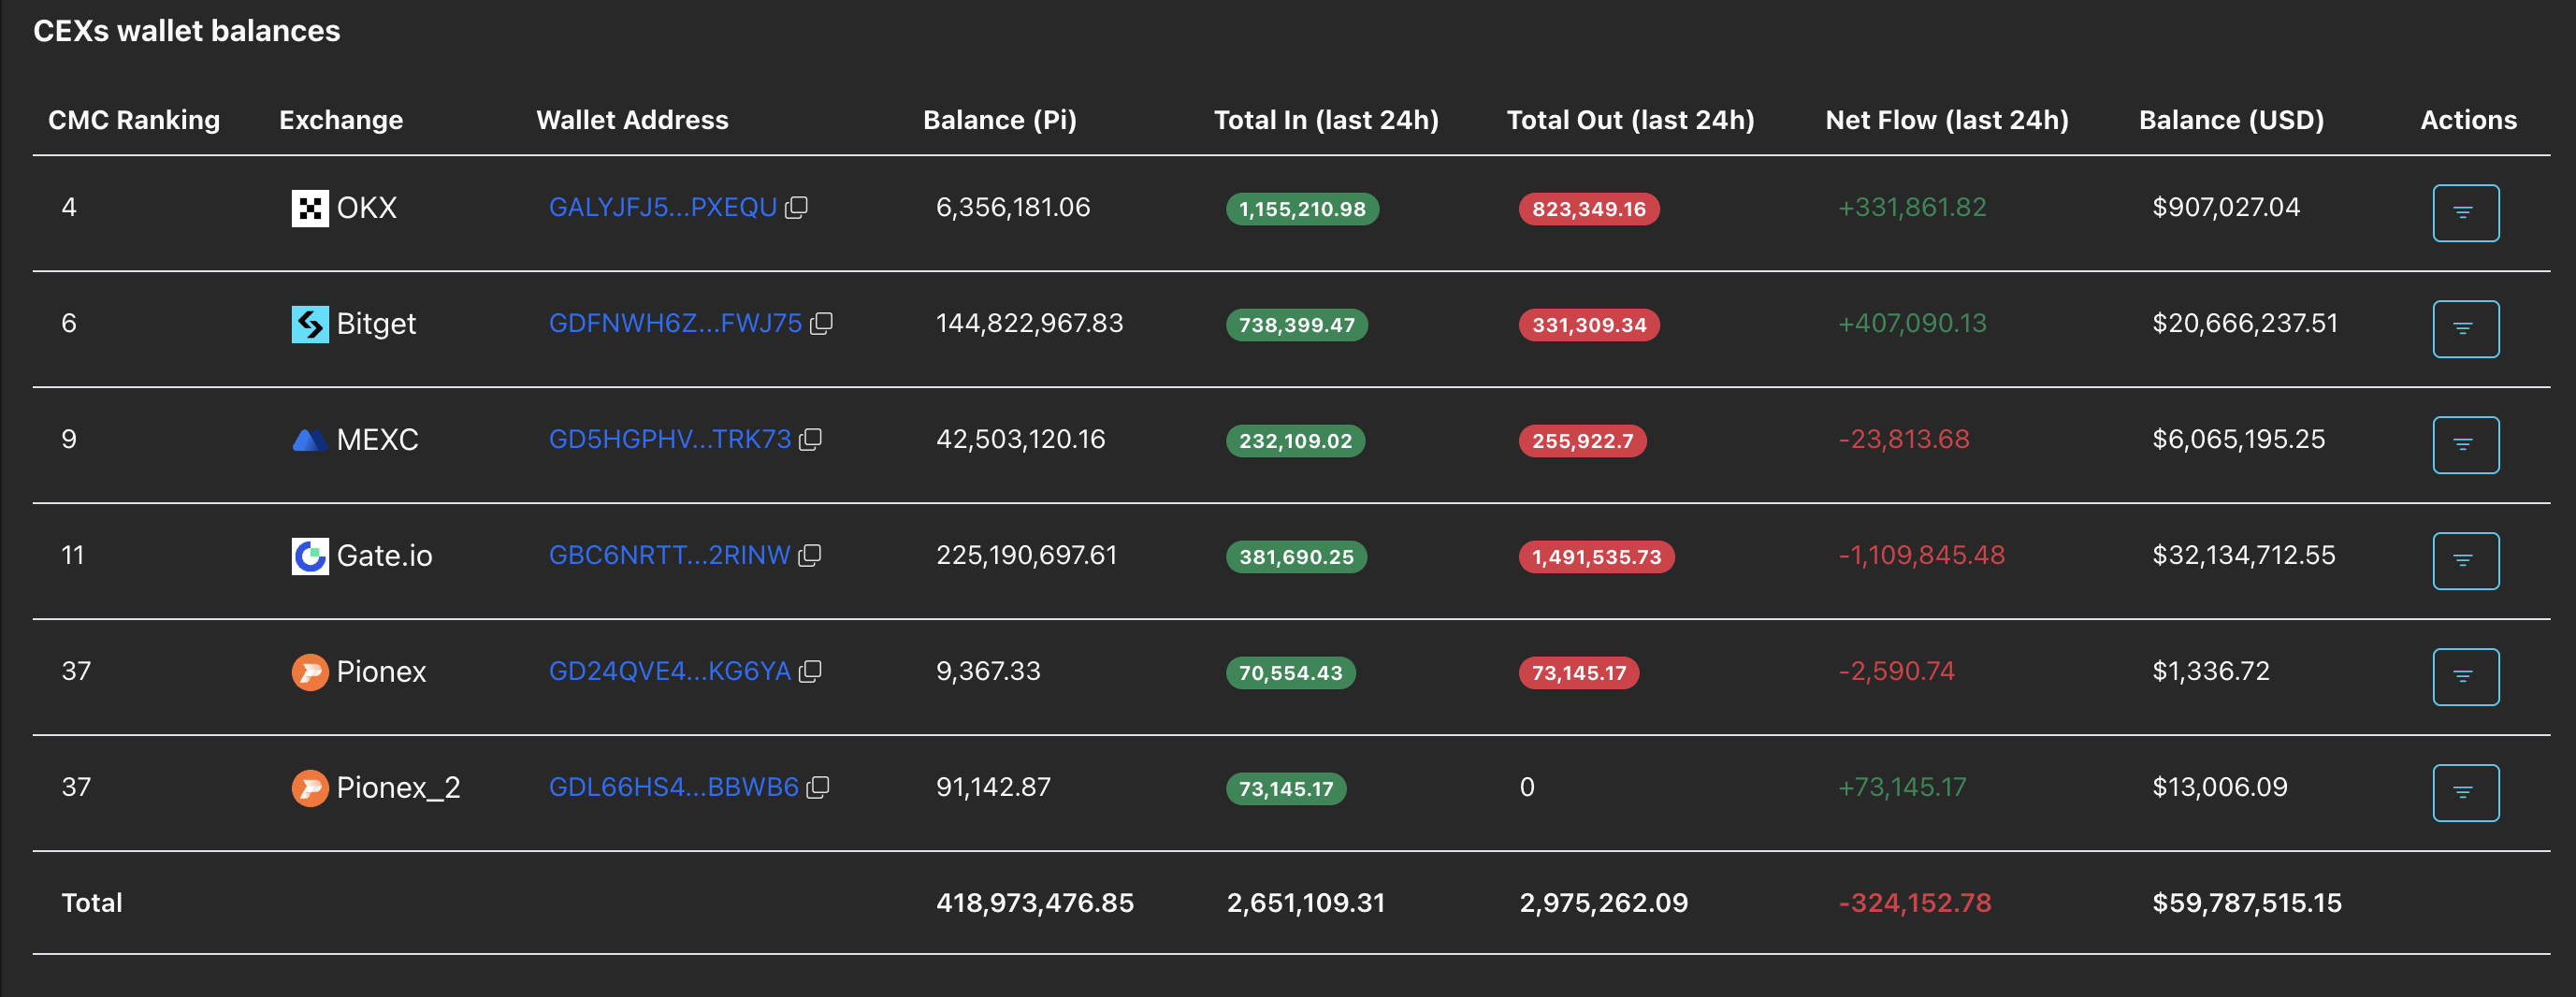
Meanwhile, the PI-supporting Centralized Exchanges (CEXs) recorded an outflow of 324,152 PI tokens in the last 24 hours. Typically, withdrawals from CEXs indicate reduced selling pressure, suggesting that the supply pressure is likely driven by off-exchange channels, including Over-the-Counter (OTC) trades.
Technical outlook: Will PI token hit a fresh low?
Pi Network extends its decline by over 3% at press time on Monday, approaching the $0.1400 round figure. A decisive close below $0.1400 on the 4-hour chart would likely trigger a move to the S1 Pivot Point at $0.1283.
The momentum indicators on the 4-hour chart suggest a sell-side dominance. The Moving Average Convergence Divergence (MACD) dips toward the signal line as green histogram bars contract, raising the risk of a bearish crossover. At the same time, the Relative Strength Index (RSI) has dropped to 32, inching closer to the oversold zone. If the MACD indicator displays a bearish crossover and the RSI enters the oversold zone, the PI token is likely to experience a steeper correction.
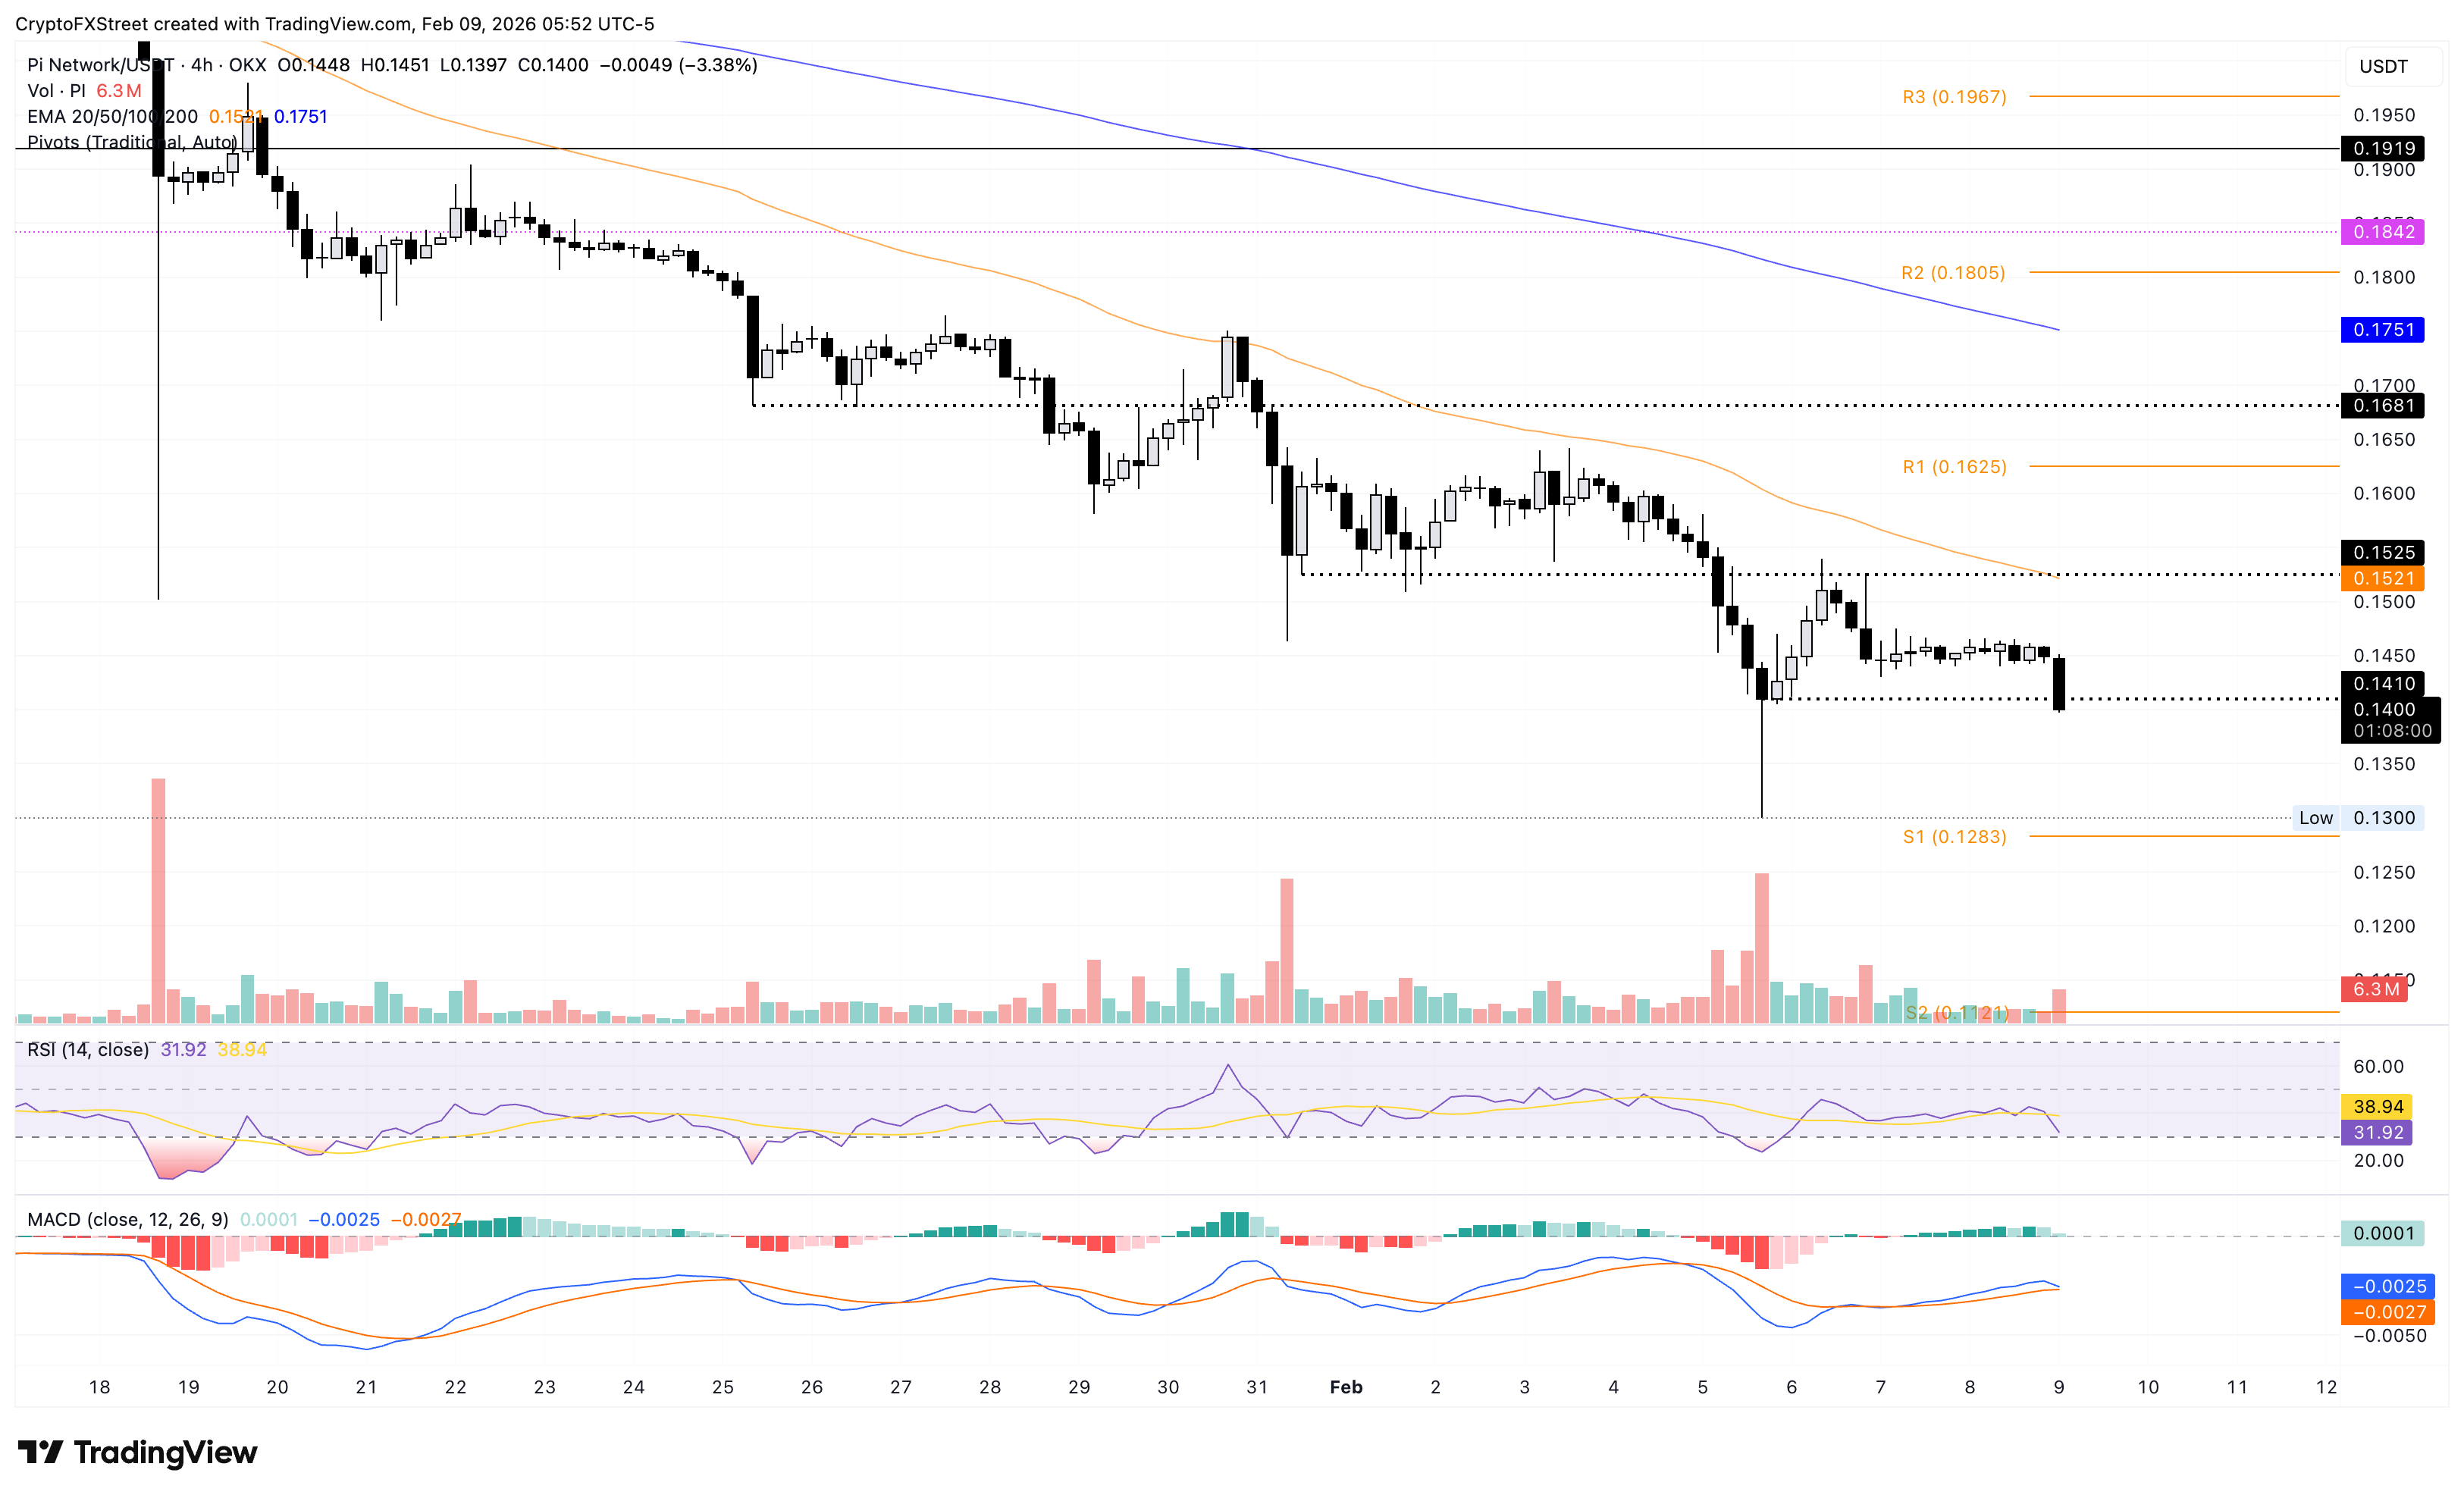
On the upside, a close above $0.1450 would ease downside pressure and could lift PI token toward the $0.1500 round figure.

ผู้ใช้กว่าหนึ่งล้านคนพึ่งพา FXStreet สำหรับข้อมูลตลาดเรียลไทม์ เครื่องมือกราฟ การวิเคราะห์จากผู้เชี่ยวชาญ และข่าวฟอเร็กซ์ ปฏิทินเศรษฐกิจที่ครอบคลุมและเว็บบินาร์การศึกษาช่วยให้เทรดเดอร์ทันเหตุการณ์และตัดสินใจอย่างรอบคอบ FXStreet มีทีมงานประมาณ 60 คน แบ่งระหว่างสำนักงานใหญ่บาร์เซโลนาและภูมิภาคต่าง ๆ ทั่วโลก
อ่านเพิ่มเติม


