
USD/JPY Price Forecast: Extends advance but stalls near 159.50
โดย Christian Borjon Valencia
อัปเดตแล้ว: 25 Mar 2026


บทความยอดนิยม

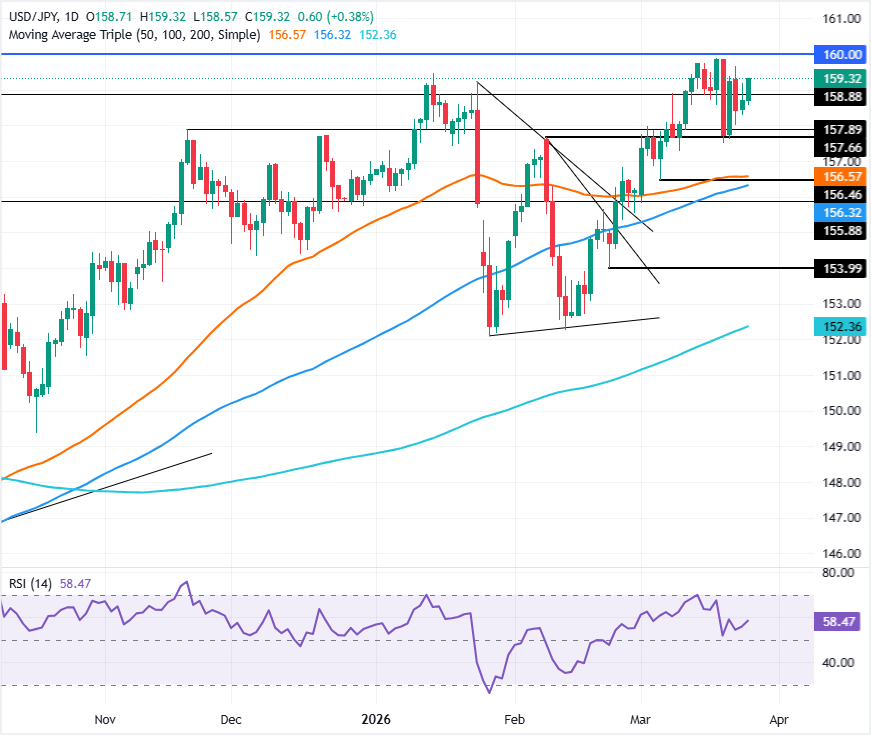
The USD/JPY registers back-to-back bullish days after testing key support at the 20-day Simple Moving Average (SMA) around 158.24 on Monday, yet it remains shy of clearing the key weekly high of 159.65 hit on March 23. At the time of writing, the pair trades at 159.27, up 0.36%.
- USD/JPY posts consecutive gains after bouncing from 20-day SMA support.
- RSI signals bullish momentum, pointing toward retest of weekly highs.
- Failure to clear 159.65 keeps focus on downside support levels.
The USD/JPY registers back-to-back bullish days after testing key support at the 20-day Simple Moving Average (SMA) around 158.24 on Monday, yet it remains shy of clearing the key weekly high of 159.65 hit on March 23. At the time of writing, the pair trades at 159.27, up 0.36%.
USD/JPY Price Forecast: Technical Outlook
The technical picture suggests that the USD/JPY might retest weekly highs in the short term. Momentum, as measured by the Relative Strength Index (RSI), confirms the latter. Still, fears of Japanese authorities intervening in the FX markets could prevent USD bulls from pushing the pair towards the 160.00 milestone.
On the downside, the first area of interest is the 20-day SMA at 158.24. Once surpassed, it opens the door to challenging the March 19 daily low of 157.51, as the 50-day SMA emerges as the next key line of defense for bulls at around 156.56.
On further weakness, the next support would be the 100-day SMA at 156.26, ahead of 156.00.
USD/JPY Price Chart — Daily
Japanese Yen Price This week
The table below shows the percentage change of Japanese Yen (JPY) against listed major currencies this week. Japanese Yen was the strongest against the Canadian Dollar.
| USD | EUR | GBP | JPY | CAD | AUD | NZD | CHF | |
|---|---|---|---|---|---|---|---|---|
| USD | -0.32% | -0.47% | -0.03% | 0.66% | 0.57% | 0.07% | 0.36% | |
| EUR | 0.32% | -0.14% | 0.33% | 1.00% | 0.89% | 0.40% | 0.70% | |
| GBP | 0.47% | 0.14% | 0.40% | 1.16% | 1.05% | 0.54% | 0.77% | |
| JPY | 0.03% | -0.33% | -0.40% | 0.65% | 0.58% | 0.08% | 0.28% | |
| CAD | -0.66% | -1.00% | -1.16% | -0.65% | -0.07% | -0.58% | -0.31% | |
| AUD | -0.57% | -0.89% | -1.05% | -0.58% | 0.07% | -0.50% | -0.28% | |
| NZD | -0.07% | -0.40% | -0.54% | -0.08% | 0.58% | 0.50% | 0.23% | |
| CHF | -0.36% | -0.70% | -0.77% | -0.28% | 0.31% | 0.28% | -0.23% |
The heat map shows percentage changes of major currencies against each other. The base currency is picked from the left column, while the quote currency is picked from the top row. For example, if you pick the Japanese Yen from the left column and move along the horizontal line to the US Dollar, the percentage change displayed in the box will represent JPY (base)/USD (quote).

ผู้ใช้กว่าหนึ่งล้านคนพึ่งพา FXStreet สำหรับข้อมูลตลาดเรียลไทม์ เครื่องมือกราฟ การวิเคราะห์จากผู้เชี่ยวชาญ และข่าวฟอเร็กซ์ ปฏิทินเศรษฐกิจที่ครอบคลุมและเว็บบินาร์การศึกษาช่วยให้เทรดเดอร์ทันเหตุการณ์และตัดสินใจอย่างรอบคอบ FXStreet มีทีมงานประมาณ 60 คน แบ่งระหว่างสำนักงานใหญ่บาร์เซโลนาและภูมิภาคต่าง ๆ ทั่วโลก
อ่านเพิ่มเติม


