
Axie Infinity Price Forecast: AXS slides 7% as exchange netflow hits 3-year high
โดย Manish Chhetri
วันที่เผยแพร่: 15 Jan 2026 | วันที่แก้ไข: 15 Jan 2026


บทความยอดนิยม

Axie Infinity (AXS) price slides more than 7%, trading below $1.12 on Thursday, after a massive surge earlier this week.
- Axie Infinity price slips more than 7% on Thursday after surging nearly 37% in the previous two days.
- Exchange netflow has reached its highest level in 3 years, signaling rising selling pressure.
- Derivatives metrics support bearish sentiment as funding rates turn negative and short bets rise.
Axie Infinity (AXS) price slides more than 7%, trading below $1.12 on Thursday, after a massive surge earlier this week. The bearish sentiment strengthens as AXS’s exchange netflow hits a 3-year high, alongside negative funding rates and rising short bets, all of which hint at a short-term price pullback.
Exchange netflow hints at rising selling pressure
CryptoQuant Exchange Netflow (Total) at all exchanges shows the difference between tokens flowing into and out of the exchange. If the metric is positive, it indicates more tokens entered than exited, indicating selling pressure from investors. Conversely, a negative value indicates more tokens left the exchange than entered, indicating less selling pressure from investors.
In the Axie Infinity case, the metric showed a net positive flow of 2.10 million on Wednesday, the highest netflow since 24 November 2022, signaling rising selling pressure.
 - All Exchanges-1768448163638-1768448163639.png)
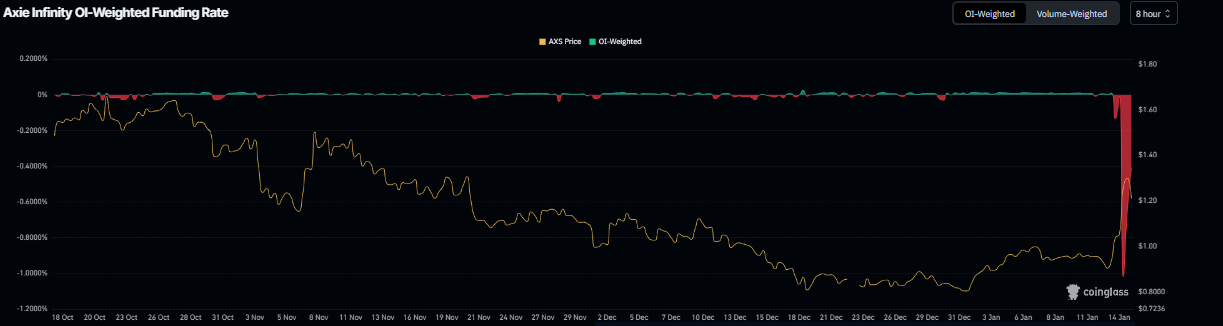
Derivatives data supports bearish sentiment
On the derivatives side, data further supports a bearish sentiment among AXS traders. Coinglass’s OI-Weighted Funding Rate data shows that the number of traders betting that the price of AXS will slide further is higher than those anticipating a price increase.
The metric flipped to a negative rate on Wednesday and fell sharply, reading -0.41% on Thursday, indicating shorts are paying longs and suggesting bearish sentiment toward AXS.
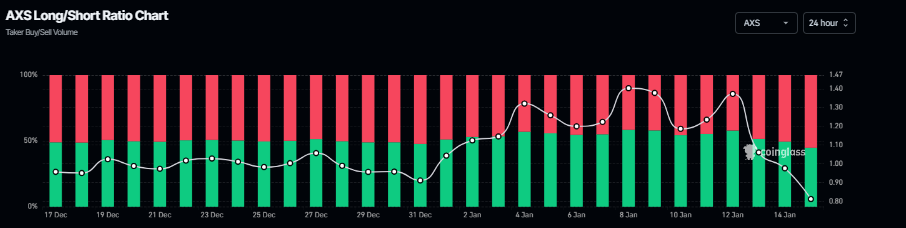
In addition, according to Coinglass data, Axie Infinity’s long-to-short ratio is 0.82 on Thursday. This ratio, below one, reflects bearish sentiment in the markets, as more traders are betting on the asset price to fall.
Axie Infinity Price Forecast: How low can AXS go?
Axie Infinity’s price has soared more than 37% over the last two days, since Tuesday. Such a massive rally often leads to a short-term price correction. On Wednesday, AXS retested the 38.20% Fibonacci retracement level at $1.37, and at the time of writing on Thursday, AXS slips more than 7%.
If AXS continues its price pullback, it could extend the decline toward the 50-day Exponential Moving Average (EMA) at $1.02. A close below this level could extend the correction further, toward Monday’s low at $0.90.
The Relative Strength Index (RSI) is at 61, down from the overbought level of 70 the previous day, indicating early signs of fading bullish strength. However, the Moving Average Convergence Divergence (MACD) showed a bullish crossover, which remains intact and supports a bullish view.
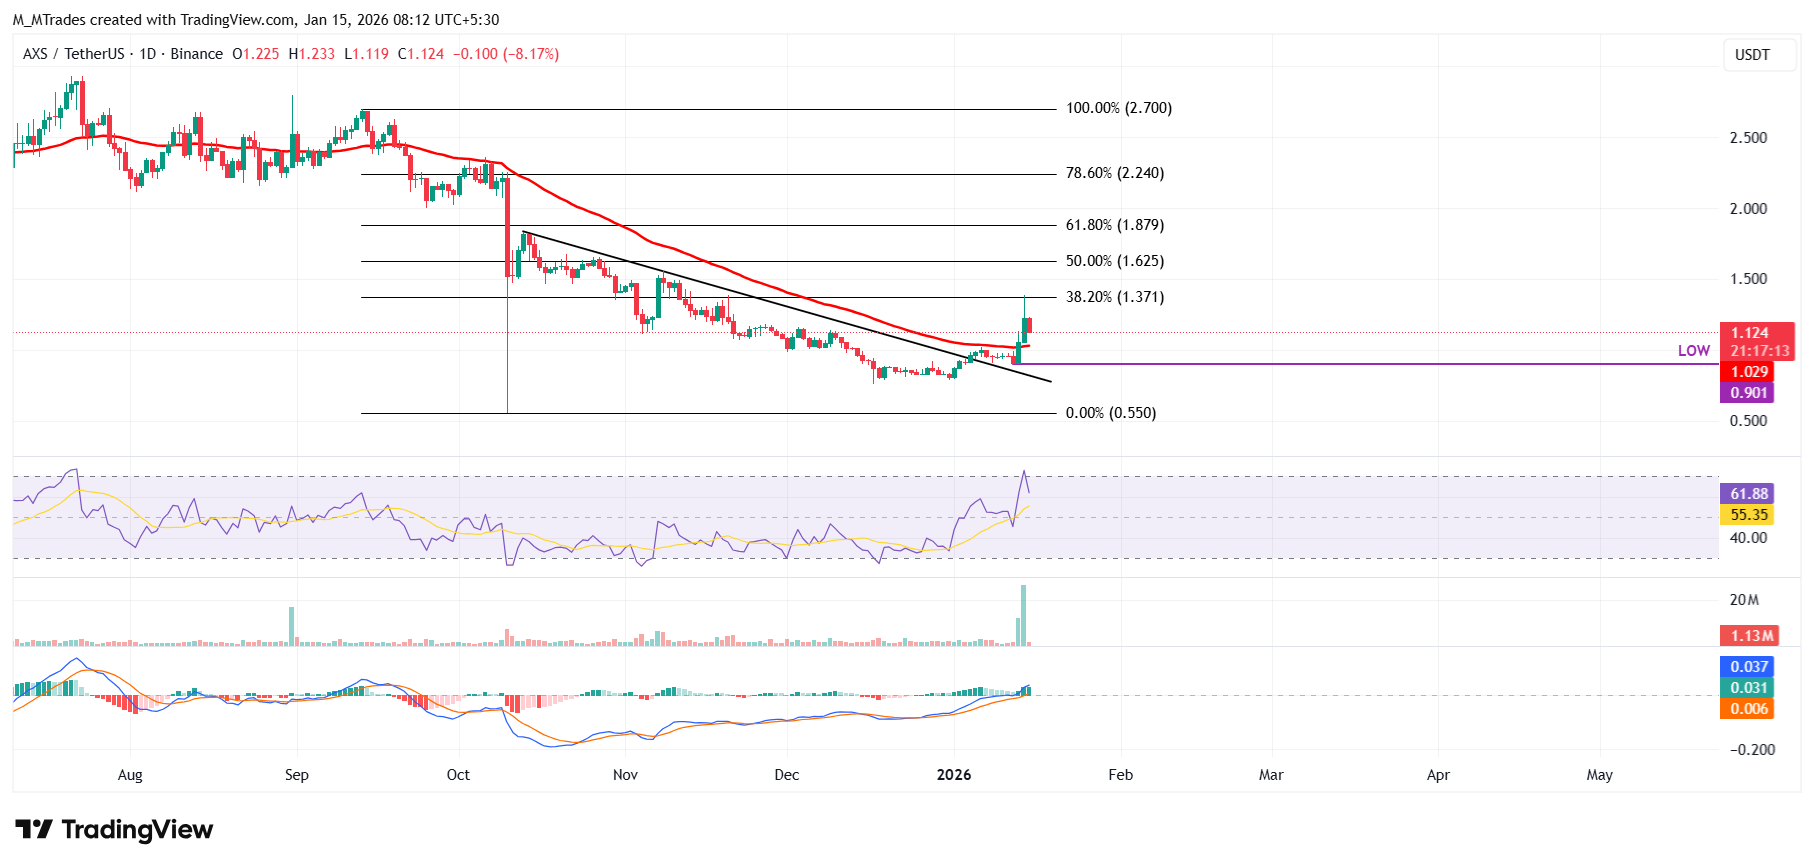
However, if AXS recovers, it could extend the recovery toward the 38.2% Fibonacci retracement level at $1.37.

ผู้ใช้กว่าหนึ่งล้านคนพึ่งพา FXStreet สำหรับข้อมูลตลาดเรียลไทม์ เครื่องมือกราฟ การวิเคราะห์จากผู้เชี่ยวชาญ และข่าวฟอเร็กซ์ ปฏิทินเศรษฐกิจที่ครอบคลุมและเว็บบินาร์การศึกษาช่วยให้เทรดเดอร์ทันเหตุการณ์และตัดสินใจอย่างรอบคอบ FXStreet มีทีมงานประมาณ 60 คน แบ่งระหว่างสำนักงานใหญ่บาร์เซโลนาและภูมิภาคต่าง ๆ ทั่วโลก
อ่านเพิ่มเติม


