
Trade The World
Sei Price Forecast: SEI eyes recovery amid ETF filing, robust network activity
โดย Vishal Dixit
วันที่เผยแพร่: 2 Sep 2025 | วันที่แก้ไข: 2 Sep 2025


POPULAR ARTICLES

Sei (SEI) edges higher by over 2% at press time on Tuesday, gradually recovering from the 3% loss on the previous day. The on-chain data suggest increased network activity, and the recently filed S-1 submission for the 21Shares SEI Exchange Traded Fund (ETF) implies a potential rebound.
- SEI ticks up by more than 2% on Tuesday, with bulls planning a rebound to the upper Bollinger Band.
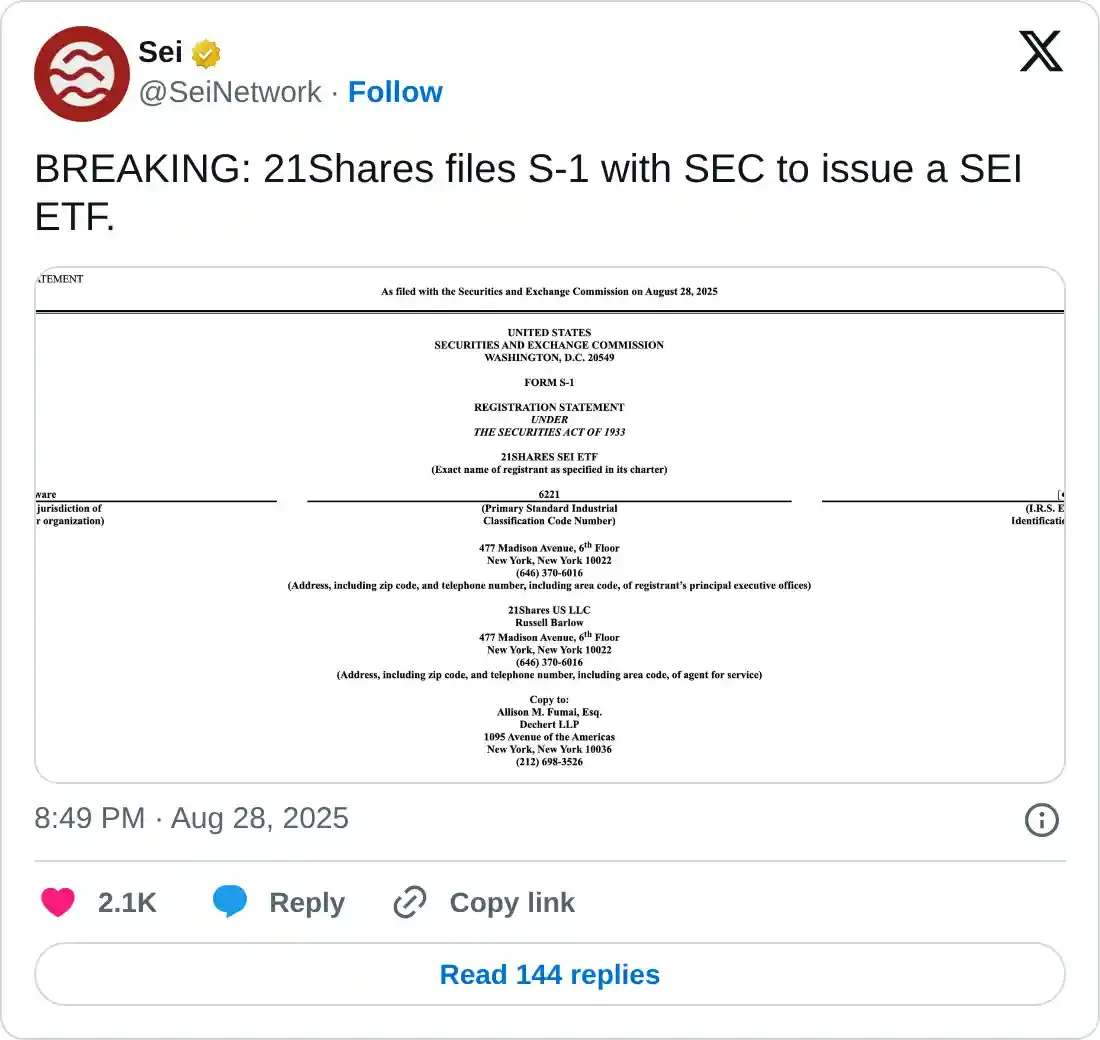
- 21Shares files S-1 with the US SEC for a SEI ETF.
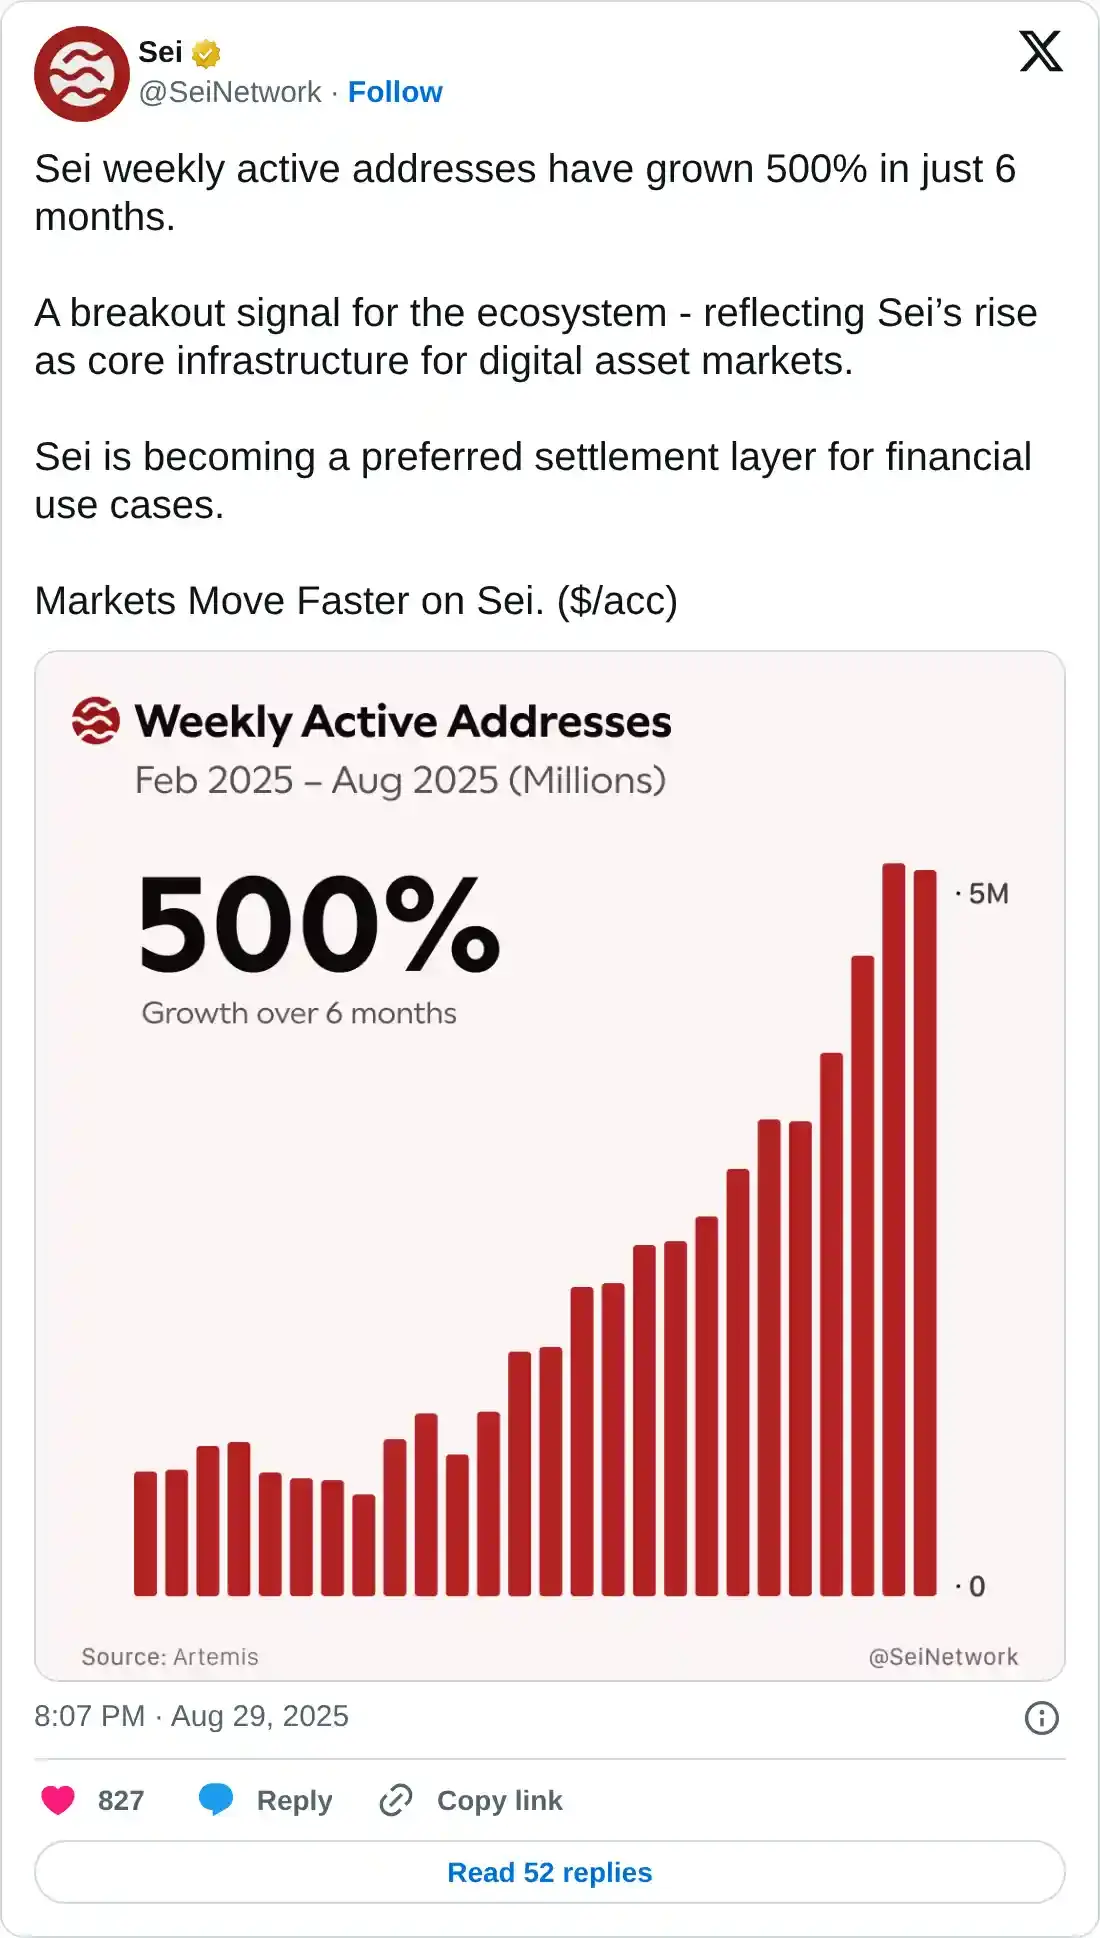
- A 500% rise in the weekly active addresses in the last six months signals significant network growth.
Sei (SEI) edges higher by over 2% at press time on Tuesday, gradually recovering from the 3% loss on the previous day. The on-chain data suggest increased network activity, and the recently filed S-1 submission for the 21Shares SEI Exchange Traded Fund (ETF) implies a potential rebound.
SEI optimistic developments
21Shares filed an S-1 submission with the US Securities and Exchange Commission (SEC) on Friday, joining the queue with Canary Capital. The increased institutional interest in the altcoin fuels the investors’ sentiment.
SEI announced a 500% rise in weekly active addresses in the last six months on Saturday. Notably, the active addresses crossed 5 million for the second consecutive week, indicating increased network adoption and activity.
DeFiLlama data indicates that the Total Value Locked (TVL) on the network is valued at $565.42 million, up from $559.35 million on Monday. A rise in the TVL is a healthy signal for network growth.
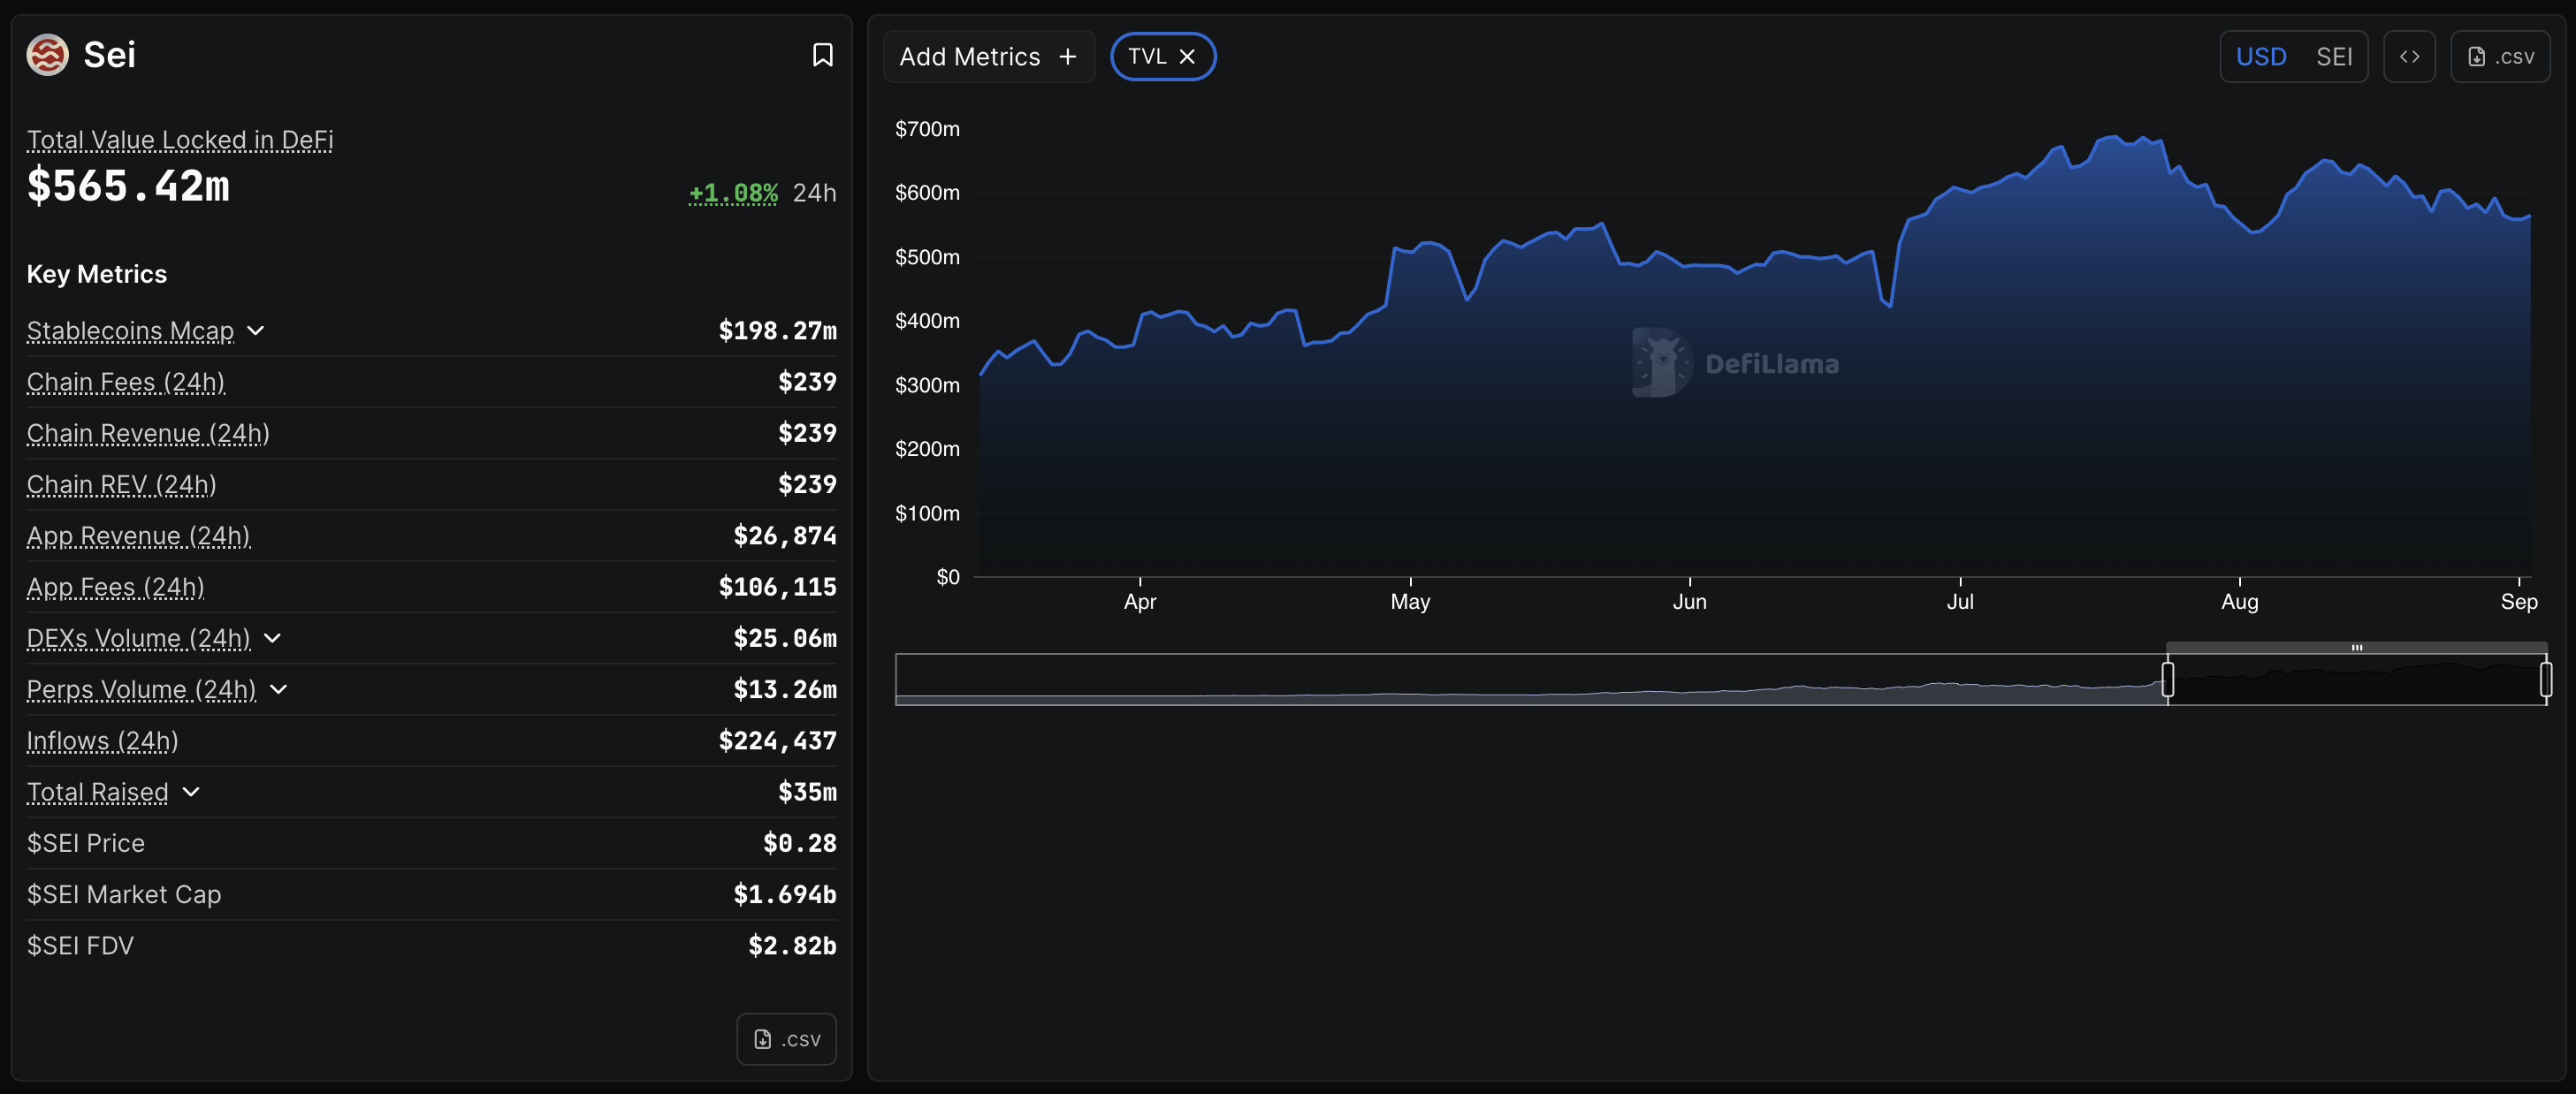
SEI TVL. Source: DeFiLlama
SEI is at a crucial crossroads
SEI rebounds from the lower Bollinger Band on the daily chart, avoiding a drop to the 38.2% Fibonacci level, which is drawn from the $0.7357 peak from December 5 to $0.1303 low from April 7, at $0.2524. The Bollinger Bands are moving sideways, reflecting a low-volatility contraction phase, while the lower band provides support, hinting at a potential bounce back.
A potential extended recovery could target the 50% Fibonacci retracement level at $0.3097.
CoinGlass data indicates that the SEI Open Interest (OI) has decreased significantly to $233.28 million, down from $245.17 million on Monday. This sharp decline in OI translates to investors adopting a wait-and-see approach.
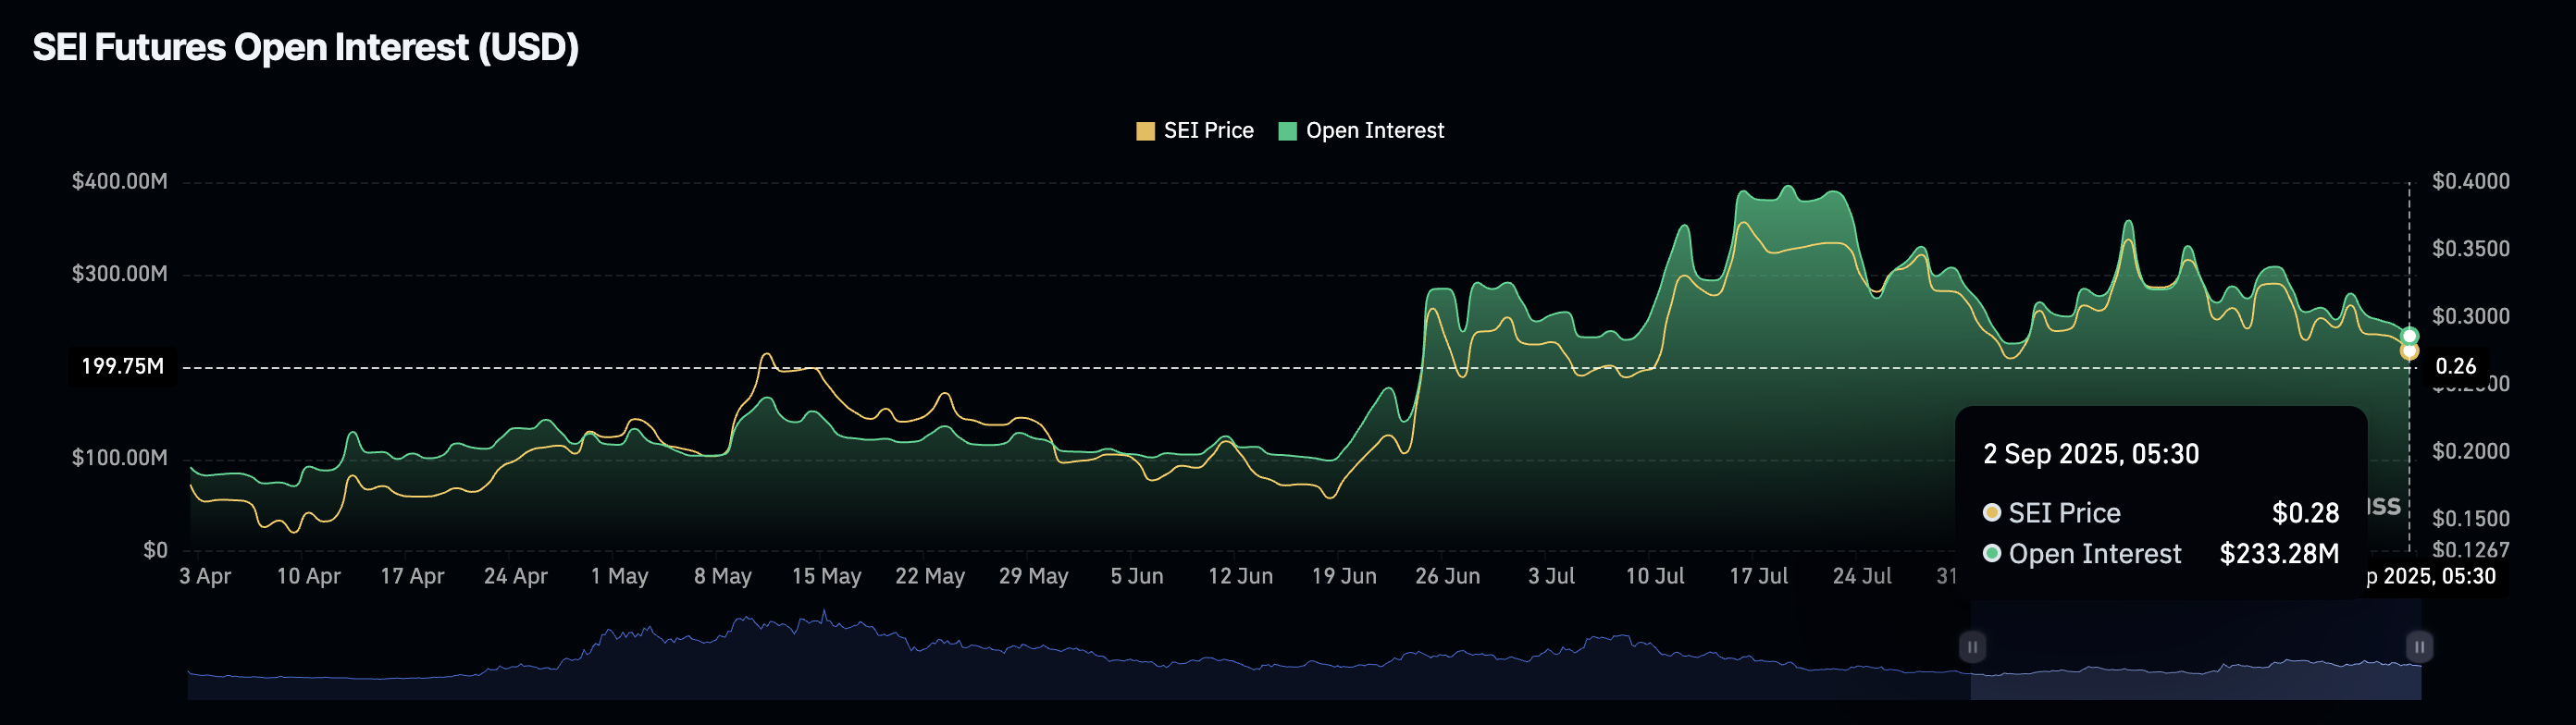
SEI Open Interest. Source: Coinglass
Adding to the lowered optimism among traders, the Taker sell volume dominates 50.44%, reducing the long-to-short ratio to 0.9826.
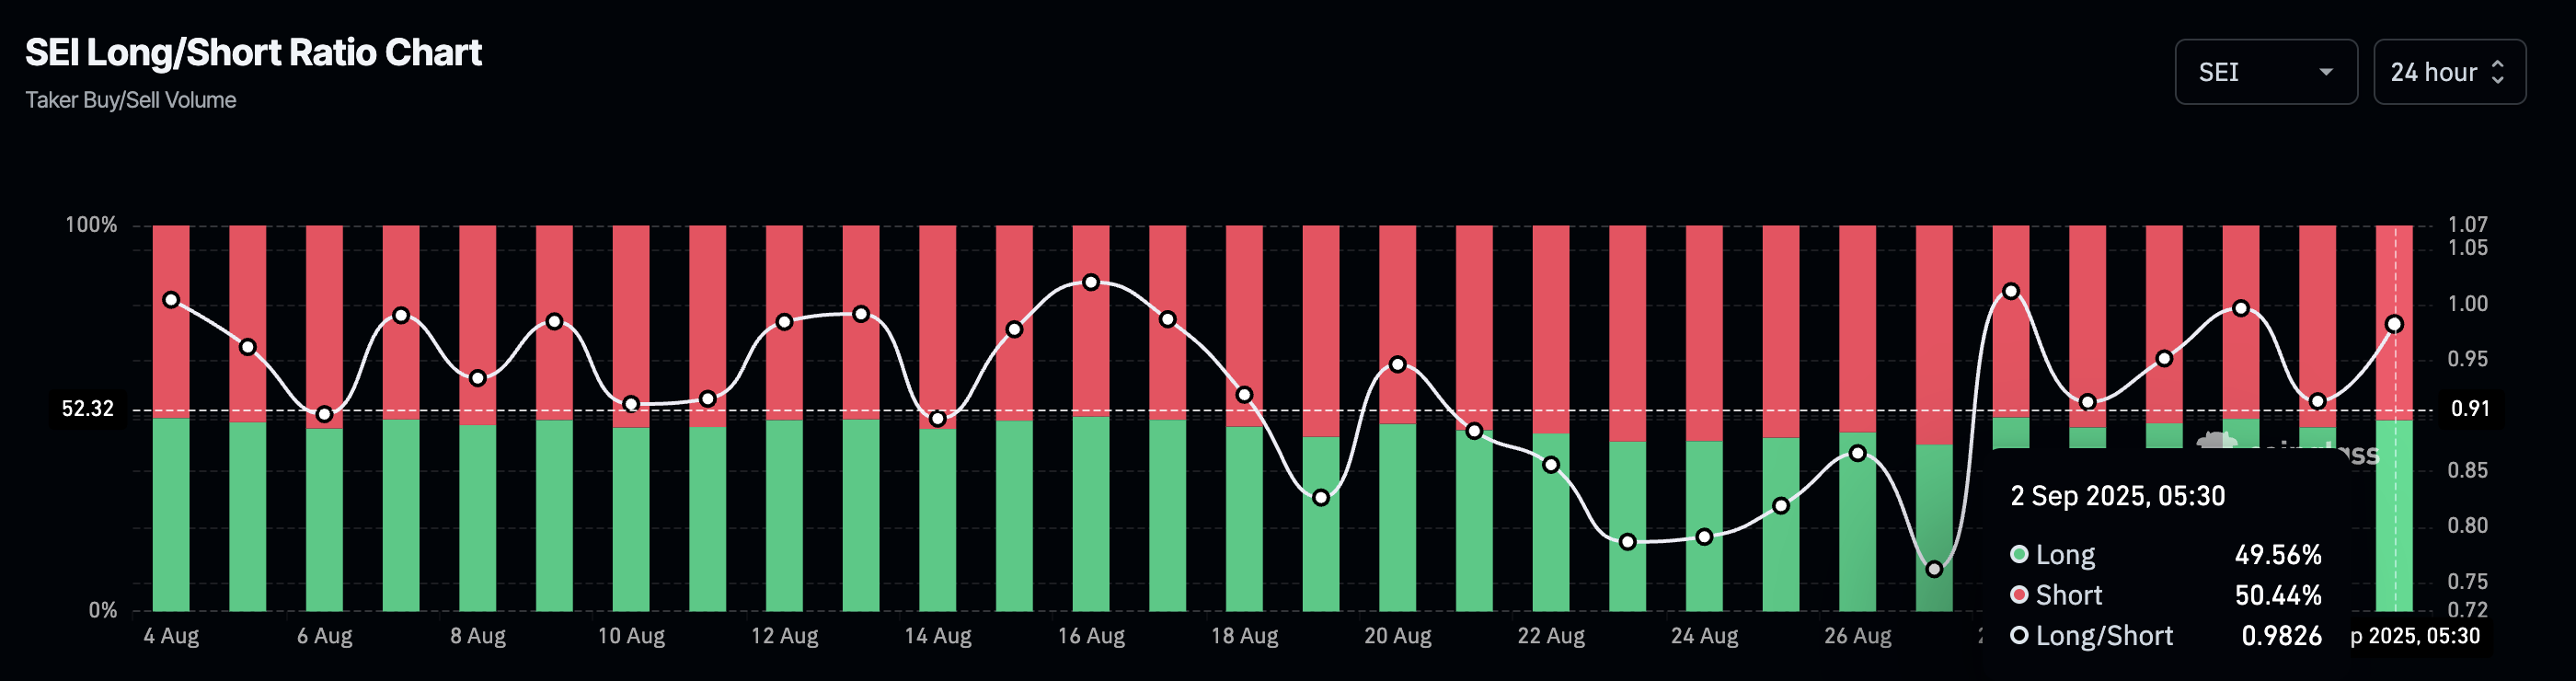
SEI long/short ratio chart. Source: Coinglass
The momentum indicators on the daily chart display diminishing signs of a bullish recovery, as the Moving Average Convergence Divergence (MACD) and its signal line move in a sloping downward direction, indicating rising bearish pressure.
Additionally, the Relative Strength Index (RSI) at 43 hovers below the midpoint, indicating mild bearish momentum.
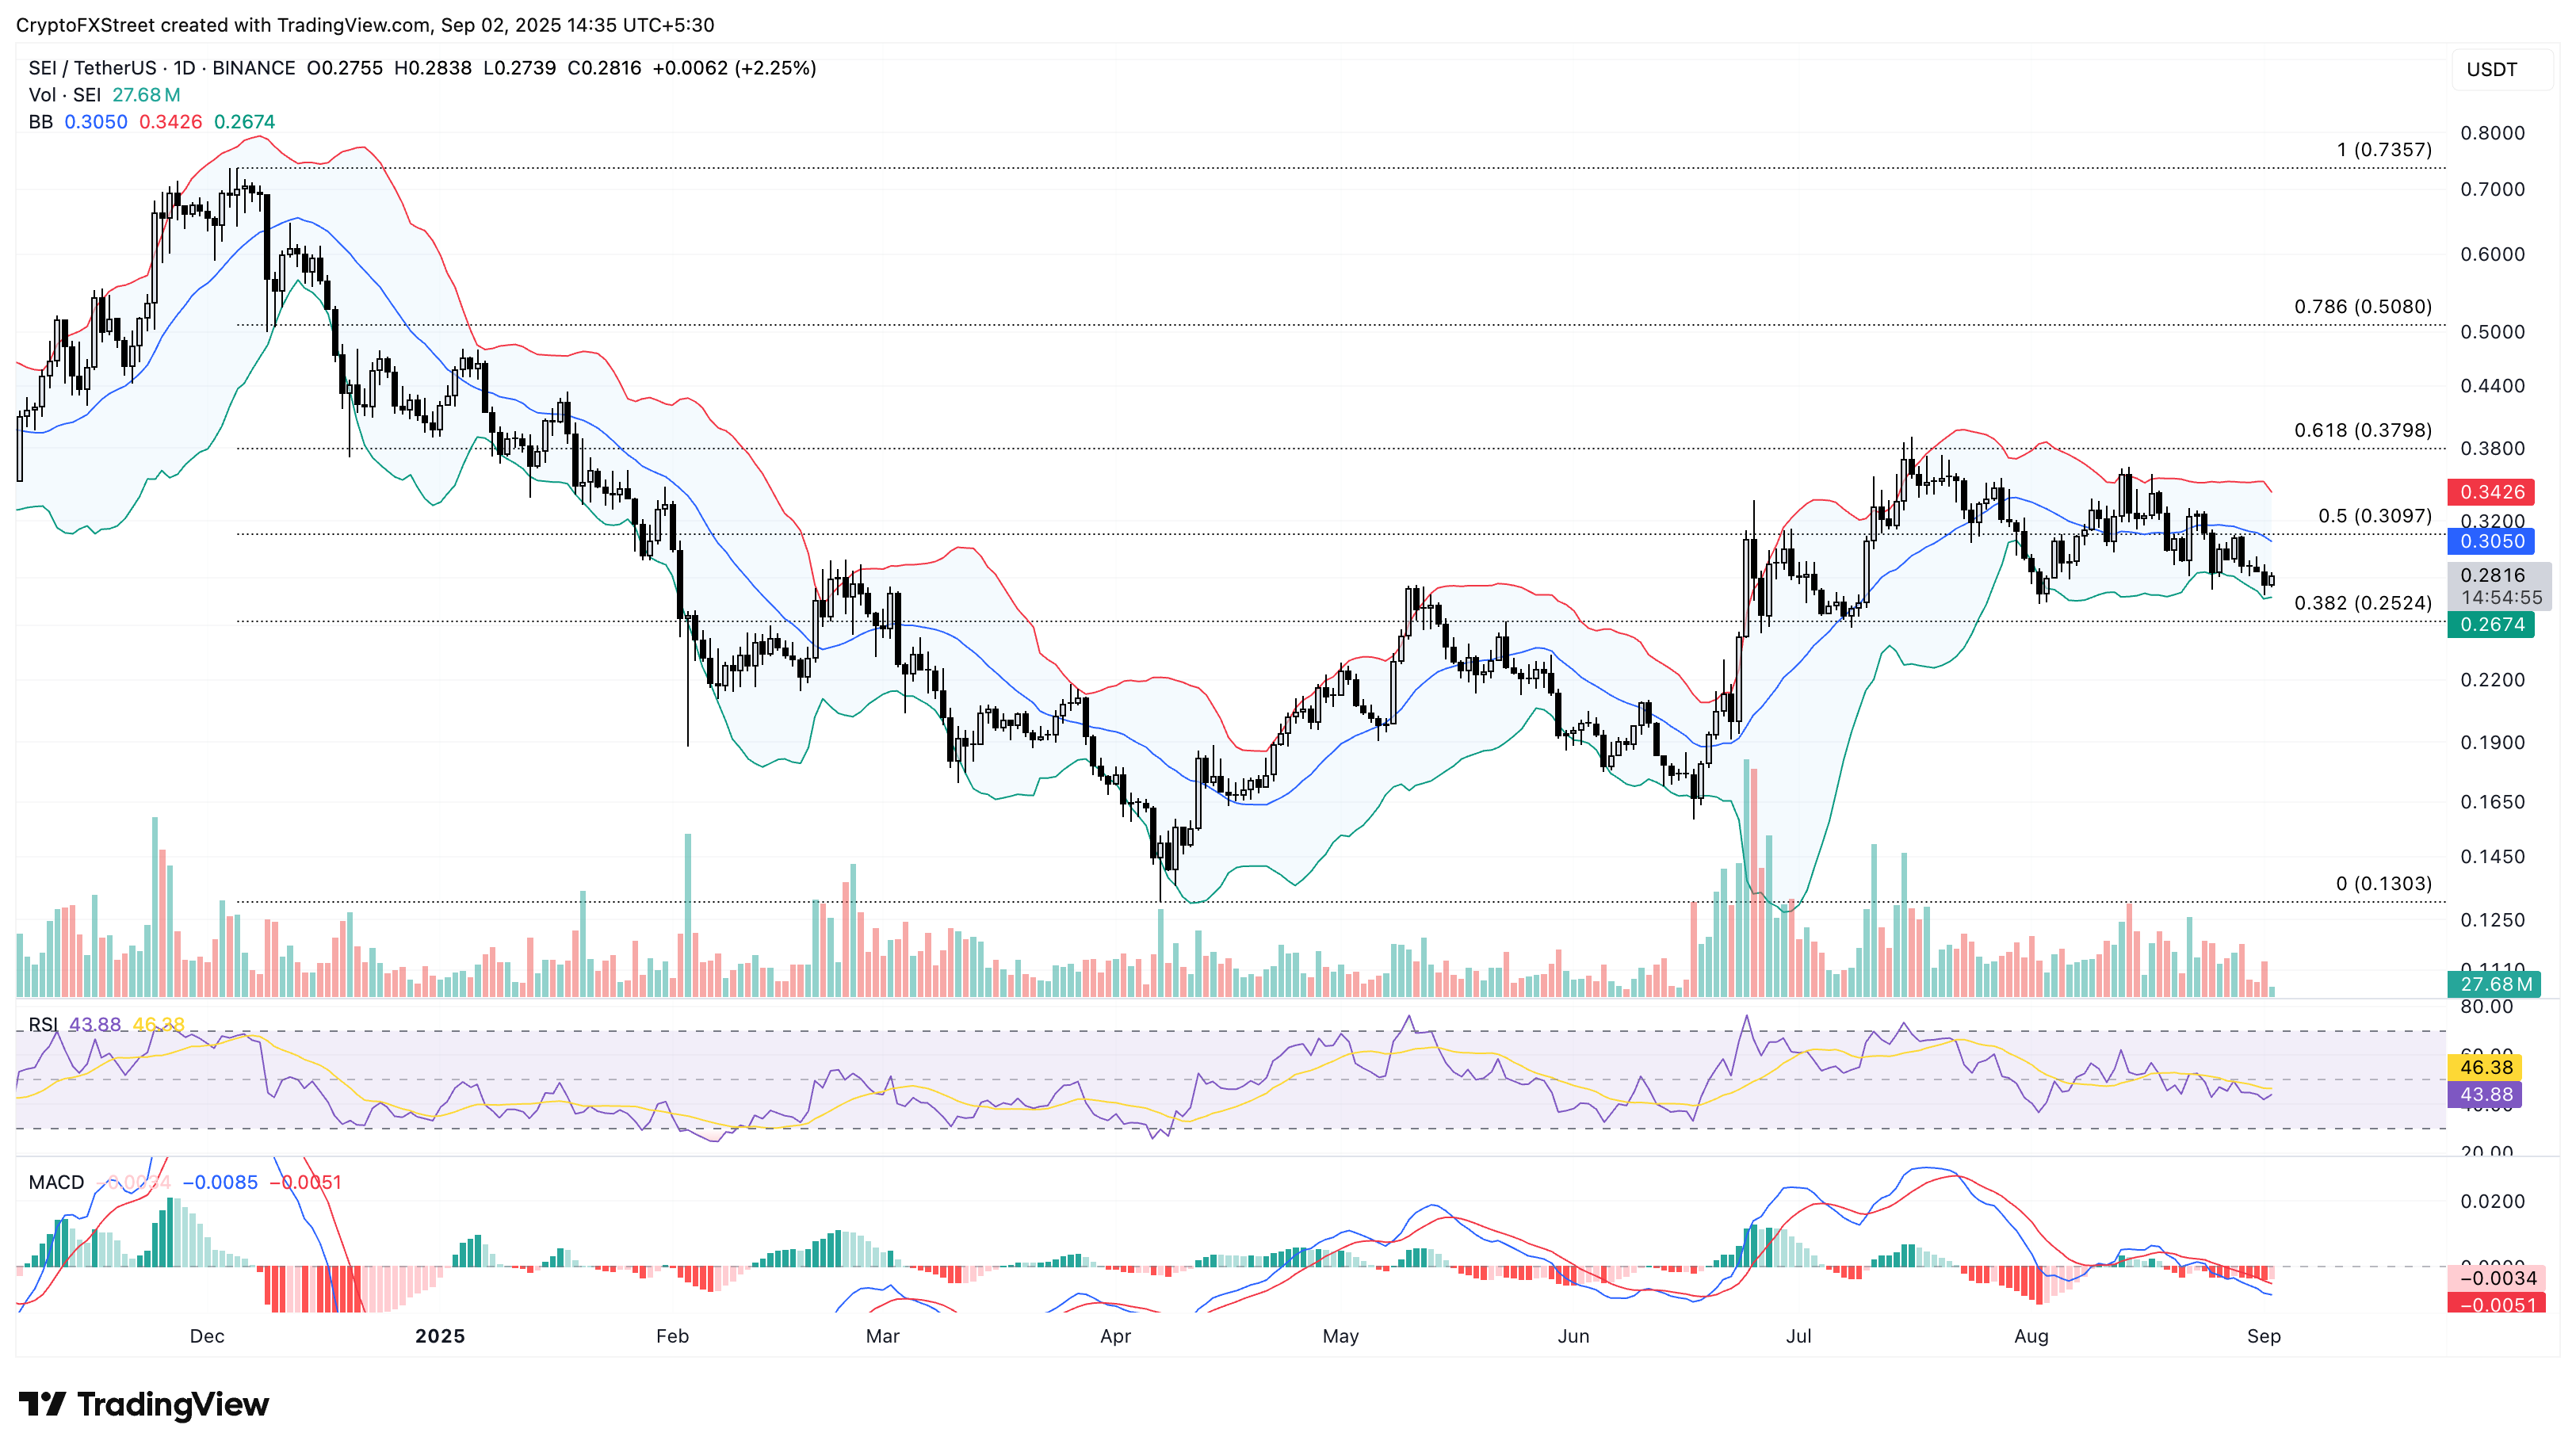
SEI/USDT daily price chart.
Looking down, if SEI marks a close below the 38.2% Fibonacci level at $0.2524, it could test the $0.2000 psychological support.

FXStreet
ผู้ใช้กว่าหนึ่งล้านคนพึ่งพา FXStreet สำหรับข้อมูลตลาดเรียลไทม์ เครื่องมือกราฟ การวิเคราะห์จากผู้เชี่ยวชาญ และข่าวฟอเร็กซ์ ปฏิทินเศรษฐกิจที่ครอบคลุมและเว็บบินาร์การศึกษาช่วยให้เทรดเดอร์ทันเหตุการณ์และตัดสินใจอย่างรอบคอบ FXStreet มีทีมงานประมาณ 60 คน แบ่งระหว่างสำนักงานใหญ่บาร์เซโลนาและภูมิภาคต่าง ๆ ทั่วโลก
Read More


