
Trade The World
Cardano Price Forecast: ADA erases one-year gains as retail interest narrows
Ni John Isige
Petsa ng Pag-publish: 18 Nov 2025 | Petsa ng Pag-edit: 18 Nov 2025


POPULAR ARTICLES

Cardano (ADA) is largely in bearish hands, trading above support at $0.45 at the time of writing on Tuesday. The downtrend builds on a bearish outlook that has weighed on the smart contracts token since July, when ADA peaked at $1.02.
- Cardano trades around November 2024 levels as bears show no signs of slowing in the short term.
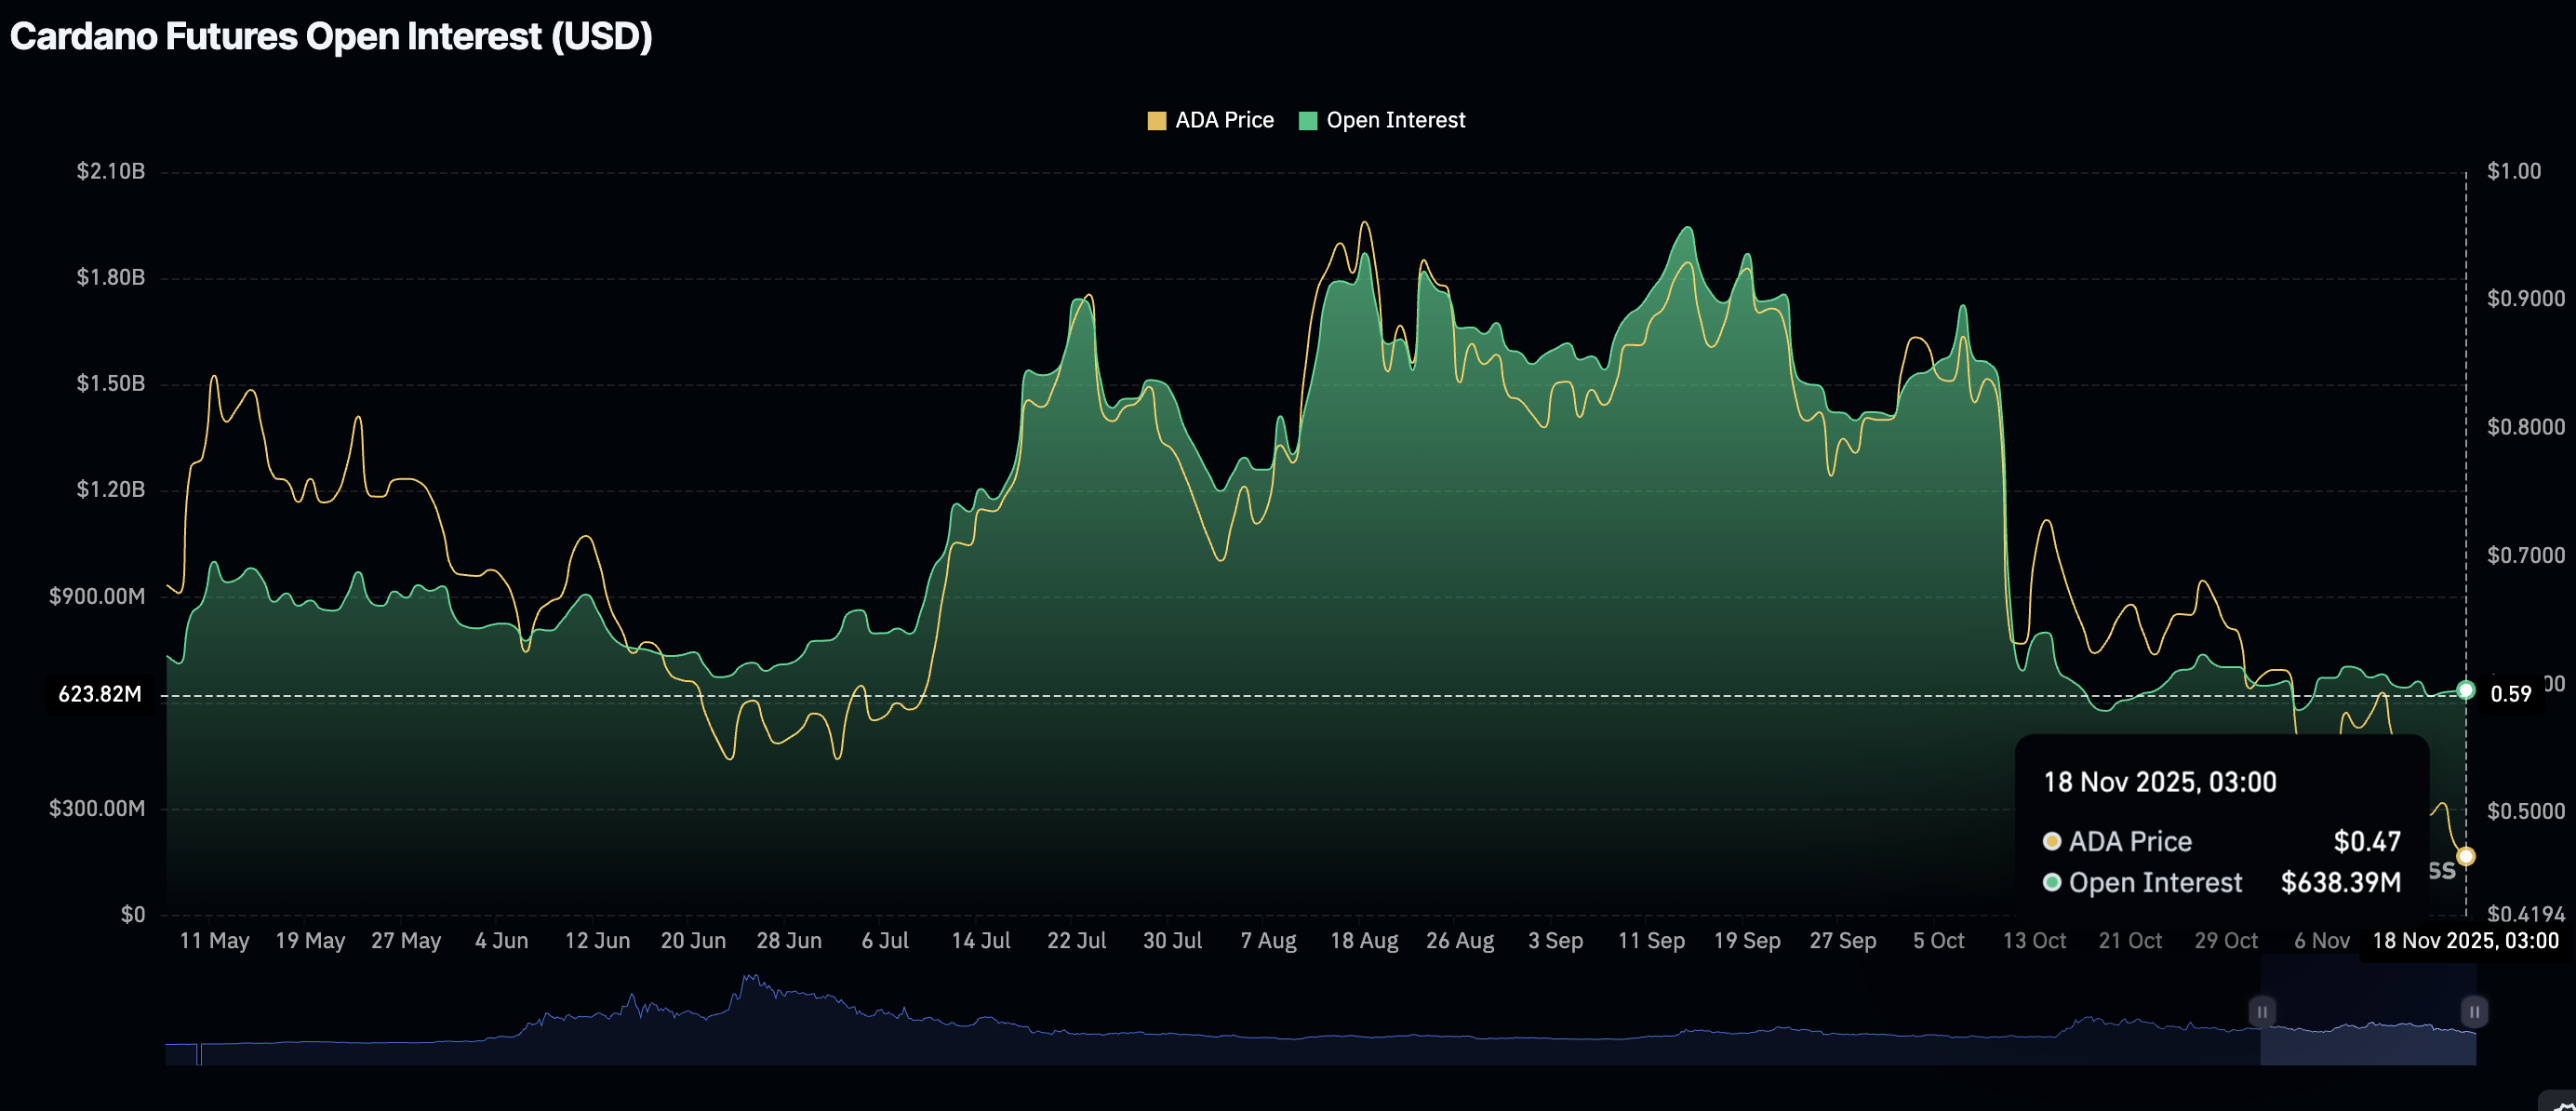
- The ADA derivatives market remains weak, with retail demand slowing and Open Interest averaging $638 million.
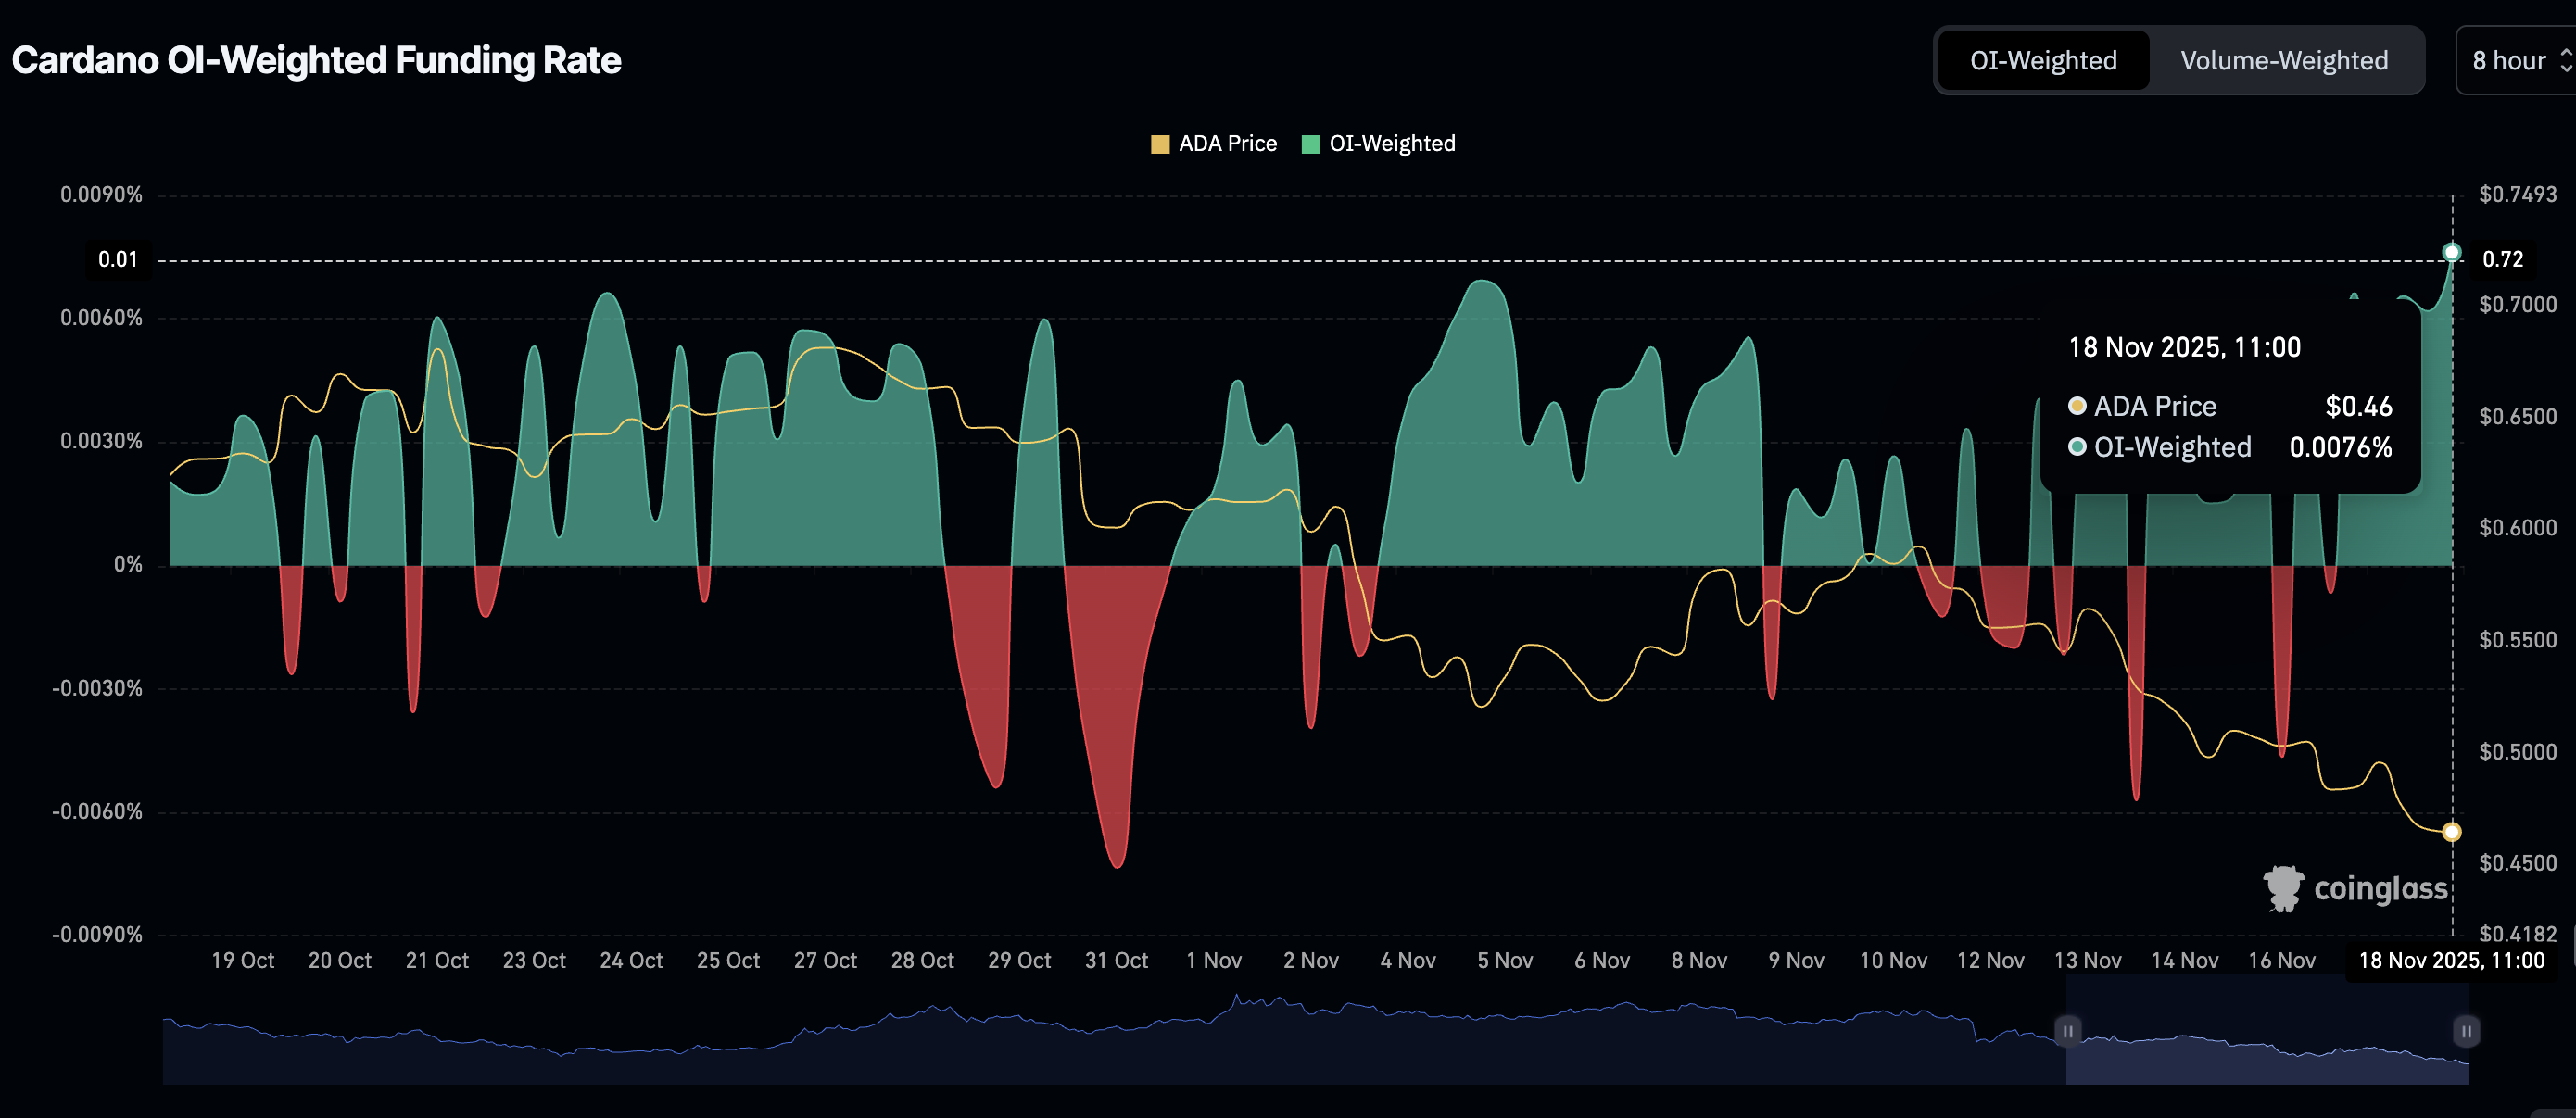
- Traders are increasingly piling into long positions in ADA, underpinning a steady increase in the funding rate.
Cardano (ADA) is largely in bearish hands, trading above support at $0.45 at the time of writing on Tuesday. The downtrend builds on a bearish outlook that has weighed on the smart contracts token since July, when ADA peaked at $1.02.
Cardano declines as retail investors exit
The Cardano derivatives market has remained significantly suppressed since the October 10 flash crash, which liquidated over $19 billion in crypto assets in a single day.
CoinGlass data shows that the futures Open Interest (OI) averages $638 million on Tuesday, from $1.51 billion on October 10. Before the violent deleveraging event, the OI, representing the notional value of outstanding futures contracts, reached $1.95 on September 14, marking a historical peak.
OI is used to gauge market interest in a token. Therefore, a steady decline – or even a prolonged period of sideways movement, as seen in recent weeks – indicates that investor confidence in ADA and its broader ecosystem has dropped significantly.
The OI-Weighed Funding Rate has risen to 0.0076%, signaling an increase in risk appetite. As traders pile into long positions in ADA, this metric rises, underpinning positive market sentiment. Higher readings support a steady recovery in the short to medium-term.
Technical outlook: Cardano stabilizes above key support
Cardano is trading above its immediate support at $0.45, as bulls step in to prevent the sell-off from deepening. The Relative Strength Index (RSI) at 29 on the daily chart is stabilizing, which may help reinforce the bullish case. Traders should watch for a potential recovery toward the bullish region above the midline, as this likely signals that bullish momentum is swelling.
Still, Cardano’s position below key moving averages, including the 50-day Exponential Moving Average (EMA) at $0.62, the 100-day EMA at $0.68, and the 200-day EMA near $0.72, reinforces the prevailing bearish outlook. The Moving Average Convergence Divergence (MACD) indicator on the same daily chart has upheld a sell signal since Sunday. The blue MACD line remaining below the red signal line is encouraging investors to reduce their exposure, which contributes to selling pressure.
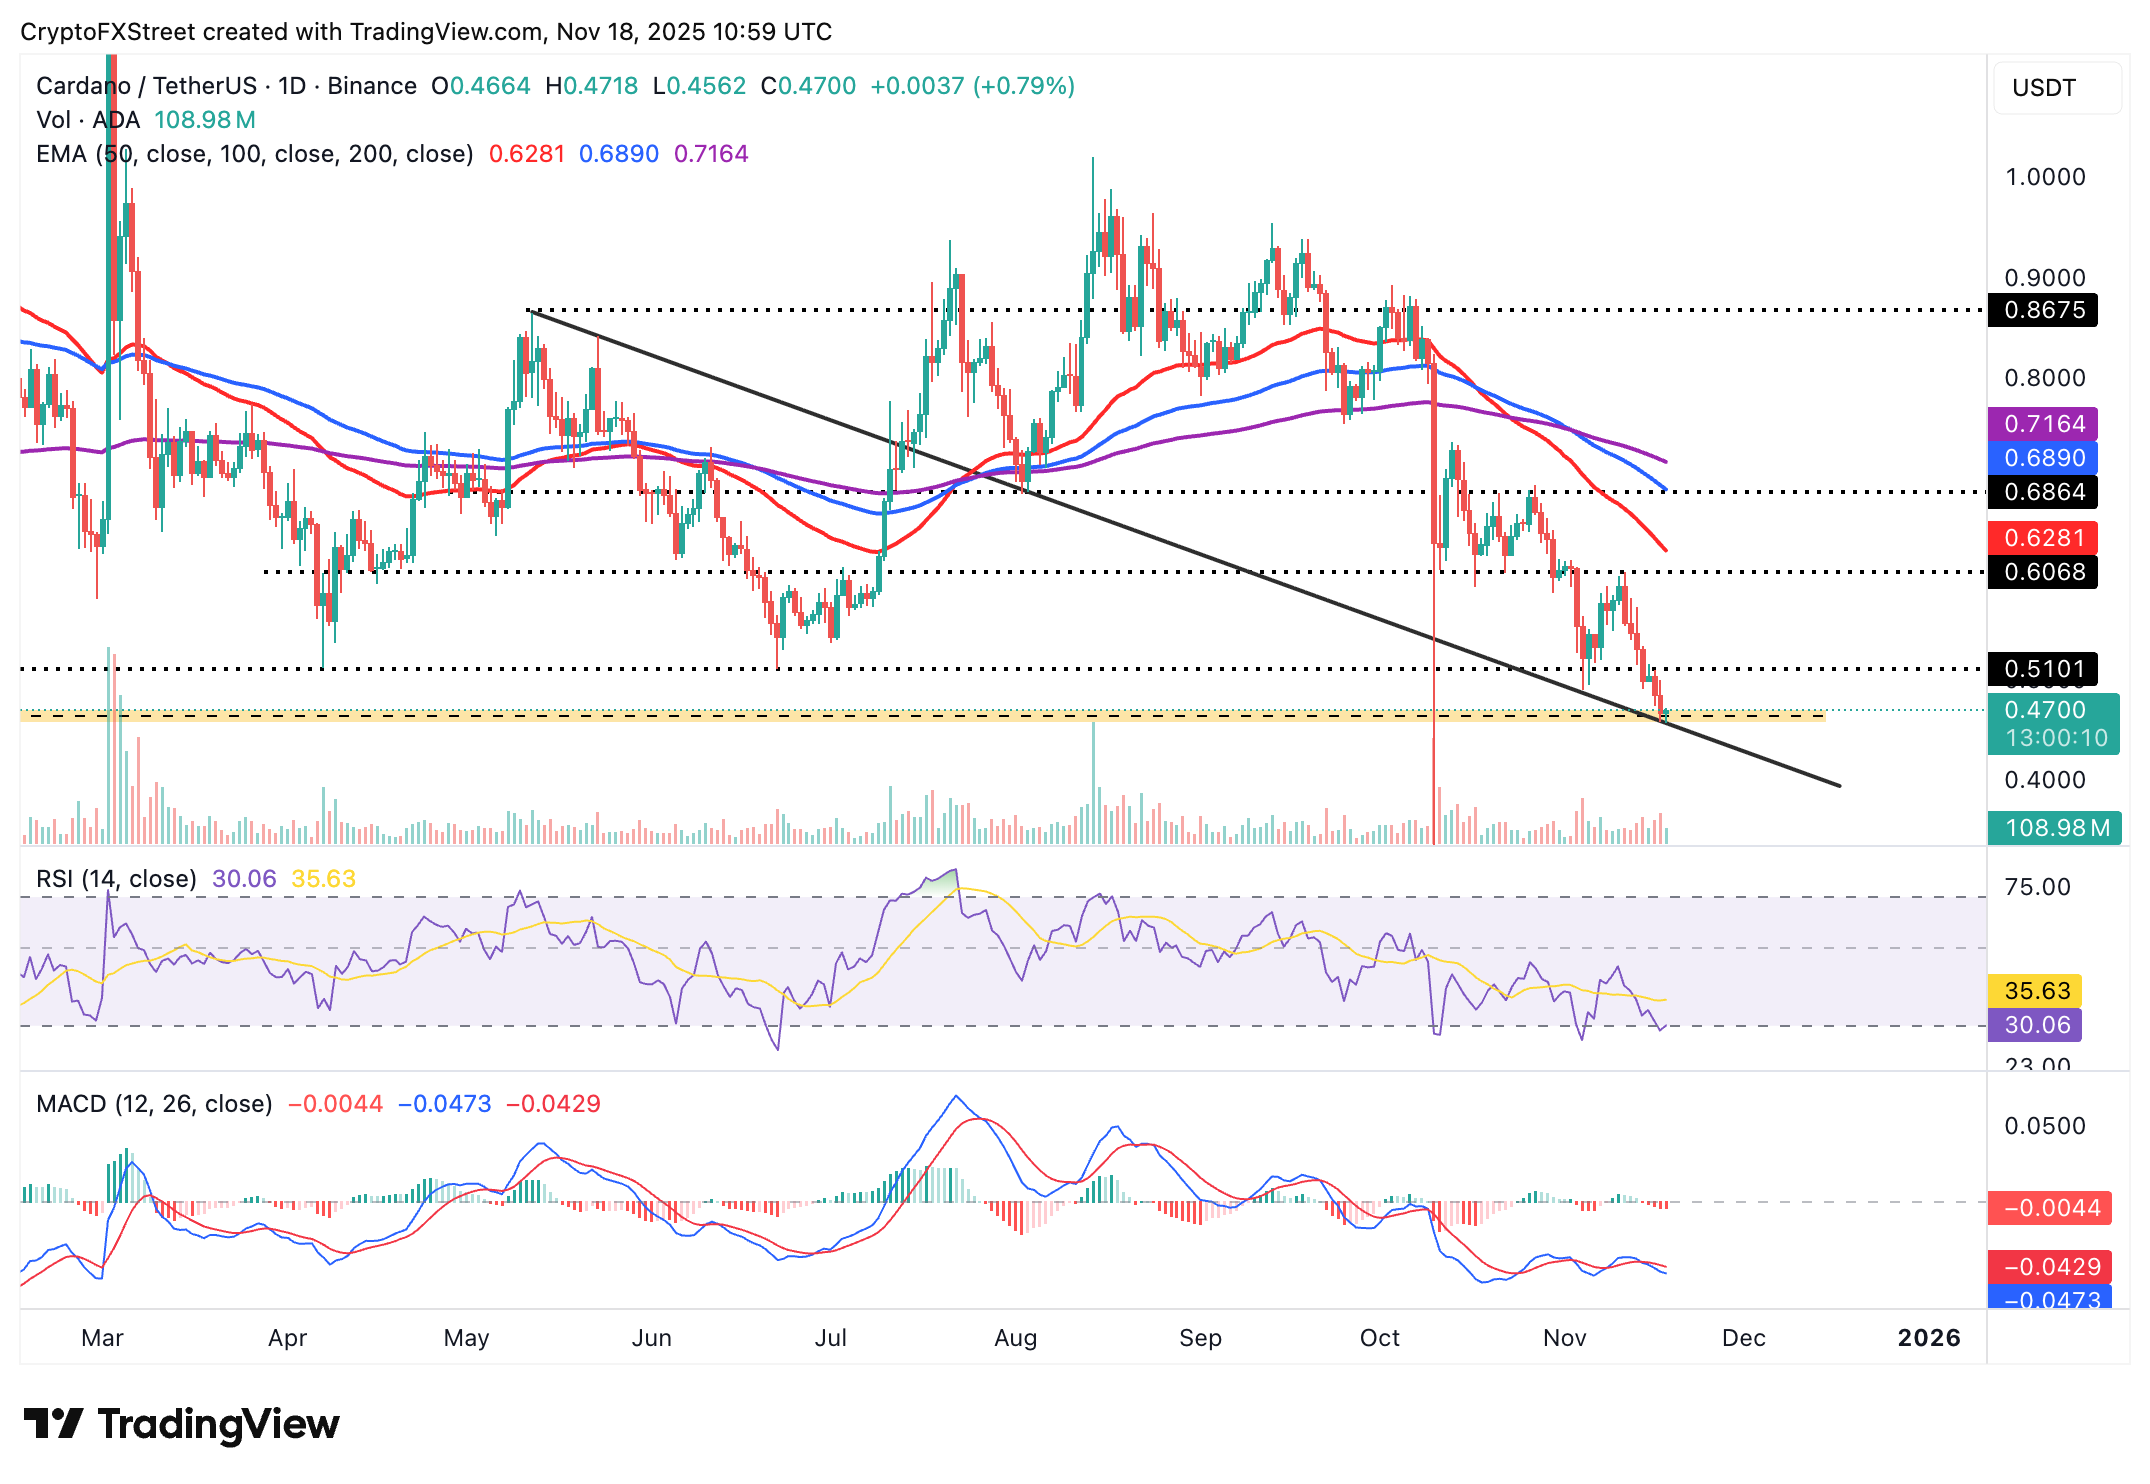
Cardano requires strong support from bulls to hold above its immediate support at $0.45. If traders embrace this support and pile into long positions, a recovery may ensue toward the 50-day EMA at $0.62.
Open Interest, funding rate FAQs
Higher Open Interest is associated with higher liquidity and new capital inflow to the market. This is considered the equivalent of increase in efficiency and the ongoing trend continues. When Open Interest decreases, it is considered a sign of liquidation in the market, investors are leaving and the overall demand for an asset is on a decline, fueling a bearish sentiment among investors.
Funding fees bridge the difference between spot prices and prices of futures contracts of an asset by increasing liquidation risks faced by traders. A consistently high and positive funding rate implies there is a bullish sentiment among market participants and there is an expectation of a price hike. A consistently negative funding rate for an asset implies a bearish sentiment, indicating that traders expect the cryptocurrency’s price to fall and a bearish trend reversal is likely to occur.

Acuity Trading
Ang Acuity Trading ay isang fintech na nakabase sa London na itinatag noong 2013, na dalubhasa sa AI-powered na alternative data at sentiment analysis para sa trading at investments. Inirebolusyon nila ang online trading experience gamit ang visual news at sentiment tools, at patuloy na nangunguna sa merkado sa pamamagitan ng alpha-generating alternative data at highly engaging trading tools gamit ang pinakabagong AI research at technology.
Read More


