
Trade The World
EUR/JPY price forecast: Falls toward 171.00 on signs of a potential bearish shift
Ni Akhtar Faruqui
Petsa ng Pag-publish: 14 Aug 2025 | Petsa ng Pag-edit: 14 Aug 2025


POPULAR ARTICLES

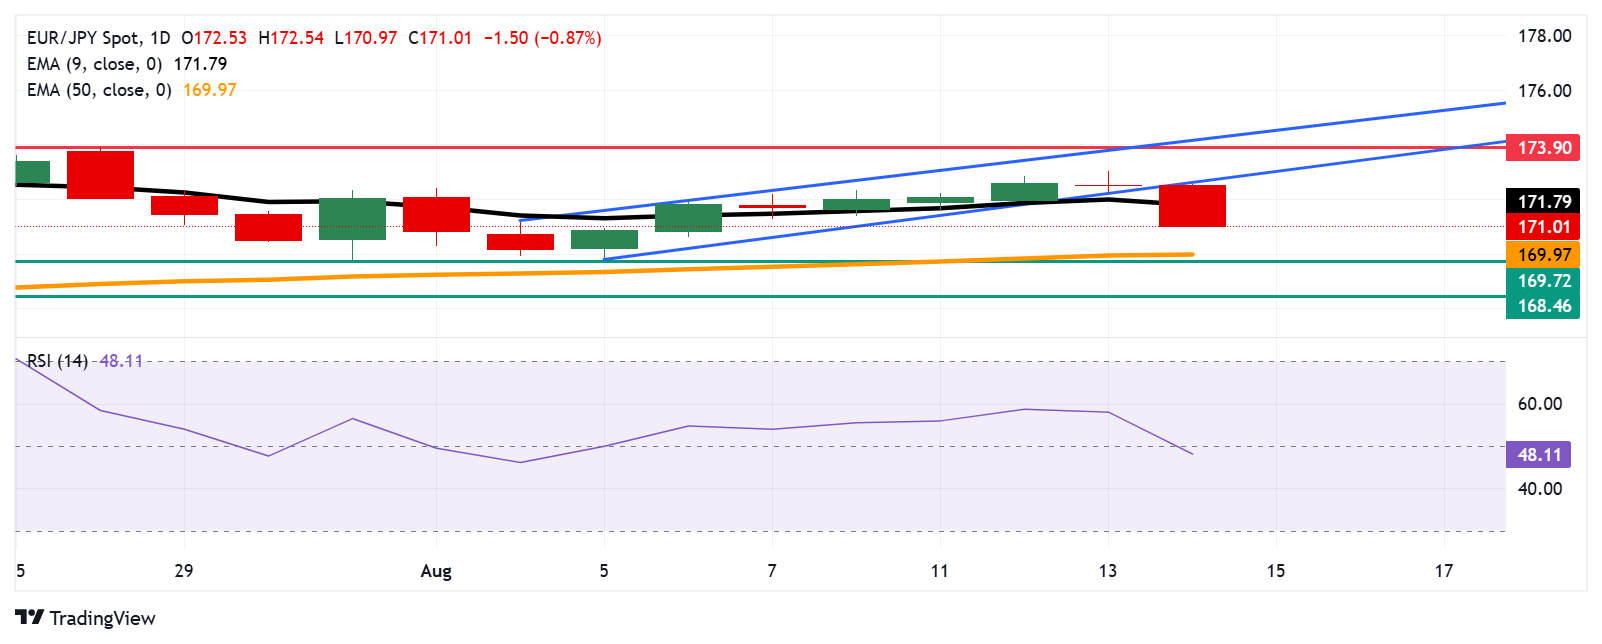
EUR/JPY depreciates more than 0.5%, trading around 171.20 during the European hours on Thursday. The technical analysis of the daily chart suggests a shift from bullish to bearish momentum as the currency cross has broken below the ascending channel pattern.
- EUR/JPY may find the primary support at the 50-day EMA of 169.98.
- A bearish shift appears as the currency cross broke below the ascending channel pattern.
- The immediate resistance appears at the nine-day EMA of 171.79.
EUR/JPY depreciates more than 0.5%, trading around 171.20 during the European hours on Thursday. The technical analysis of the daily chart suggests a shift from bullish to bearish momentum as the currency cross has broken below the ascending channel pattern.
The 14-day Relative Strength Index (RSI) is positioned below the 50 mark, suggesting a bearish is in play. Additionally, the short-term price momentum is weaker as the EUR/JPY cross moved below the nine-day Exponential Moving Average (EMA).
On the downside, the EUR/JPY cross may target the 50-day EMA at 169.97, followed by the six-week low at 169.72, which was recorded on July 31. A break below this level would prompt the currency cross to test the two-month low at 168.46, registered on July 1.
The EUR/JPY cross could test the immediate barrier at the nine-day EMA of 171.81. A break above this level would strengthen short-term price momentum, allowing the currency cross to re-enter the ascending channel, signaling a false breakout and a bullish recovery. Further advances would lead the currency cross to approach 173.90, the highest since July 2024, recorded on July 28, 2025, followed by the upper boundary of the ascending channel around 174.30.
EUR/JPY: Daily Chart
Euro PRICE Today
The table below shows the percentage change of Euro (EUR) against listed major currencies today. Euro was the weakest against the Japanese Yen.
| USD | EUR | GBP | JPY | CAD | AUD | NZD | CHF | |
|---|---|---|---|---|---|---|---|---|
| USD | 0.29% | 0.01% | -0.57% | 0.16% | 0.28% | 0.48% | 0.23% | |
| EUR | -0.29% | -0.25% | -0.86% | -0.14% | -0.02% | 0.17% | -0.07% | |
| GBP | -0.01% | 0.25% | -0.62% | 0.22% | 0.30% | 0.53% | 0.28% | |
| JPY | 0.57% | 0.86% | 0.62% | 0.76% | 0.85% | 0.95% | 0.76% | |
| CAD | -0.16% | 0.14% | -0.22% | -0.76% | 0.16% | 0.32% | 0.07% | |
| AUD | -0.28% | 0.02% | -0.30% | -0.85% | -0.16% | 0.23% | -0.13% | |
| NZD | -0.48% | -0.17% | -0.53% | -0.95% | -0.32% | -0.23% | -0.29% | |
| CHF | -0.23% | 0.07% | -0.28% | -0.76% | -0.07% | 0.13% | 0.29% |
The heat map shows percentage changes of major currencies against each other. The base currency is picked from the left column, while the quote currency is picked from the top row. For example, if you pick the Euro from the left column and move along the horizontal line to the US Dollar, the percentage change displayed in the box will represent EUR (base)/USD (quote).

Acuity Trading
Ang Acuity Trading ay isang fintech na nakabase sa London na itinatag noong 2013, na dalubhasa sa AI-powered na alternative data at sentiment analysis para sa trading at investments. Inirebolusyon nila ang online trading experience gamit ang visual news at sentiment tools, at patuloy na nangunguna sa merkado sa pamamagitan ng alpha-generating alternative data at highly engaging trading tools gamit ang pinakabagong AI research at technology.
Read More


