
Trade The World
NZD/USD Price Forecast: Stalls near 200-SMA, bearish bias emerges
Ni Christian Borjon Valencia
Petsa ng Pag-publish: 3 Oct 2025 | Petsa ng Pag-edit: 3 Oct 2025


POPULAR ARTICLES

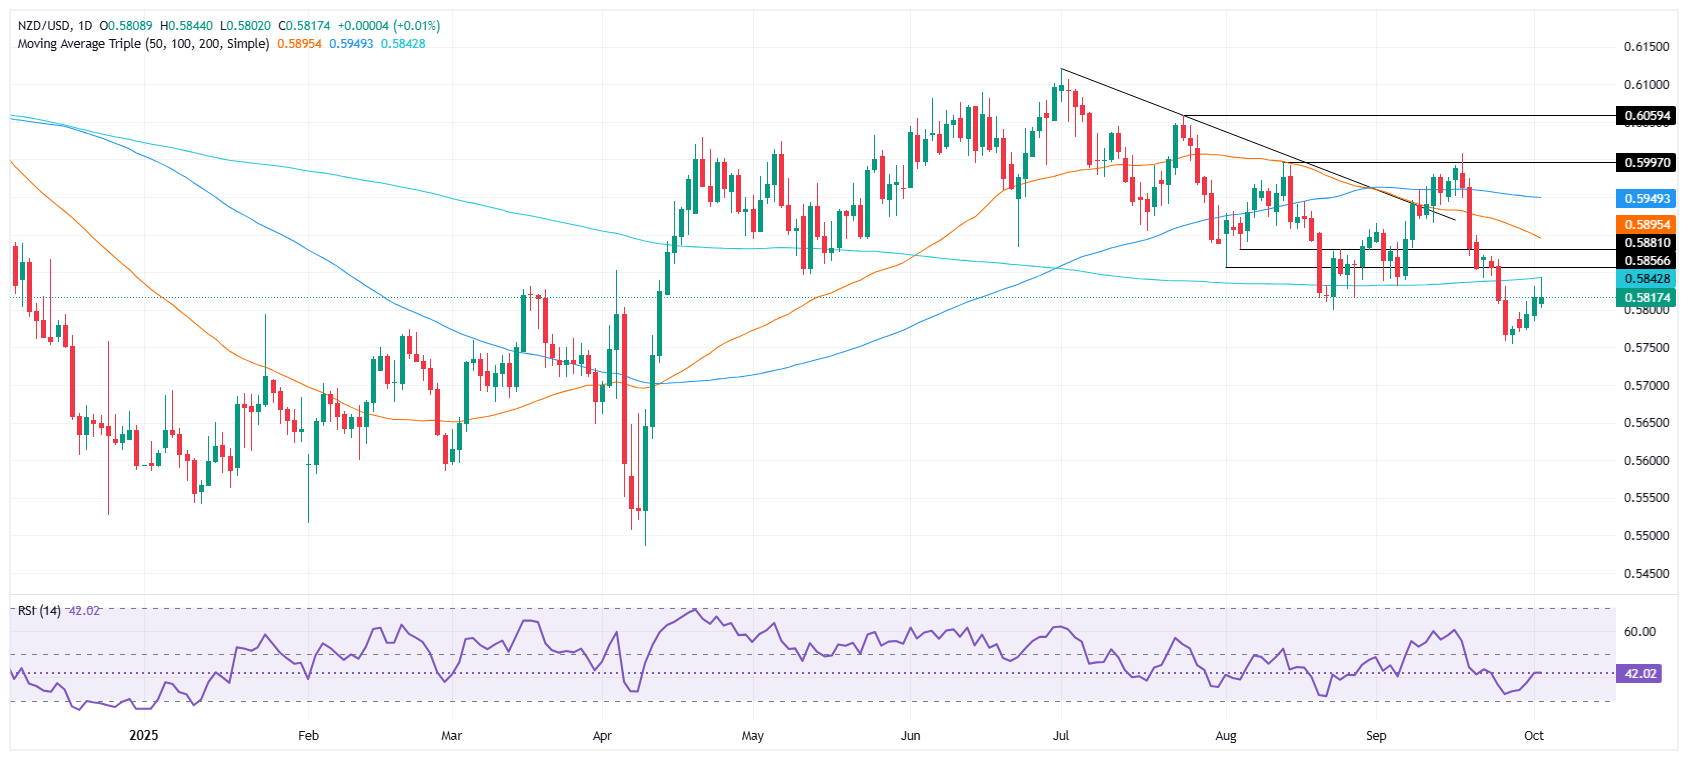
The NZD/USD reversed its course on Thursday as it formed a doji after hitting weekly highs near the 200-day Simple Moving Average (SMA) of 0.5845, but it reversed, ending the day virtually unchanged at around 0.5816.
- NZD/USD capped by strong resistance at 200-day SMA as doji signals exhaustion, leaving downside risks toward 0.5700.
- Relative Strength Index remains bearish but flattish, hinting at neutral momentum tilted toward further weakness.
- Bulls need a clean break above 0.5845 to target 0.5875–0.5950 zone and flip short-term sentiment.
The NZD/USD reversed its course on Thursday as it formed a doji after hitting weekly highs near the 200-day Simple Moving Average (SMA) of 0.5845, but it reversed, ending the day virtually unchanged at around 0.5816.
NZD/USD Price Forecast: Bearishly biased, eyes on 0.5800
The NZD/USD technical picture shows that the leg-up that started on September 26 at around 0.5754, seems to face stir resistance. This opens the door for sellers, which could lean onto the 200-day SMA, as they eye September 26 low, followed by 0.5700, ahead of challenging the yearly low of 0.5485.
Momentum as measured by the Relative Strength Index (RSI) is bearish, but as the line is flattish, it indicates that the NZD/USD bias is neutral but tilted to the downside.
For a bullish reversal, the NZD/USD must clear the 200-day SMA, which could exacerbate a rally toward the 20-day SMA at 0.5875, ahead of the 50-day SMA at 0.5891 and the 100-day SMA at 0.5948.
NZD/USD Price Chart – Daily
New Zealand Dollar Price This week
The table below shows the percentage change of New Zealand Dollar (NZD) against listed major currencies this week. New Zealand Dollar was the strongest against the Canadian Dollar.
| USD | EUR | GBP | JPY | CAD | AUD | NZD | CHF | |
|---|---|---|---|---|---|---|---|---|
| USD | -0.14% | -0.34% | -1.52% | 0.24% | -0.69% | -0.50% | -0.02% | |
| EUR | 0.14% | -0.20% | -1.54% | 0.36% | -0.55% | -0.35% | 0.10% | |
| GBP | 0.34% | 0.20% | -1.25% | 0.56% | -0.41% | -0.16% | 0.31% | |
| JPY | 1.52% | 1.54% | 1.25% | 1.80% | 0.88% | 0.91% | 1.56% | |
| CAD | -0.24% | -0.36% | -0.56% | -1.80% | -0.87% | -0.72% | -0.25% | |
| AUD | 0.69% | 0.55% | 0.41% | -0.88% | 0.87% | 0.19% | 0.65% | |
| NZD | 0.50% | 0.35% | 0.16% | -0.91% | 0.72% | -0.19% | 0.62% | |
| CHF | 0.02% | -0.10% | -0.31% | -1.56% | 0.25% | -0.65% | -0.62% |
The heat map shows percentage changes of major currencies against each other. The base currency is picked from the left column, while the quote currency is picked from the top row. For example, if you pick the New Zealand Dollar from the left column and move along the horizontal line to the US Dollar, the percentage change displayed in the box will represent NZD (base)/USD (quote).

Acuity Trading
Ang Acuity Trading ay isang fintech na nakabase sa London na itinatag noong 2013, na dalubhasa sa AI-powered na alternative data at sentiment analysis para sa trading at investments. Inirebolusyon nila ang online trading experience gamit ang visual news at sentiment tools, at patuloy na nangunguna sa merkado sa pamamagitan ng alpha-generating alternative data at highly engaging trading tools gamit ang pinakabagong AI research at technology.
Read More


