
Trade The World
NZD/USD Price Forecast: Tests nine-day EMA after breaking above 0.5800
Ni Akhtar Faruqui
Petsa ng Pag-publish: 1 Oct 2025 | Petsa ng Pag-edit: 1 Oct 2025


POPULAR ARTICLES

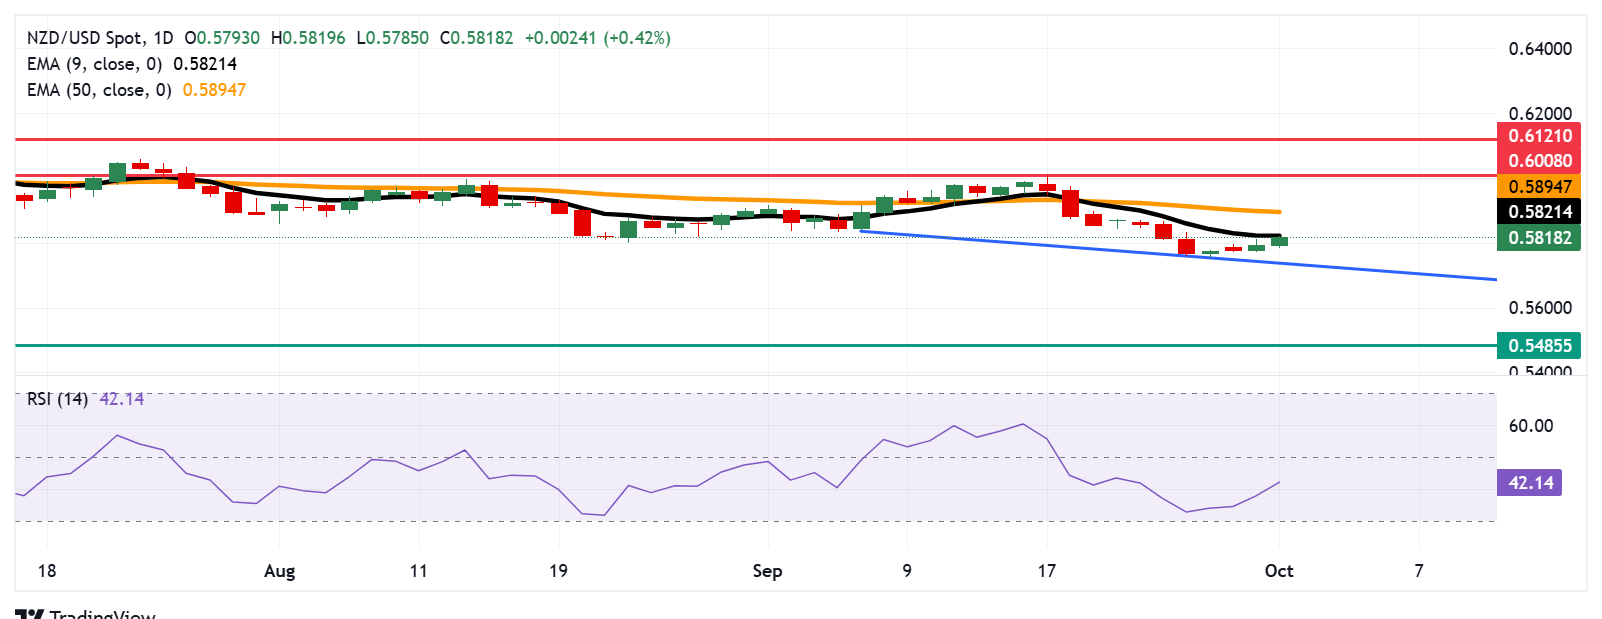
NZD/USD extends its gains for the second successive session, trading around 0.5810 during the European hours on Wednesday. The technical analysis of the daily chart indicates a weaker short-term price momentum as the pair remains below the nine-day Exponential Moving Average (EMA).
- NZD/USD may find its primary support at the downward trendline around 0.5750.
- The market sentiment remains bearish as the 14-day RSI stays firmly below the 50 mark.
- The immediate barrier lies at the nine-day EMA of 0.5821.
NZD/USD extends its gains for the second successive session, trading around 0.5810 during the European hours on Wednesday. The technical analysis of the daily chart indicates a weaker short-term price momentum as the pair remains below the nine-day Exponential Moving Average (EMA).
Additionally, the 14-day Relative Strength Index (RSI) is positioned below the 50 mark, strengthening the prevailing bearish bias.
On the downside, the NZD/USD pair could find its initial support at the downward trendline around the crucial level of 0.5750. A break below the trendline would open the doors for the pair to navigate the area around 0.5485, the lowest level since March 2020, which was recorded on April 9, 2025.
The NZD/USD pair is testing its immediate barrier at the nine-day EMA of 0.5821, followed by the 50-day EMA at 0.5894. A break above these levels would improve the short- and medium-term price momentum and lead the pair to test the three-month high of 0.6008, reached on September 17, followed by 0.6121, the highest since October 2024.
NZD/USD: Daily Chart
New Zealand Dollar Price Today
The table below shows the percentage change of New Zealand Dollar (NZD) against listed major currencies today. New Zealand Dollar was the strongest against the US Dollar.
| USD | EUR | GBP | JPY | CAD | AUD | NZD | CHF | |
|---|---|---|---|---|---|---|---|---|
| USD | -0.19% | -0.23% | -0.59% | -0.02% | -0.07% | -0.42% | -0.21% | |
| EUR | 0.19% | -0.02% | -0.40% | 0.17% | 0.15% | -0.20% | -0.02% | |
| GBP | 0.23% | 0.02% | -0.36% | 0.20% | 0.18% | -0.18% | 0.00% | |
| JPY | 0.59% | 0.40% | 0.36% | 0.59% | 0.50% | 0.40% | 0.47% | |
| CAD | 0.02% | -0.17% | -0.20% | -0.59% | -0.05% | -0.39% | -0.20% | |
| AUD | 0.07% | -0.15% | -0.18% | -0.50% | 0.05% | -0.35% | -0.17% | |
| NZD | 0.42% | 0.20% | 0.18% | -0.40% | 0.39% | 0.35% | 0.18% | |
| CHF | 0.21% | 0.02% | -0.00% | -0.47% | 0.20% | 0.17% | -0.18% |
The heat map shows percentage changes of major currencies against each other. The base currency is picked from the left column, while the quote currency is picked from the top row. For example, if you pick the New Zealand Dollar from the left column and move along the horizontal line to the US Dollar, the percentage change displayed in the box will represent NZD (base)/USD (quote).

Acuity Trading
Ang Acuity Trading ay isang fintech na nakabase sa London na itinatag noong 2013, na dalubhasa sa AI-powered na alternative data at sentiment analysis para sa trading at investments. Inirebolusyon nila ang online trading experience gamit ang visual news at sentiment tools, at patuloy na nangunguna sa merkado sa pamamagitan ng alpha-generating alternative data at highly engaging trading tools gamit ang pinakabagong AI research at technology.
Read More


