
Trade The World
Silver Price Forecast: XAG/USD dips toward 50-day EMA near $37.00
Ni Akhtar Faruqui
Petsa ng Pag-publish: 20 Aug 2025 | Petsa ng Pag-edit: 20 Aug 2025


POPULAR ARTICLES

Silver price (XAG/USD) extends its losing streak for the fifth consecutive session, trading around $37.20 per troy ounce during the Asian hours on Wednesday.
- Silver price may test the immediate support at the 50-day EMA of $37.11.
- The bearish bias strengthens as the 14-day Relative Strength Index remains below the 50 level.
- The primary barrier appears at the nine-day EMA of $37.75.
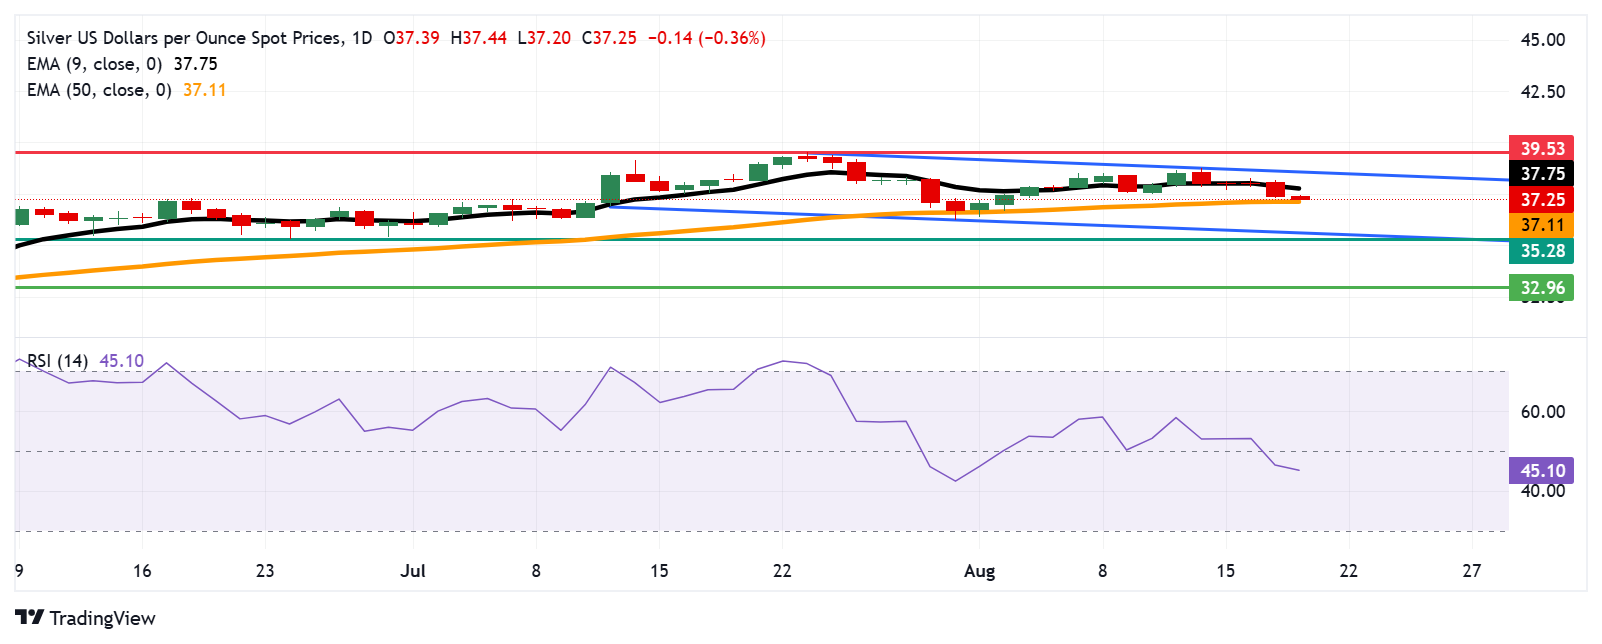
Silver price (XAG/USD) extends its losing streak for the fifth consecutive session, trading around $37.20 per troy ounce during the Asian hours on Wednesday. The technical analysis of the daily chart suggests the price of the precious metal consolidates within a descending channel pattern, indicating a prevailing bearish bias.
The 14-day Relative Strength Index (RSI) is positioned below the 50 level, strengthening the bearish bias. Additionally, the Silver price is trading below the nine-day Exponential Moving Average (EMA), indicating that short-term price momentum is weaker.
On the downside, the Silver price may target the immediate support at the 50-day EMA of $37.11. A break below this level would weaken the medium-term price momentum and put downward pressure on the XAG/USD pair to the descending channel’s lower boundary around $35.70, followed by the 11-week low at $35.28, recorded on June 24. Further declines would strengthen the bearish bias and prompt the Silver price to a three-month low at $32.96.
The XAG/USD pair may find its initial barrier at the nine-day EMA of $37.75, followed by the upper boundary of the descending channel around $38.70. A break above this crucial resistance zone could cause the emergence of the bullish bias and support the Silver price to explore the region around $39.53, the highest since September 2011, reached on July 23.
XAG/USD: Daily Chart
Silver FAQs
Silver is a precious metal highly traded among investors. It has been historically used as a store of value and a medium of exchange. Although less popular than Gold, traders may turn to Silver to diversify their investment portfolio, for its intrinsic value or as a potential hedge during high-inflation periods. Investors can buy physical Silver, in coins or in bars, or trade it through vehicles such as Exchange Traded Funds, which track its price on international markets.
Silver prices can move due to a wide range of factors. Geopolitical instability or fears of a deep recession can make Silver price escalate due to its safe-haven status, although to a lesser extent than Gold's. As a yieldless asset, Silver tends to rise with lower interest rates. Its moves also depend on how the US Dollar (USD) behaves as the asset is priced in dollars (XAG/USD). A strong Dollar tends to keep the price of Silver at bay, whereas a weaker Dollar is likely to propel prices up. Other factors such as investment demand, mining supply – Silver is much more abundant than Gold – and recycling rates can also affect prices.
Silver is widely used in industry, particularly in sectors such as electronics or solar energy, as it has one of the highest electric conductivity of all metals – more than Copper and Gold. A surge in demand can increase prices, while a decline tends to lower them. Dynamics in the US, Chinese and Indian economies can also contribute to price swings: for the US and particularly China, their big industrial sectors use Silver in various processes; in India, consumers’ demand for the precious metal for jewellery also plays a key role in setting prices.
Silver prices tend to follow Gold's moves. When Gold prices rise, Silver typically follows suit, as their status as safe-haven assets is similar. The Gold/Silver ratio, which shows the number of ounces of Silver needed to equal the value of one ounce of Gold, may help to determine the relative valuation between both metals. Some investors may consider a high ratio as an indicator that Silver is undervalued, or Gold is overvalued. On the contrary, a low ratio might suggest that Gold is undervalued relative to Silver.

Acuity Trading
Ang Acuity Trading ay isang fintech na nakabase sa London na itinatag noong 2013, na dalubhasa sa AI-powered na alternative data at sentiment analysis para sa trading at investments. Inirebolusyon nila ang online trading experience gamit ang visual news at sentiment tools, at patuloy na nangunguna sa merkado sa pamamagitan ng alpha-generating alternative data at highly engaging trading tools gamit ang pinakabagong AI research at technology.
Read More


