
Silver Price Forecast: XAG/USD range-bound as RSI holds near 50 and MACD flattens
Ni Vishal Chaturvedi
Petsa ng Pag-publish: 7 Mar 2026 | Petsa ng Pag-edit: 7 Mar 2026


Sikat na Artikulo

Silver (XAG/USD) trades modestly higher on Friday as the US Dollar (USD) and Treasury yields ease following softer-than-expected US Nonfarm Payrolls (NFP) data. Despite the intraday bounce, the white metal remains on track for its first weekly decline in three weeks.
- Silver rebounds as softer US NFP weighs on the US Dollar and Treasury yields.
- US-Iran conflict keeps geopolitical risk elevated and supports safe-haven demand.
- XAG/USD consolidates near the 20-day SMA after retreating from the upper Bollinger Band.
Silver (XAG/USD) trades modestly higher on Friday as the US Dollar (USD) and Treasury yields ease following softer-than-expected US Nonfarm Payrolls (NFP) data. Despite the intraday bounce, the white metal remains on track for its first weekly decline in three weeks.
At the time of writing, XAG/USD is trading around $84.27, up nearly 2.73% on the day after rebounding from a daily low near $80.17.
Meanwhile, the escalating US-Iran conflict continues to offer some underlying support to safe-haven assets, helping limit deeper losses in Silver.
However, rising Oil prices driven by supply disruptions through the Strait of Hormuz are fueling global inflation concerns. As a result, traders are trimming expectations for Federal Reserve (Fed) interest rate cuts, which tends to weigh on the non-yielding metal.
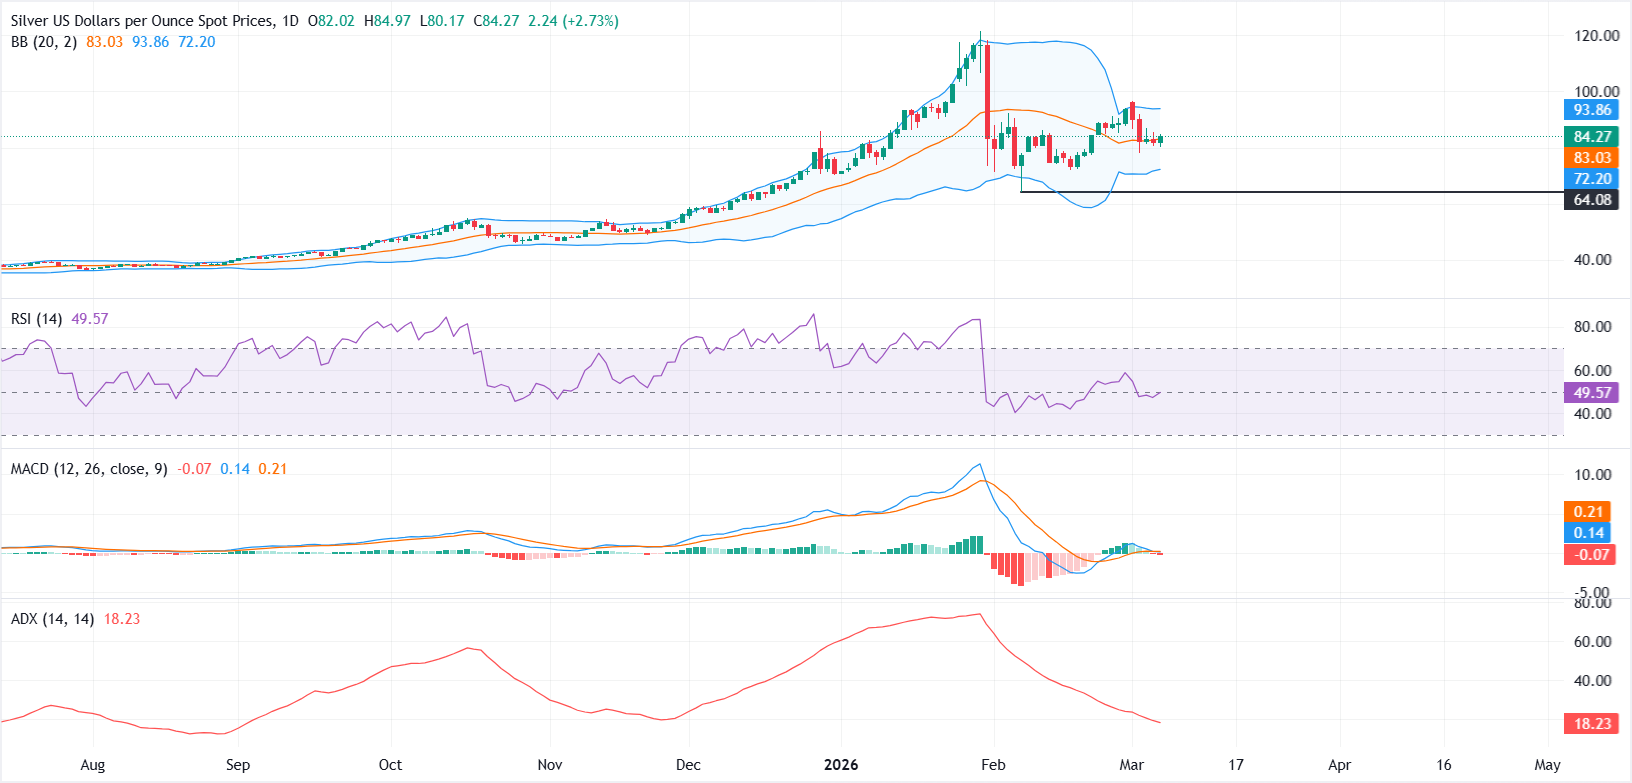
From a technical perspective, Silver is showing signs of consolidation after retreating from the upper Bollinger Band earlier this week. On the daily chart, price action is attempting to stabilise around the middle Bollinger Band near $83, which also serves as the 20-day Simple Moving Average (SMA), keeping the near-term bias neutral to slightly bullish.
Momentum indicators point to a lack of strong directional conviction. The Relative Strength Index (RSI) is hovering near the 50 mark, suggesting balanced momentum after the recent pullback.
The Moving Average Convergence Divergence (MACD) indicator (12, 26, close, 9) is flattening near the zero line, suggesting fading bearish momentum, though the MACD line remains slightly below the signal line.
The Average Directional Index (ADX) is trending lower near 18, indicating weakening trend strength and reinforcing the view that the market has shifted into a range-bound phase.
On the downside, a decisive break below the middle Bollinger Band could expose the lower Bollinger Band around $72 as the next support level, followed by the February swing low near $64.08.
On the upside, a clear break above the upper Bollinger Band near $93.86 would be needed to attract fresh buying interest. A move beyond this level could open the door toward the $100 psychological mark, which may cap gains initially before a potential extension toward a retest of the all-time high near $121.66.
Silver FAQs
Silver is a precious metal highly traded among investors. It has been historically used as a store of value and a medium of exchange. Although less popular than Gold, traders may turn to Silver to diversify their investment portfolio, for its intrinsic value or as a potential hedge during high-inflation periods. Investors can buy physical Silver, in coins or in bars, or trade it through vehicles such as Exchange Traded Funds, which track its price on international markets.
Silver prices can move due to a wide range of factors. Geopolitical instability or fears of a deep recession can make Silver price escalate due to its safe-haven status, although to a lesser extent than Gold's. As a yieldless asset, Silver tends to rise with lower interest rates. Its moves also depend on how the US Dollar (USD) behaves as the asset is priced in dollars (XAG/USD). A strong Dollar tends to keep the price of Silver at bay, whereas a weaker Dollar is likely to propel prices up. Other factors such as investment demand, mining supply – Silver is much more abundant than Gold – and recycling rates can also affect prices.
Silver is widely used in industry, particularly in sectors such as electronics or solar energy, as it has one of the highest electric conductivity of all metals – more than Copper and Gold. A surge in demand can increase prices, while a decline tends to lower them. Dynamics in the US, Chinese and Indian economies can also contribute to price swings: for the US and particularly China, their big industrial sectors use Silver in various processes; in India, consumers’ demand for the precious metal for jewellery also plays a key role in setting prices.
Silver prices tend to follow Gold's moves. When Gold prices rise, Silver typically follows suit, as their status as safe-haven assets is similar. The Gold/Silver ratio, which shows the number of ounces of Silver needed to equal the value of one ounce of Gold, may help to determine the relative valuation between both metals. Some investors may consider a high ratio as an indicator that Silver is undervalued, or Gold is overvalued. On the contrary, a low ratio might suggest that Gold is undervalued relative to Silver.

Ang Acuity Trading ay isang fintech na nakabase sa London na itinatag noong 2013, na dalubhasa sa AI-powered na alternative data at sentiment analysis para sa trading at investments. Inirebolusyon nila ang online trading experience gamit ang visual news at sentiment tools, at patuloy na nangunguna sa merkado sa pamamagitan ng alpha-generating alternative data at highly engaging trading tools gamit ang pinakabagong AI research at technology.
Magbasa pa


