


- Trust Wallet Token and 1inch experience a rise in user activity, with increased active users and network growth, respectively.
- A sharp increase in 1inch weekly trading volume and a steady follow-through in Trust Wallet Token indicate renewed interest.
- The technical outlook for Trust Wallet Token and 1inch indicates underlying bullish potential, suggesting a potential rally.
Trust Wallet Token (TWT) and 1inch (1INCH) are extending the short-term recovery on Friday following a sell-off at the start of the week. TWT and 1INCH show increasing bullish momentum on the daily chart as on-chain data reveals renewed user interest and trading volume.
Furthermore, the technical outlook of TWT and 1INCH indicates a bullish incline as they bounce off key support levels.
The renewed interest in Trust Wallet Token and 1inch
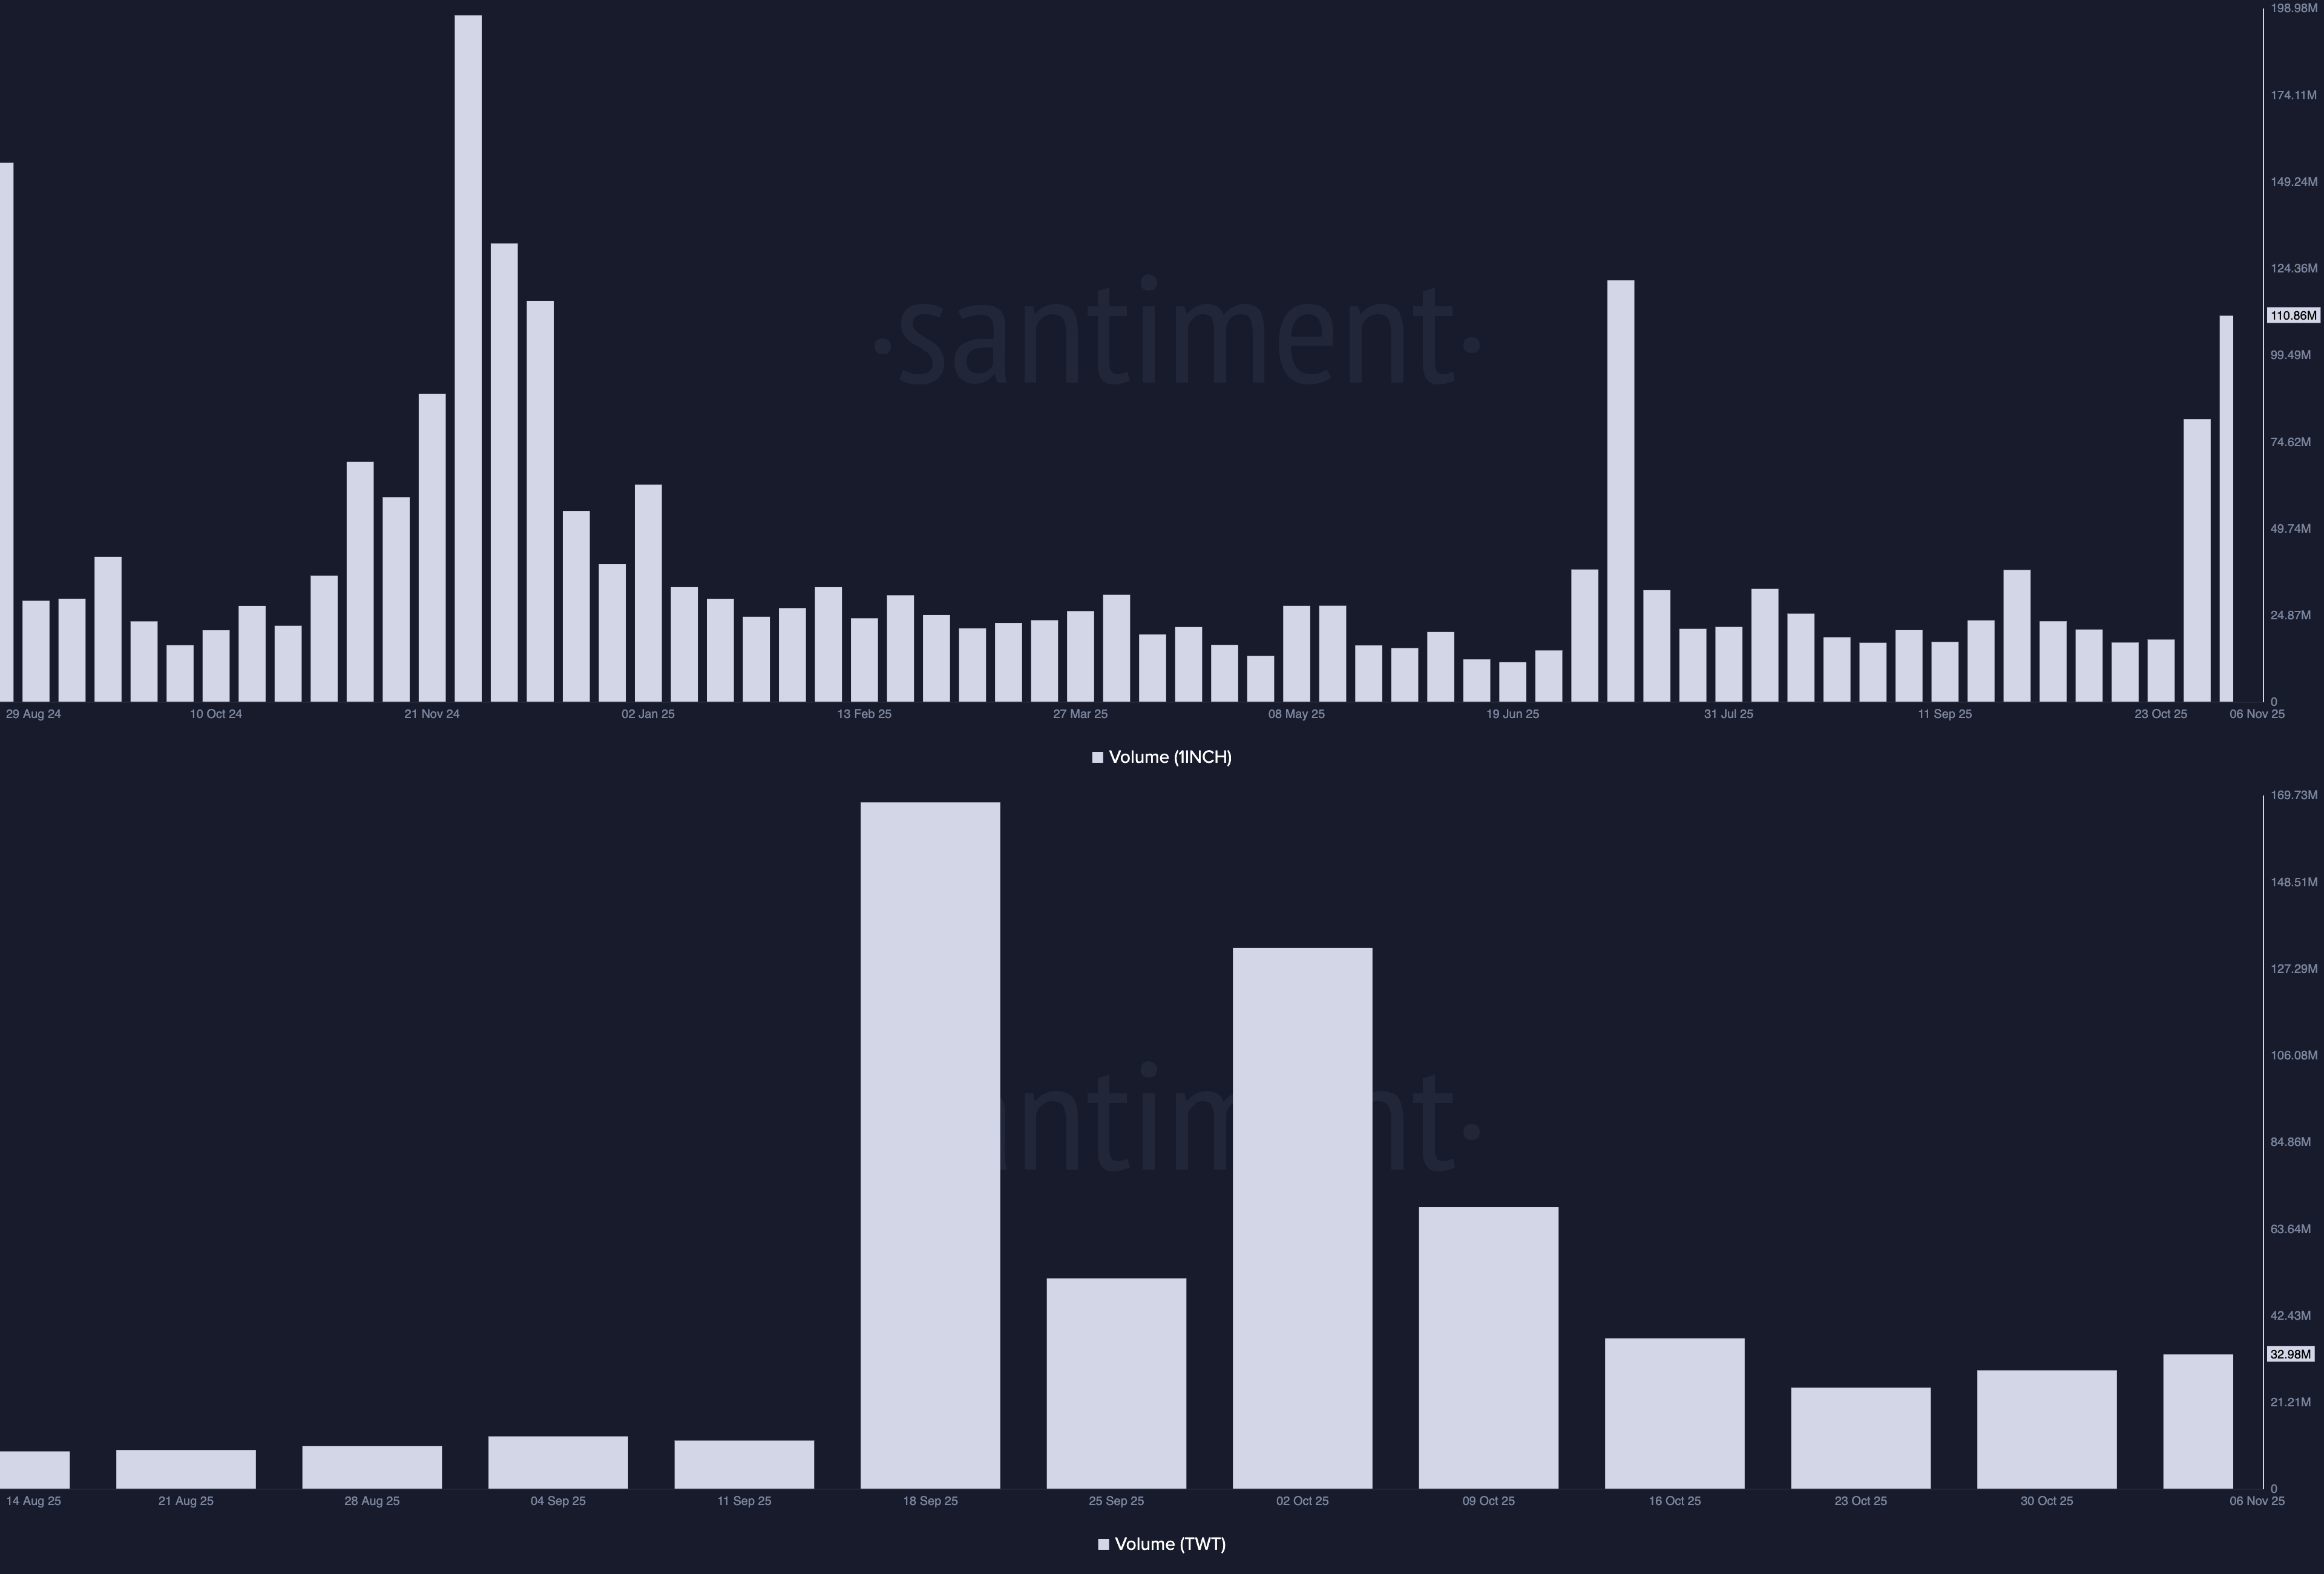
Financial trading volume is a key indicator for detecting renewed interest in an asset. Typically, an increase in trading volume accompanied by a price surge indicates a surge in demand, as traders are willing to pay higher prices to acquire the asset.
In the case of 1INCH, the weekly trading volume stands at $110.86 million so far this week, up from $81.21 million the previous one. Similarly, the TWT weekly volume is regaining strength, reaching $32.98 million so far, marking its second successive rise.
Still, the integration of 1inch’s aggregator on the Trust Wallet ecosystem increases the possibility of both crypto rising in tandem.
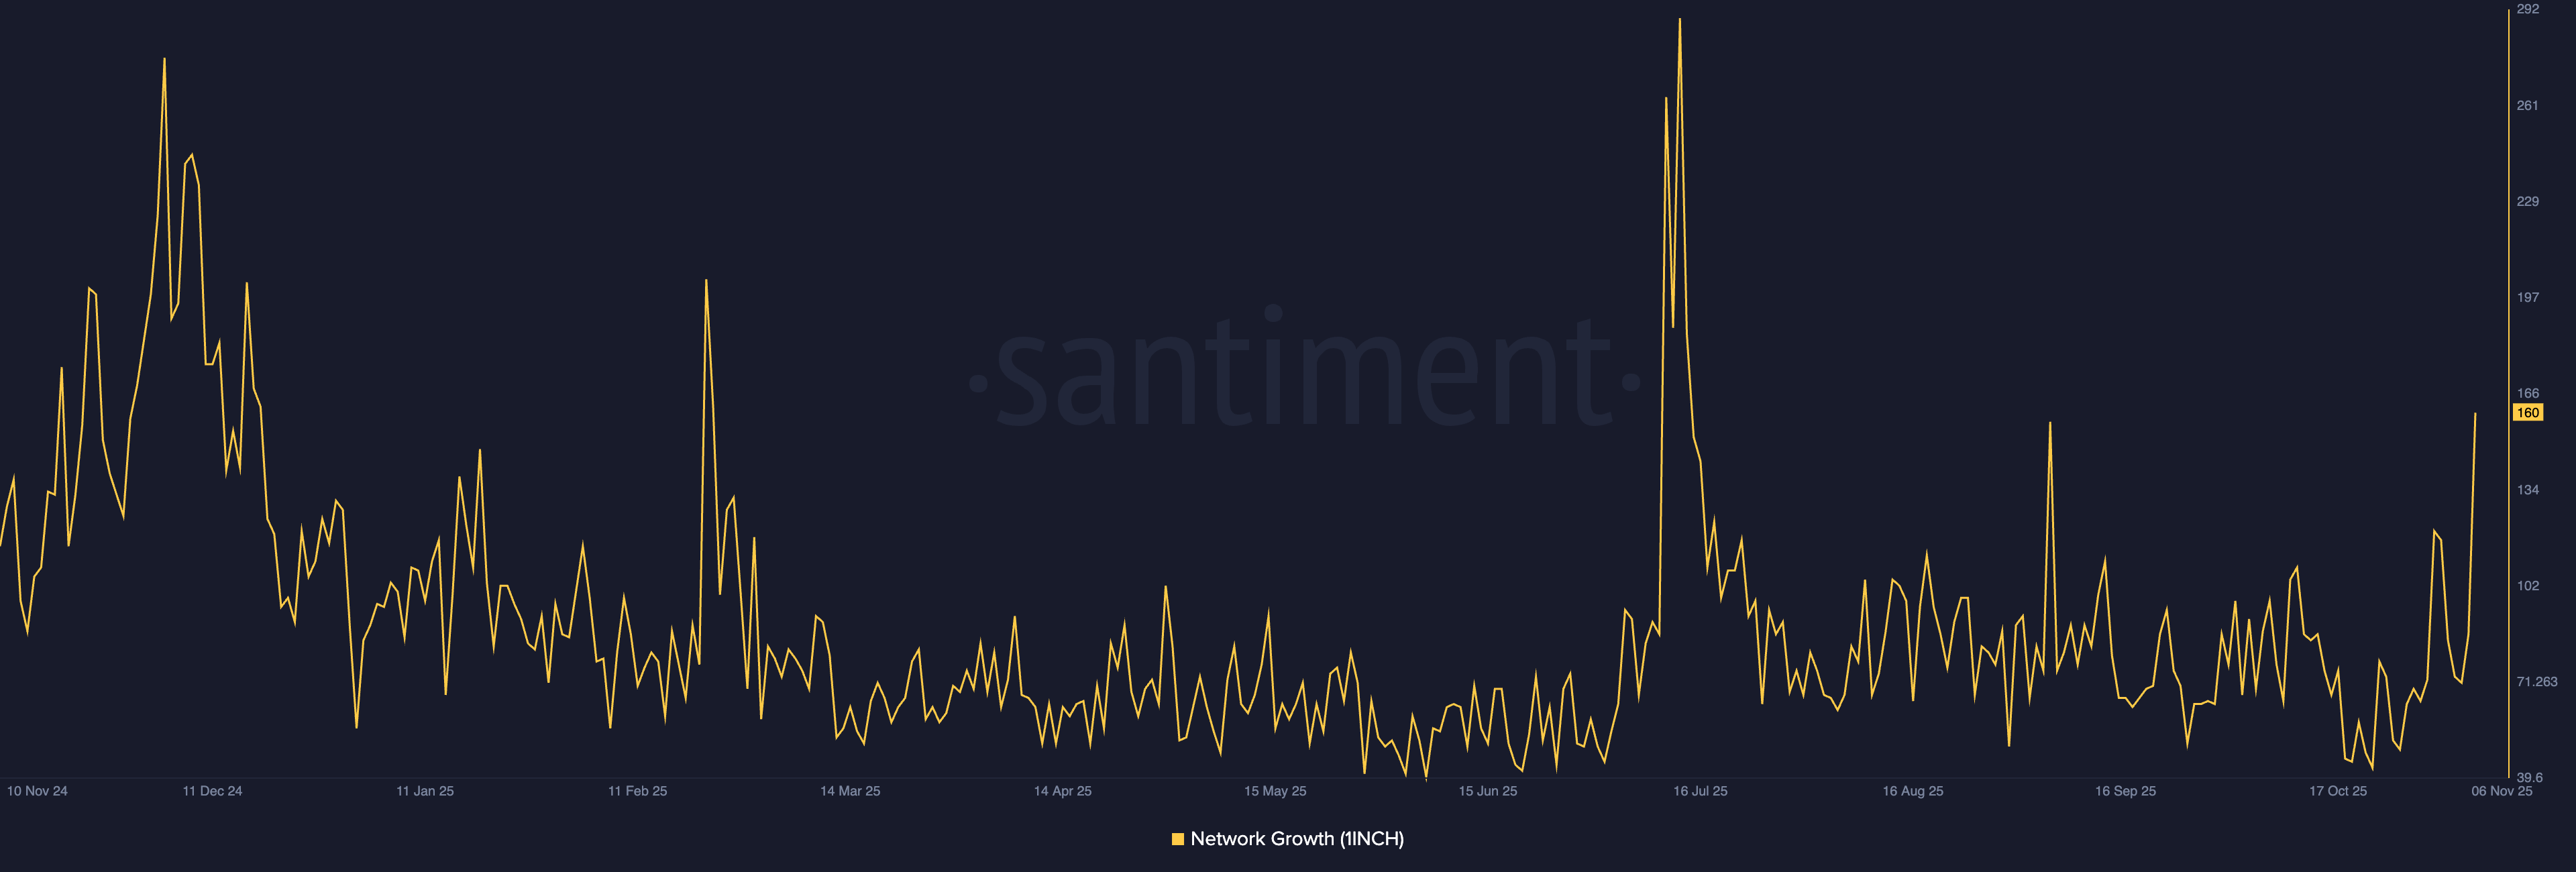
On a more positive note, Santiment’s data shows that the network growth – user adoption and activity tracker – of 1inch increased to 160 on Thursday, surpassing the rise to 157 on September 5 and reaching its highest since mid-July.
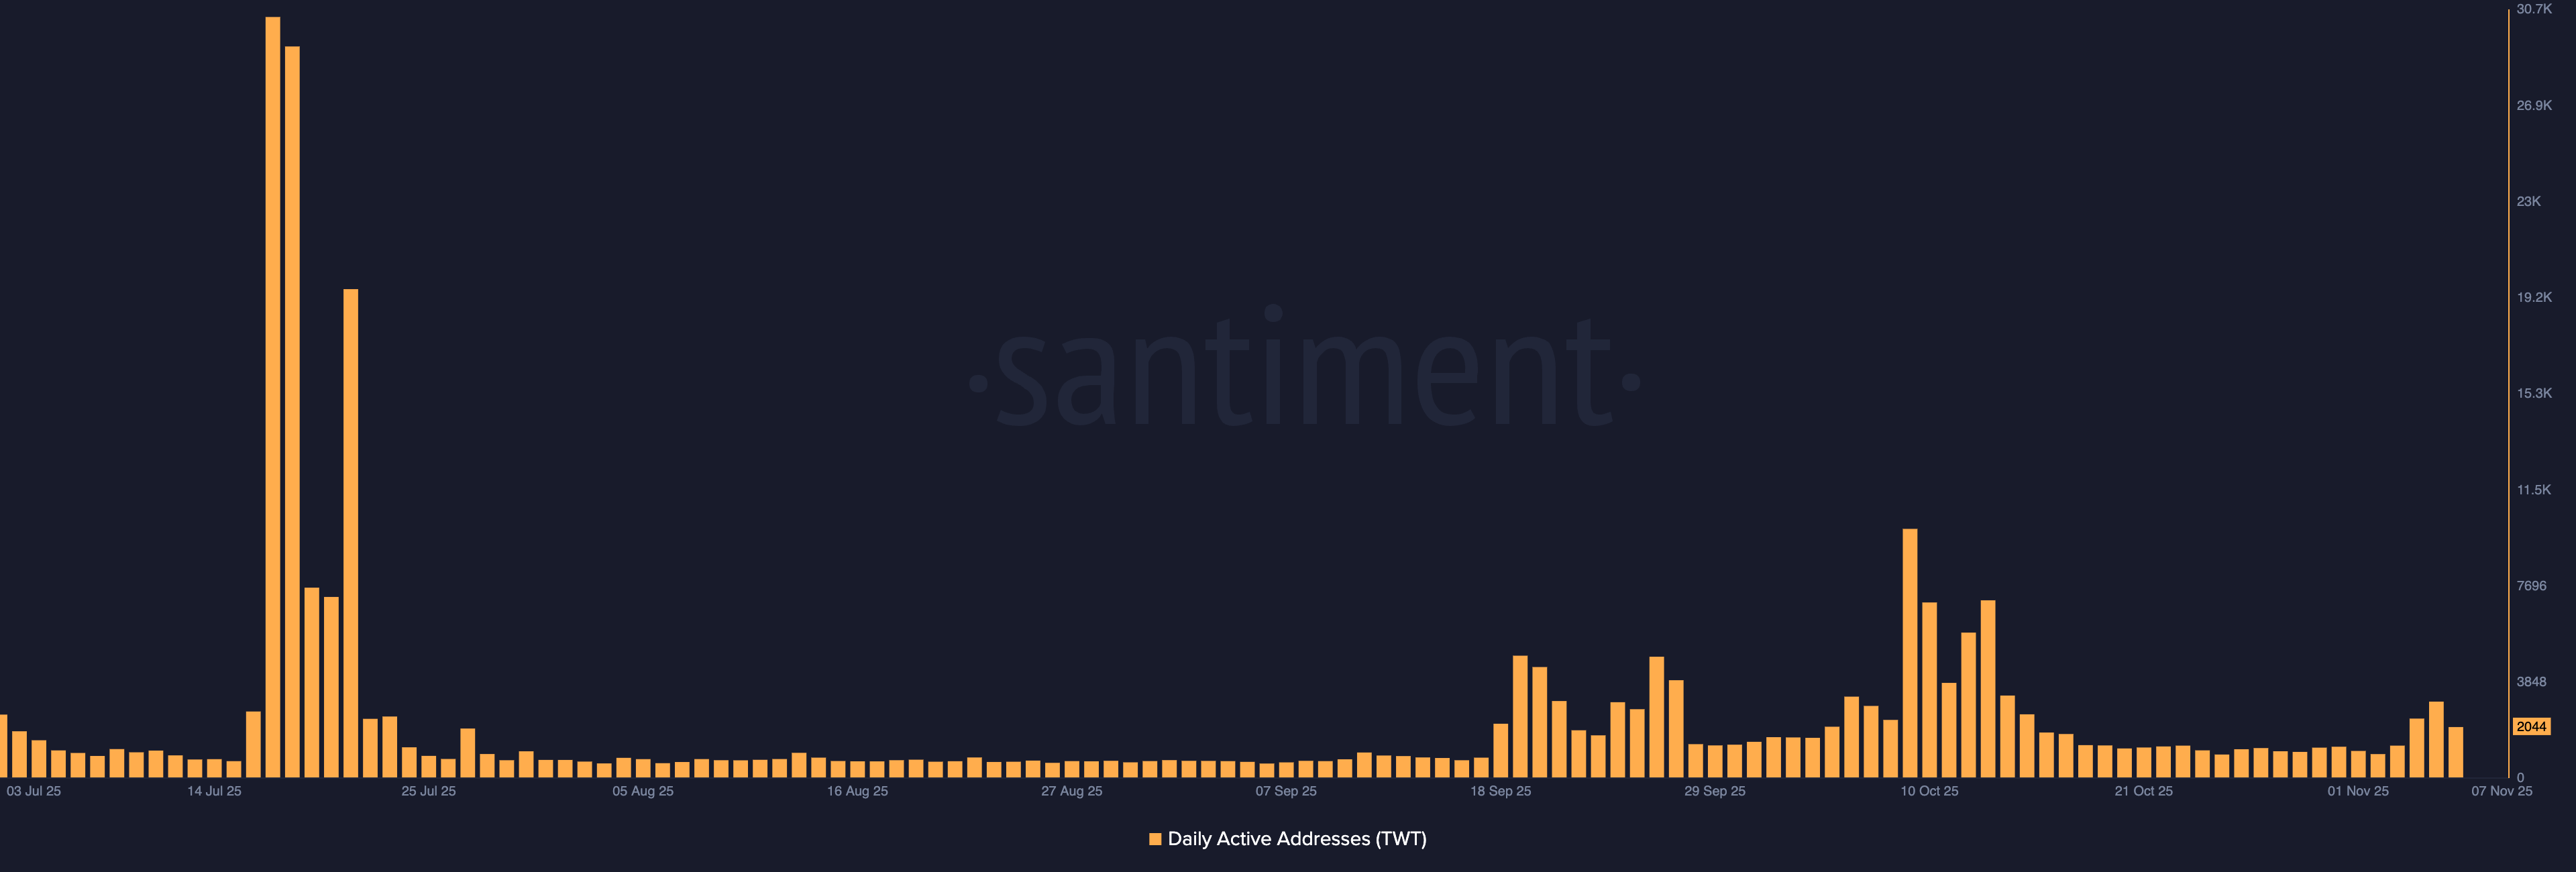
Meanwhile, a refreshing increase in daily active addresses on the Trust Wallet ecosystem after the early October adoption spree could boost the demand for the TWT token.
Technical outlook: Will TWT and 1INCH extend the rally?
Trust Wallet Token edges higher by 2% at press time on Friday, advancing the bounce-back from the 100-day Exponential Moving Average (EMA) for the fourth consecutive day. The TWT token maintains its position above the $1 psychological level, supported by the 50-day, 100-day, and 200-day EMAs.
The TWT correction phase from the $1.7322 high on October 8 is stabilizing near the 100-day EMA at $1.1059. A potential closing above $1.2935, a prominent resistance level active in late October, could reinstate the uptrend, targeting the R1 Pivot Point at $1.6508, followed by the $1.7322 high.
The momentum indicators on the daily chart suggest a bullish shift is around the corner as the Moving Average Convergence Divergence (MACD) approaches the signal line for a potential crossover. At the same time, the Relative Strength Index (RSI) is at 48 on the same chart, aiming to surpass the midline as selling pressure wanes.
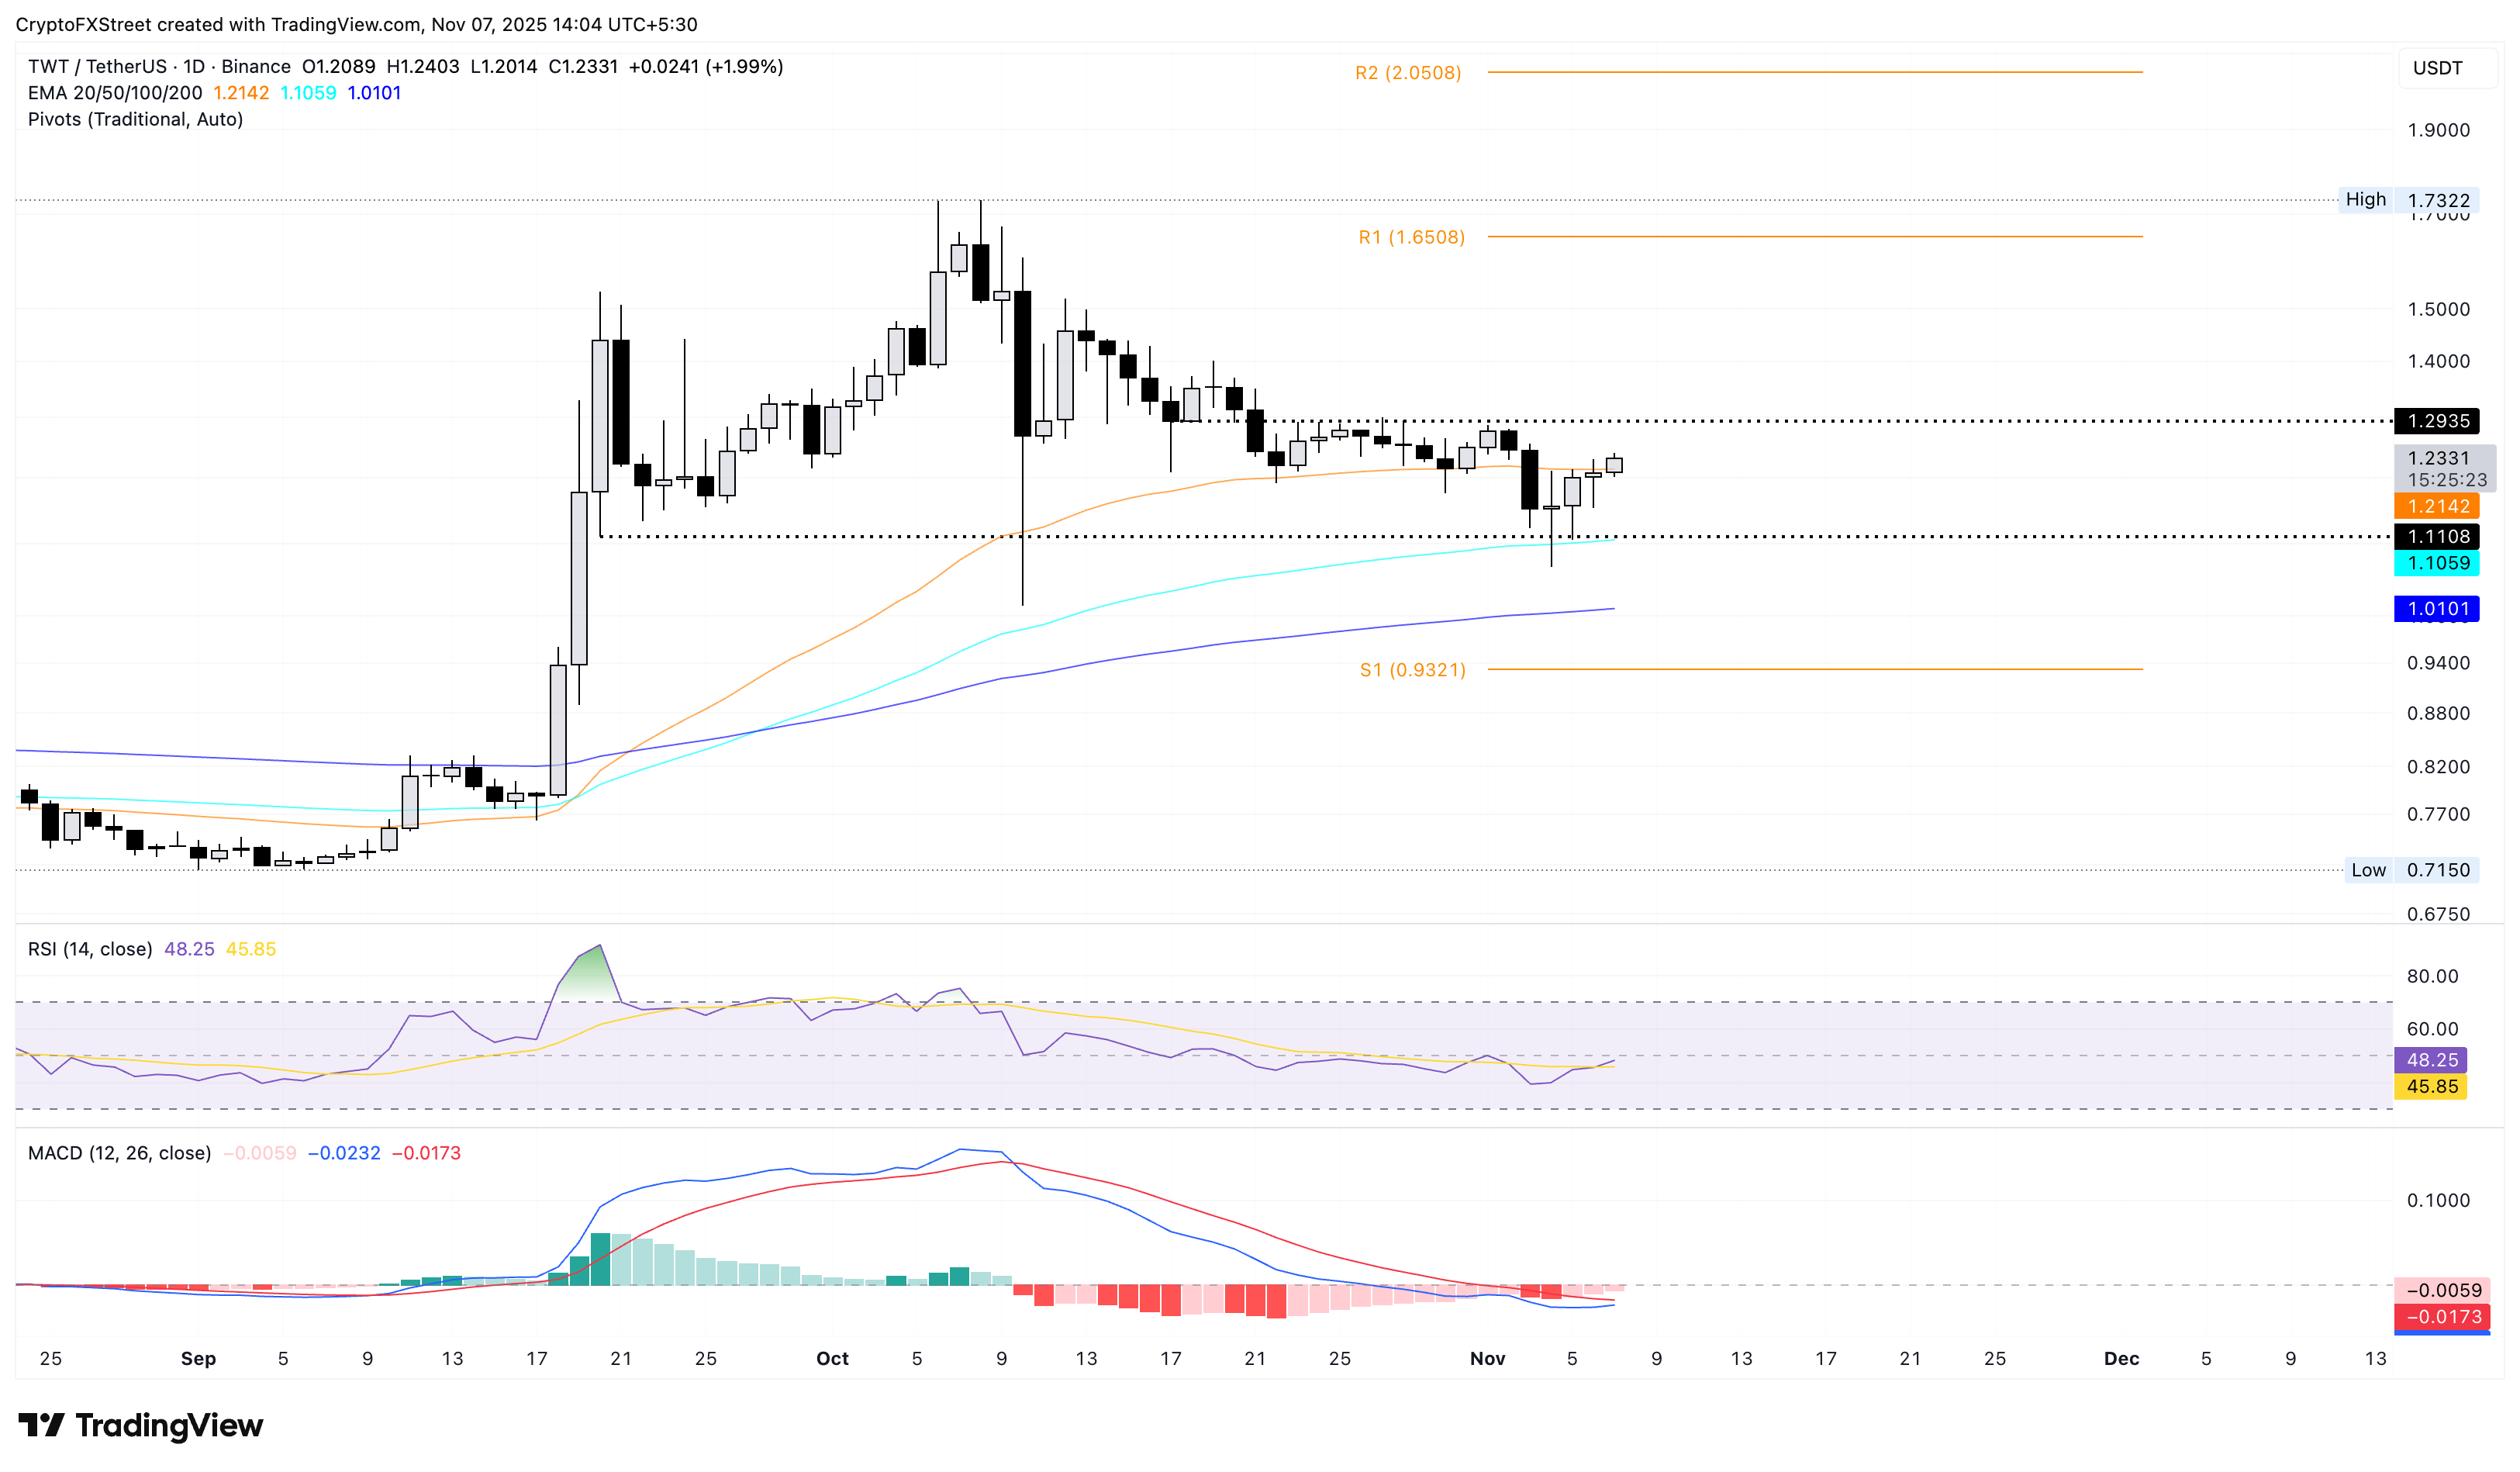
On the contrary, if TWT fails to hold above $1.1059, it could test the 200-day EMA at $1.0101, followed by the S1 Pivot Point at $0.9321.
On the other hand, the 1INCH token ticks higher by over 11% at press time on Friday, challenging the 100-day EMA at $0.2183. As the 1INCH token reclaims $0.2000, the declining trendline formed by the July 13 and October 3 highs, near the 200-day EMA at $0.2330, acts as a key level of resistance.
If 1inch successfully exceeds the $0.2330 level, it could target the R1 and R2 Pivot Points at $0.2548 and $0.3475, respectively.
A striking difference between TWT and 1INCH is the opposite alignment of the 50-day, 100-day, and 200-day EMAs. A steady rise in TWT EMAs indicates a prevailing uptrend, which minimizes the risk of overhead pressure, whereas the declining EMAs in 1INCH represent an overall downtrend, risking multiple overhead resistances.
Still, the momentum indicators on the daily chart indicate a rise in buying pressure, as the MACD bounces off the signal line, and the RSI at 59 reflects further room for growth before reaching the overbought zone.
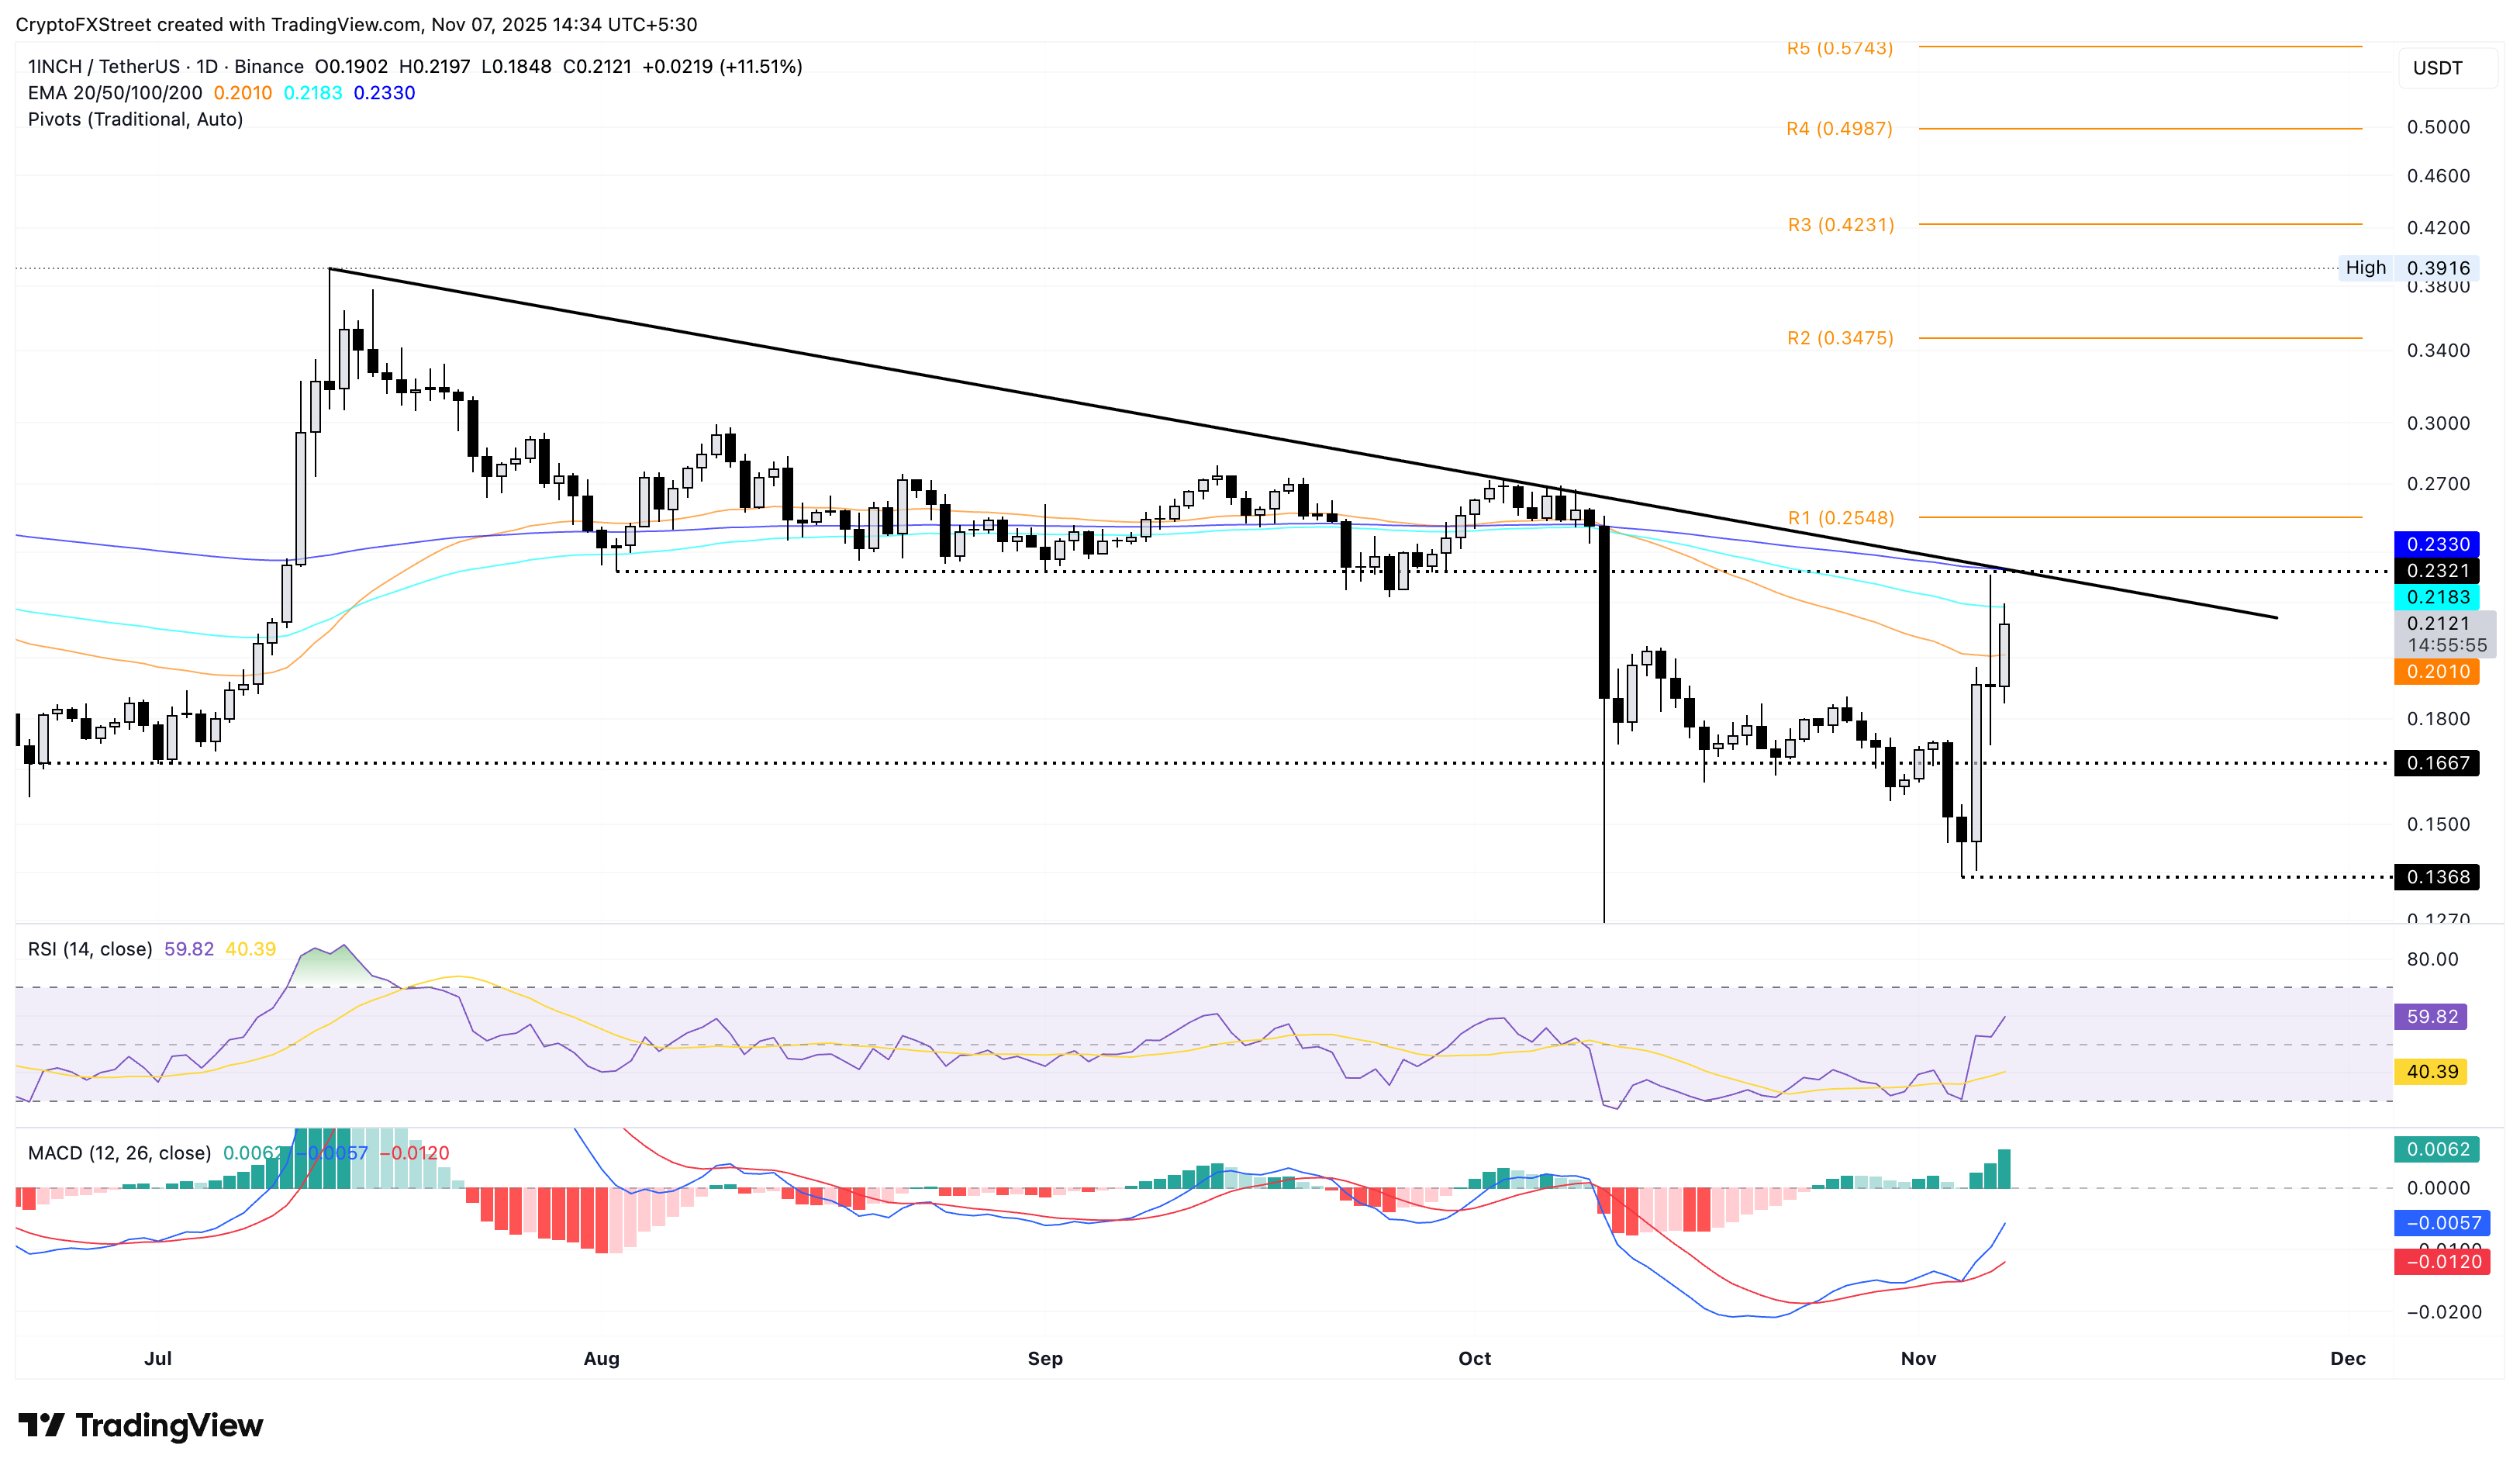
Looking down, if 1INCH is rejected from $0.2330, the key support levels are at $0.1667 and $0.1368, marked by the June 22 close and November 4 low, respectively.


