
AUD/USD Price Forecast: Rebounds toward 0.7250 near four-year highs
Ni Akhtar Faruqui
Na-update: 8 May 2026


Sikat na Artikulo

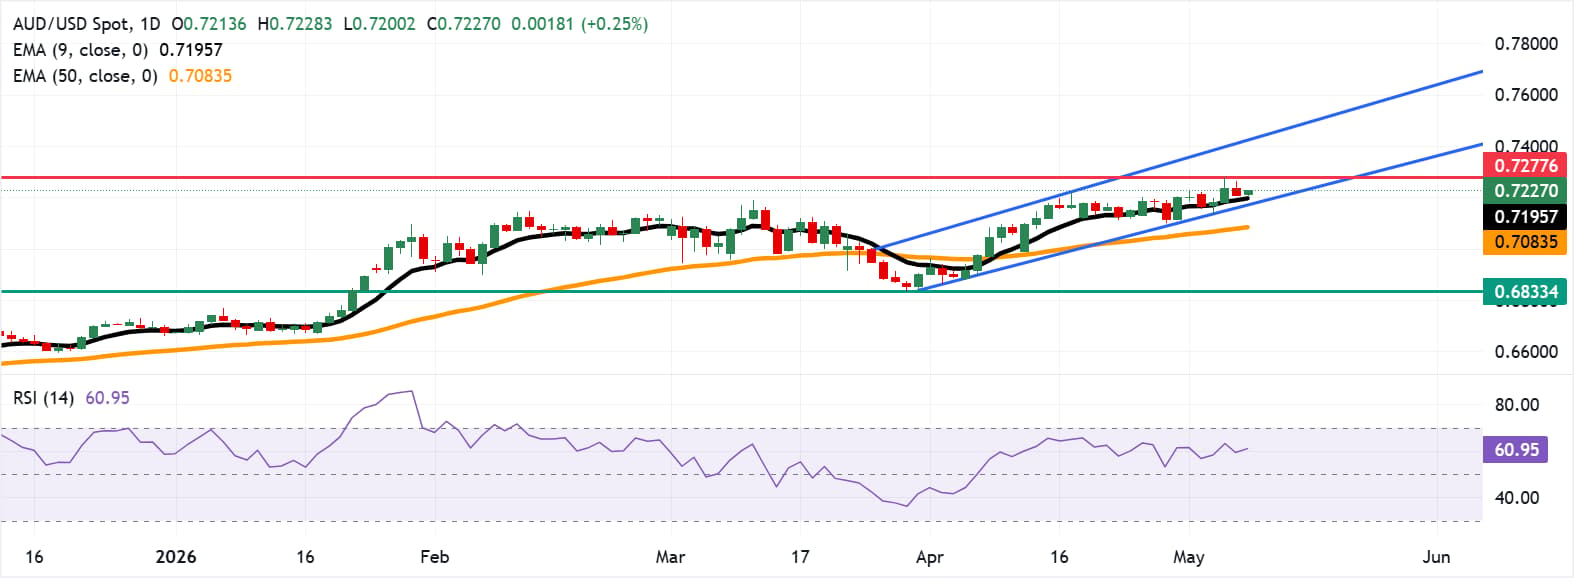
AUD/USD pares its recent losses from the previous day, trading around 0.7220 during the Asian hours on Friday. The technical analysis of the daily chart indicates that the pair is moving upwards within the ascending channel, suggesting an ongoing bullish bias.
- AUD/USD may test the 0.7277, the highest since June 2022.
- The 14-day Relative Strength Index near 61 signals sustained positive momentum.
- Initial support is located near the nine-day EMA at 0.7195.
AUD/USD pares its recent losses from the previous day, trading around 0.7220 during the Asian hours on Friday. The technical analysis of the daily chart indicates that the pair is moving upwards within the ascending channel, suggesting an ongoing bullish bias.
The AUD/USD pair holds a clear bullish bias as spot remains above both the nine-day and 50-day Exponential Moving Averages (EMAs), suggesting an ongoing topside phase after the recent advance.
The 14-day Relative Strength Index (RSI) around 61 supports constructive momentum but stays short of overbought territory, hinting that buying pressure is firm yet not overstretched.
The AUD/USD pair may rebound toward 0.7277, the highest since June 2022, recorded on May 6. A sustained break above this level would support the pair to target the upper boundary of the ascending channel around 0.7430.
On the downside, the initial support lies at the nine-day EMA of 0.7195, followed by the lower boundary of the ascending channel around 0.7170. Further declines would expose the 50-day EMA at 0.7083. A break below the medium-term average would cause the bearish emergence and put downward pressure on the AUD/USD pair to navigate the region around the three-month low of 0.6833, which was recorded on March 30.
(The technical analysis of this story was written with the help of an AI tool.)
Australian Dollar Price Today
The table below shows the percentage change of Australian Dollar (AUD) against listed major currencies today. Australian Dollar was the strongest against the US Dollar.
| USD | EUR | GBP | JPY | CAD | AUD | NZD | CHF | |
|---|---|---|---|---|---|---|---|---|
| USD | -0.17% | -0.23% | -0.09% | -0.11% | -0.27% | -0.29% | -0.18% | |
| EUR | 0.17% | -0.09% | 0.09% | 0.05% | -0.10% | -0.09% | -0.00% | |
| GBP | 0.23% | 0.09% | 0.17% | 0.14% | -0.03% | -0.01% | 0.08% | |
| JPY | 0.09% | -0.09% | -0.17% | -0.01% | -0.20% | -0.19% | -0.09% | |
| CAD | 0.11% | -0.05% | -0.14% | 0.00% | -0.19% | -0.18% | -0.08% | |
| AUD | 0.27% | 0.10% | 0.03% | 0.20% | 0.19% | 0.02% | 0.09% | |
| NZD | 0.29% | 0.09% | 0.00% | 0.19% | 0.18% | -0.02% | 0.09% | |
| CHF | 0.18% | 0.00% | -0.08% | 0.09% | 0.08% | -0.09% | -0.09% |
The heat map shows percentage changes of major currencies against each other. The base currency is picked from the left column, while the quote currency is picked from the top row. For example, if you pick the Australian Dollar from the left column and move along the horizontal line to the US Dollar, the percentage change displayed in the box will represent AUD (base)/USD (quote).

Higit sa isang milyong user ang umaasa sa FXStreet para sa real-time market data, charting tools, expert insights, at Forex news. Ang komprehensibong economic calendar at educational webinars nito ay tumutulong sa mga trader na manatiling may alam at gumawa ng kalkuladong mga desisyon. Sinusuportahan ang FXStreet ng humigit-kumulang 60 propesyonal sa pagitan ng Barcelona HQ at iba’t ibang rehiyon sa buong mundo.
Magbasa pa


