
Bitcoin four-year cycle: BTC risks 75% drawdown with four months of bear market still ahead
Ni Vishal Dixit
Na-update: 29 Jun 2026


Sikat na Artikulo

Bitcoin (BTC) price continues to trend downward below the $60,000 support zone after losing over 50% of its value since the $126,199 high in October. Bitcoin’s four-year cycle, measured from cycle tops to bottoms, suggests that four months of a bear market are still ahead.
- Bitcoin hovers below $60,000 on Friday, down over 50% from its all-time high of $126,199.
- The BTC four-year market cycle points to four more months of bear market.
- Downside risk in Bitcoin ranges from $49,221 to $33,111, representing an estimated 75% drawdown from its all-time high.
Bitcoin (BTC) price continues to trend downward below the $60,000 support zone after losing over 50% of its value since the $126,199 high in October. Bitcoin’s four-year cycle, measured from cycle tops to bottoms, suggests that four months of a bear market are still ahead. The downside risk over the remaining four months could extend the drawdown toward $33,000, roughly 75% from its record high.
In an exclusive chat with FXStreet, Michael Terpin, commonly known as “Godfather of Crypto,” sheds light on the four-year cycle, the start of the next upcycle, and the next bull market high.
Bitcoin’s four-year cycle – The last bullish hope
Bitcoin price action has roughly followed a four-year cycle since inception, separating bull market tops and bear market bottoms by about four years. Bitcoin Halving reduces the amount of reward given to miners every four years, which fuels this four-year cyclical pattern.
However, each year the cycle observes diminishing returns and drawbacks, suggesting a broader contraction on the logarithmic scale. According to the cyclical pattern, the Bitcoin bull market topped out at around $126,199 in October 2025, and the current market price of roughly $60,000 reflects more than a 50% pullback.
The cyclical behavior predicts a potential bottoming out around October 2026, estimating roughly four months left in the ongoing bear cycle. However, the recent pullback of over 50% could break multiple support levels on the monthly chart, suggesting the broader uptrend is in a corrective phase rather than resuming impulsive gains.
In short, the bear cycle risks a steeper correction if buyers fail to hold the June close price above $60,000 or reclaim the lost levels in the coming months.
How low could Bitcoin go in 2026 bear market?
At the time of writing, Bitcoin is down more than 15% so far in June, risking a monthly close below $60,000. The King Crypto maintains a bearish near-term bias as it tests below the 50-period Exponential Moving Average (EMA) at $66,025 on the monthly chart.
From a technical perspective, Bitcoin maintains a steady upward trend on a logarithmic scale, but risks falling below a support trendline connecting the July 2013 and August 2015 lows near $59,000. If Bitcoin fails to regain bullish momentum, downside risk extends toward the August 2024 monthly low of $49,221, followed by the January 2022 monthly low of $33,111.
Momentum conditions reinforce this cautious tone as buying pressure eases. The Moving Average Convergence Divergence (MACD) and signal line are in freefall as negative histograms expand, and the Relative Strength Index (RSI) at 41 hints at persistent downside pressure, though it has not yet reached oversold levels.
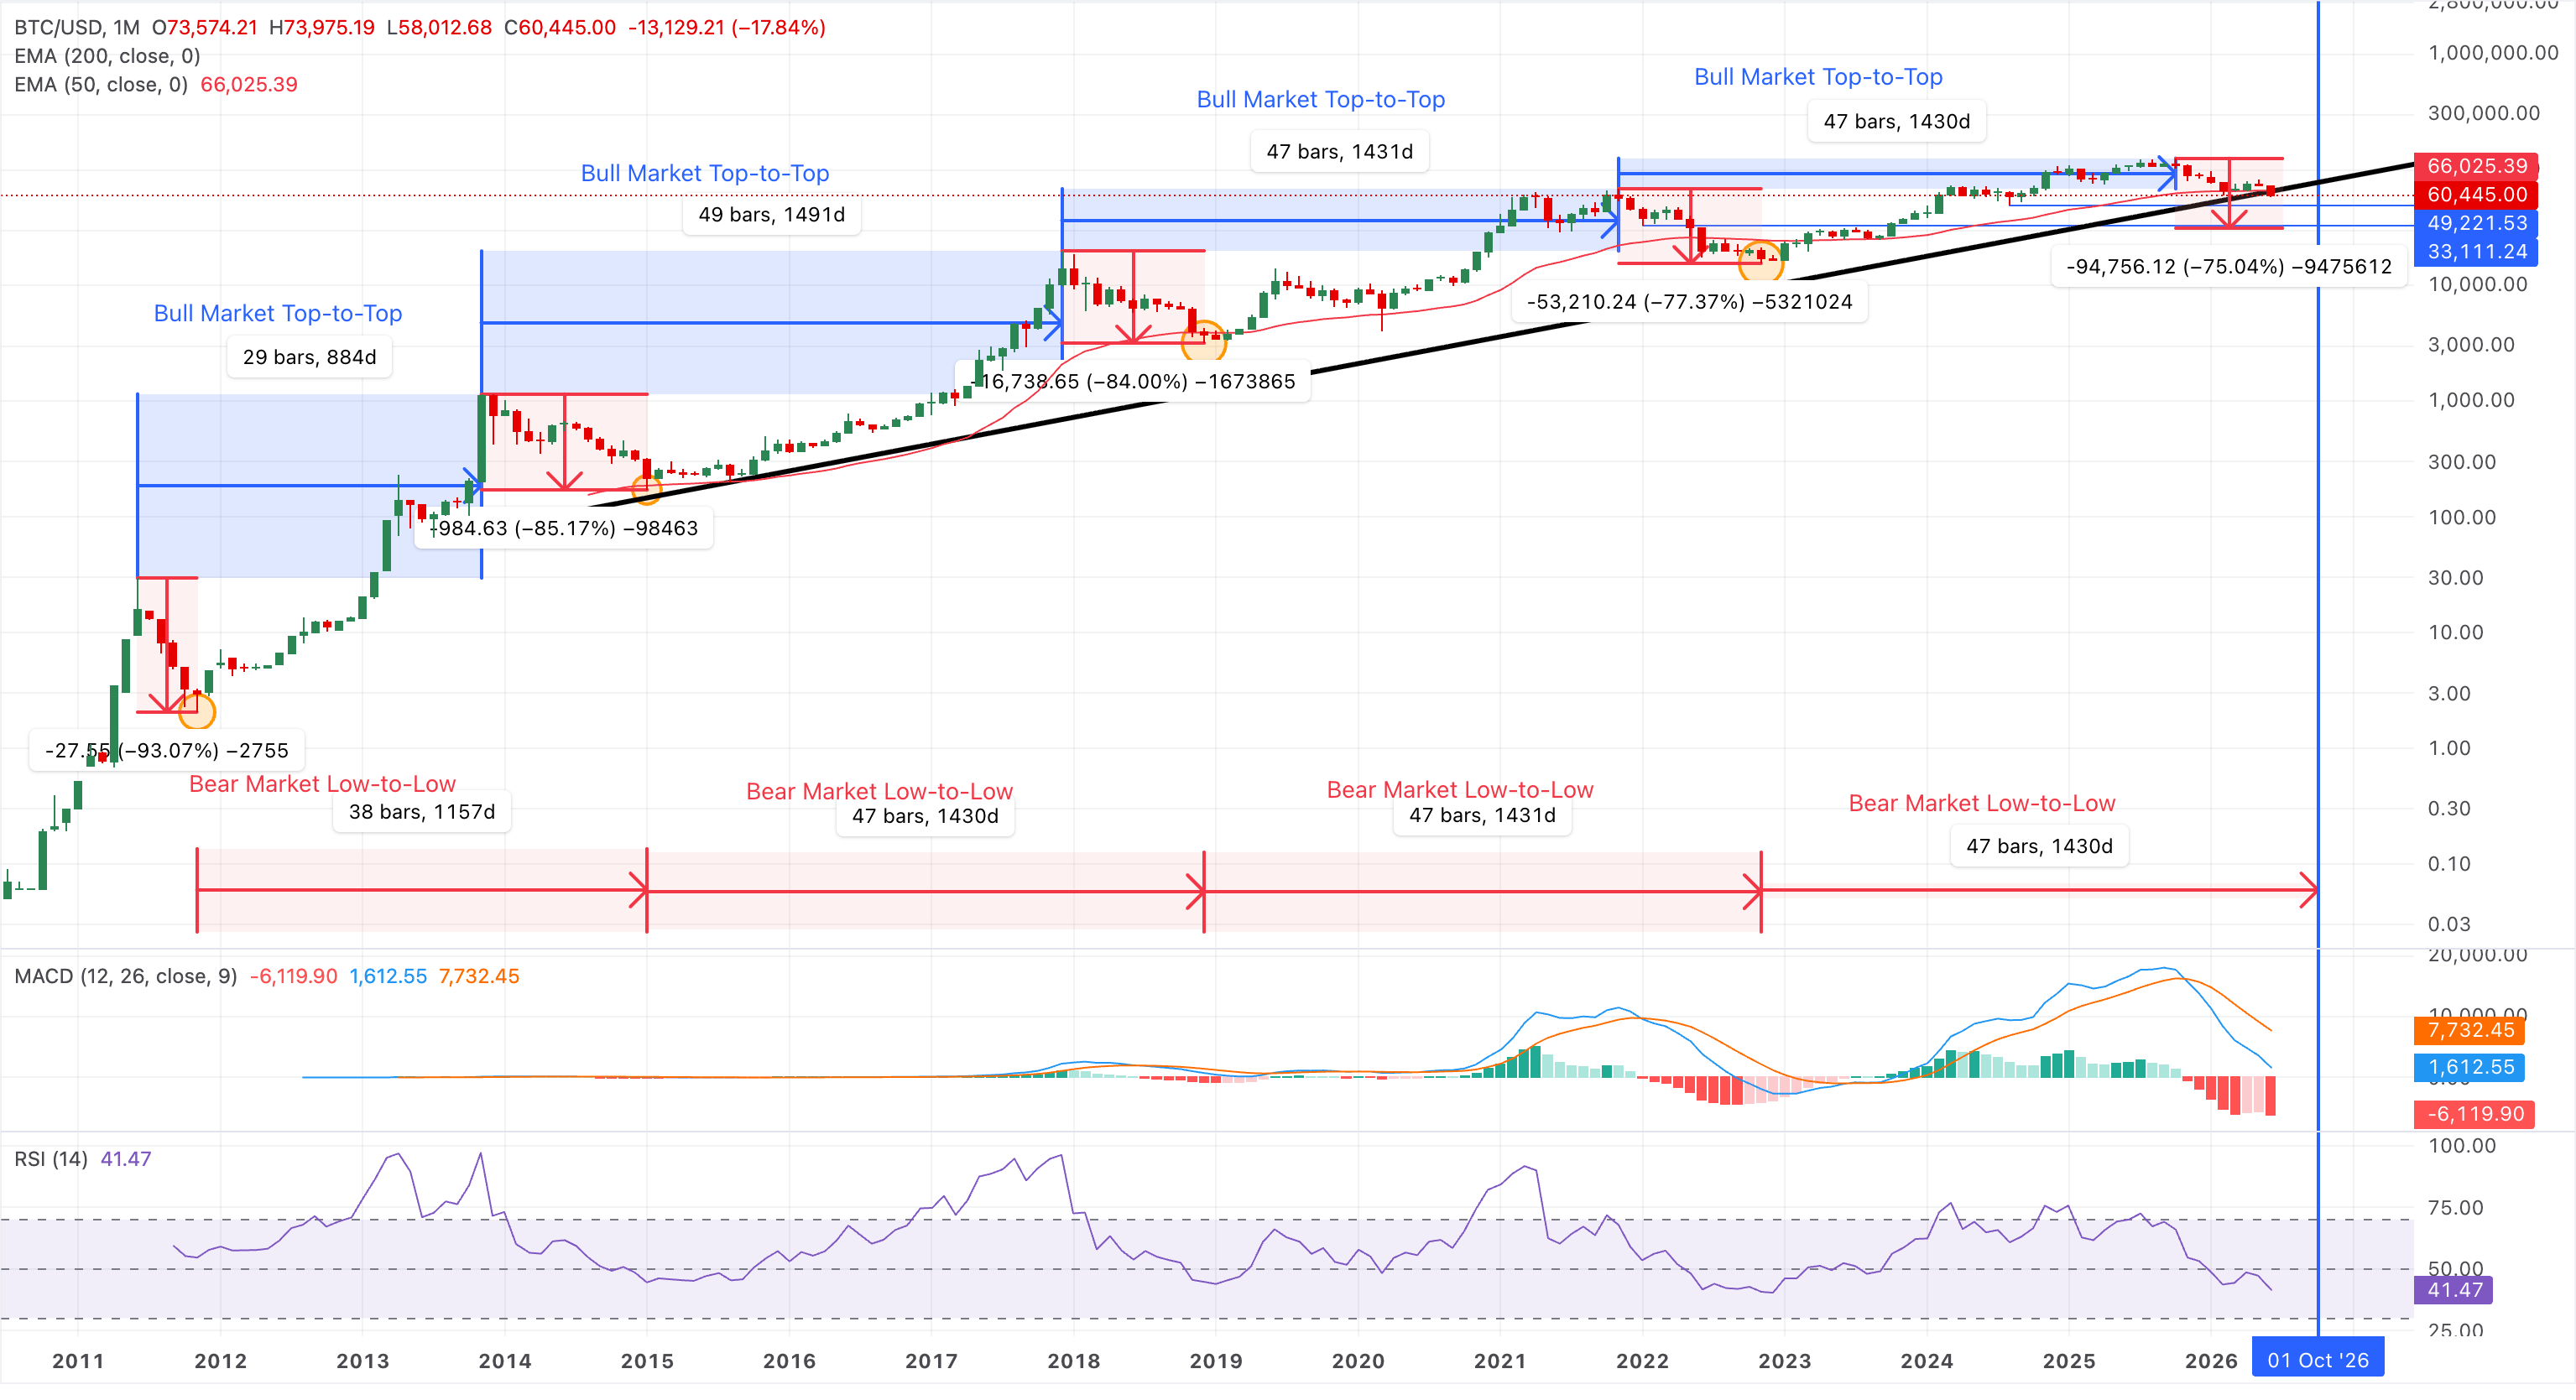
On the topside, a rebound above the 50-period EMA at $66,025 is necessary for any recovery attempt on the monthly timeframe. A sustained break above this barrier would be needed to ease the current bearish bias and reopen the path toward the prior highs.
To shed more light on the resilience, relevance, and potential evolution of Bitcoin's four-year cycle, as well as possible price targets, FXStreet interviewed Michael Terpin, one of the earliest blockchain investors and often referred to as the Crypto Grandfather.
1. Bitcoin has historically bottomed around 12 months after each cycle peak, with drawdowns becoming progressively smaller. With BTC down over 50% from its October 2025 high, do you expect the bear market to bottom by October 2026, and will the trend of diminishing pullbacks continue?
We won’t have a 75% pullback from the high just because it happened in 2022. Each cycle has had diminishing returns and diminishing losses. In my book, Bitcoin Supercycle, I predicted a 60% to 70% drawdown from the high, with my best estimate at 66% at about $42,000. My current predicted range for the bottom is $39,000 - $55,000, with the likely capitulation in early October.
2. As the market approaches this potential cycle bottom, do you expect institutional investors to begin accumulating aggressively ahead of confirmation or wait for clearer signs that the bottom is in?
Investors trying to jump the gun on the bottom still get a good price, but there’s always more time to catch the bottom than the bubble top.
3. If a new bull cycle begins in 2027, what is your long-term price target for Bitcoin, and what key macro or structural drivers could support that move?
Technically, the new bull market starts at the end of the bear, and it lasts about three years - so the sixth cycle bubble should pop in late 2029. My target high is in a range, depending on macro factors. Worst case is $180,000, best case is $300,000 or a quick wick higher.
4. The four-year cycle is tied to the halving, but with block rewards dropping to 1.56 BTC in 2028, that supply shock matters less. Do you think this four-year rhythm stays relevant for a few more cycles, or is it losing its power?
There is a misconception that a low inflation rate of new coins makes it meaningless. In fact, the low inflation needs to be compared to demand. With only 225 new coins available per day, the record new demand anticipated during the next bull market could quickly overwhelm the daily new supply. This is a textbook case for supply shock.
In addition, I believe the four-year cycle could prevail in some form for at least the next 20 years. Once prices are over $1 million and amid even greater institutional dynamics, the four-year cycle may fade, but a Supercycle driven by a supply shock that lifts prices could occur first.
(The technical analysis of this story was written with the help of an AI tool.)

Higit sa isang milyong user ang umaasa sa FXStreet para sa real-time market data, charting tools, expert insights, at Forex news. Ang komprehensibong economic calendar at educational webinars nito ay tumutulong sa mga trader na manatiling may alam at gumawa ng kalkuladong mga desisyon. Sinusuportahan ang FXStreet ng humigit-kumulang 60 propesyonal sa pagitan ng Barcelona HQ at iba’t ibang rehiyon sa buong mundo.
Magbasa pa


