
Bitcoin Price Forecast: BTC nears $82,000 as ETF inflows support upside
Ni Manish Chhetri
Na-update: 6 May 2026


Sikat na Artikulo

Bitcoin (BTC) price is extending its upward momentum, holding near its highest levels in three months, just below $82,000 at the time of writing on Wednesday.
- Bitcoin continues to build bullish momentum, holding near its highest levels in three months just below $82,000 on Wednesday.
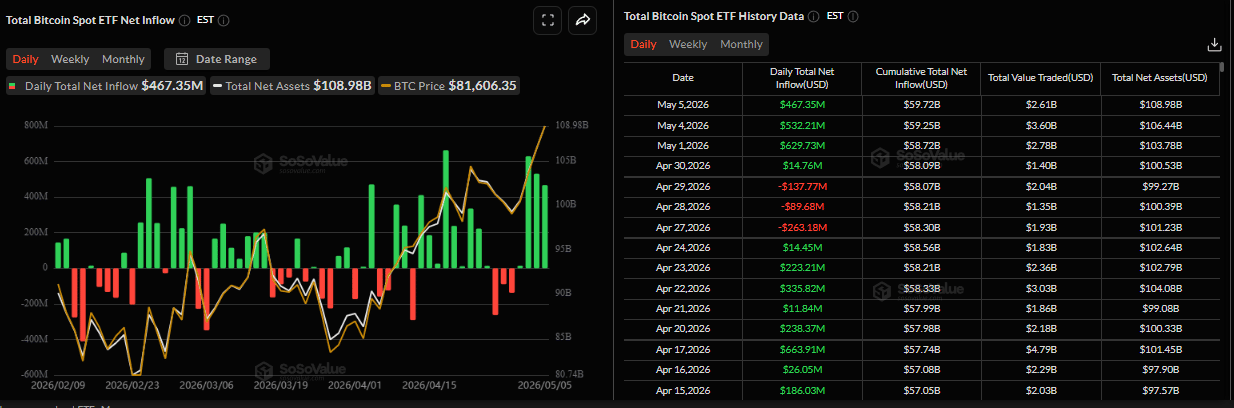
- US-listed spot ETF inflows remain strong, recording $467.35 million on Tuesday and marking the fourth consecutive day of positive flows.
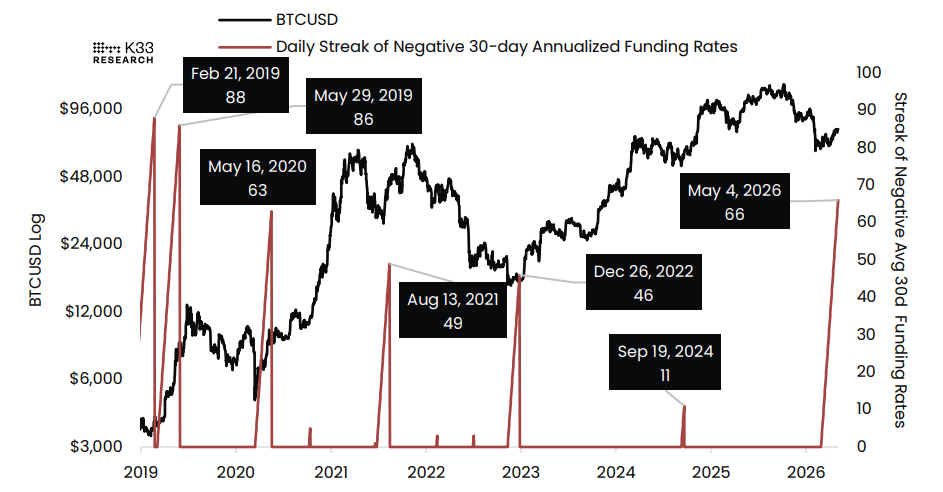
- Report highlights that BTC’s 30-day average funding rates stayed negative for 67 straight days, the longest stretch this decade, hinting at a potential market bottom.
Bitcoin (BTC) price is extending its upward momentum, holding near its highest levels in three months, just below $82,000 at the time of writing on Wednesday. The bullish price action is supported by growing institutional demand, with spot Exchange Traded Funds (ETFs) recording inflows of over $467 million on Tuesday. In addition, BTC’s 30-day average funding rates stayed negative for 67 straight days, making the longest stretch this decade and hinting at a potential market bottom for the Crypto King.
Institutional interest continues to strengthen
Institutional demand has remained robust so far this week. SoSoValue data show that US-listed BTC spot ETFs recorded inflows of $467.35 million on Tuesday, after recording $532.21 million in positive flows the previous day. Moreover, Tuesday’s inflow marked the fourth consecutive day of positive flow. If this trend continues this week, BTC could see a further price rally.
BTC’s bottoming signs emerge
A K33 Research report on Tuesday highlighted that the 30-day average funding rate in Bitcoin has now remained negative for 67 consecutive days, marking the longest such streak this decade.
The report explained that this reflects persistent defensive positioning in the market, even as BTC has trended higher, nearing $82,000.
“Historically, sustained periods of negative funding have often occurred near market bottoms, suggesting that conditions like the current tend to have a positive directional impact on the BTC,” noted K33’s analyst.
The current streak of 67 days of negative funding rates is the longest in the 2020s, surpassing the record from March 15 to May 16 in 2020. Per the eyeball test, all periods of sustained negative funding rates have coincided with BTC bottoms.
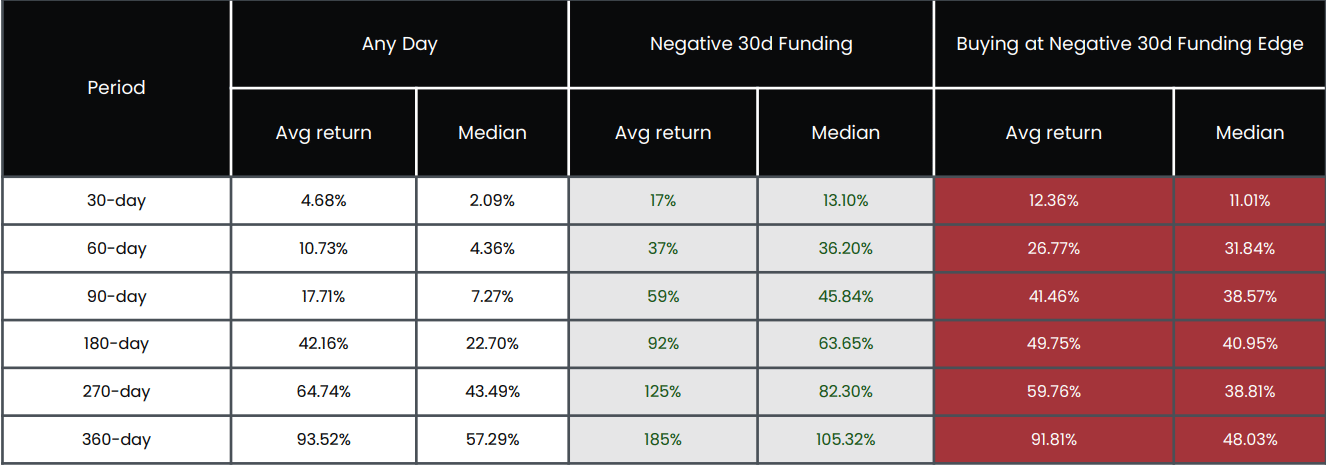
In addition, the chart below shows that buying BTC during negative funding regimes has consistently led to strong forward returns. Win rates are significantly higher when entering during these environments than on any random day, with results improving across longer holding periods. This reinforces the idea that negative funding reflects overly cautious sentiment that tends to resolve to the upside.
Bitcoin Price Forecast: BTC nears 200-day EMA
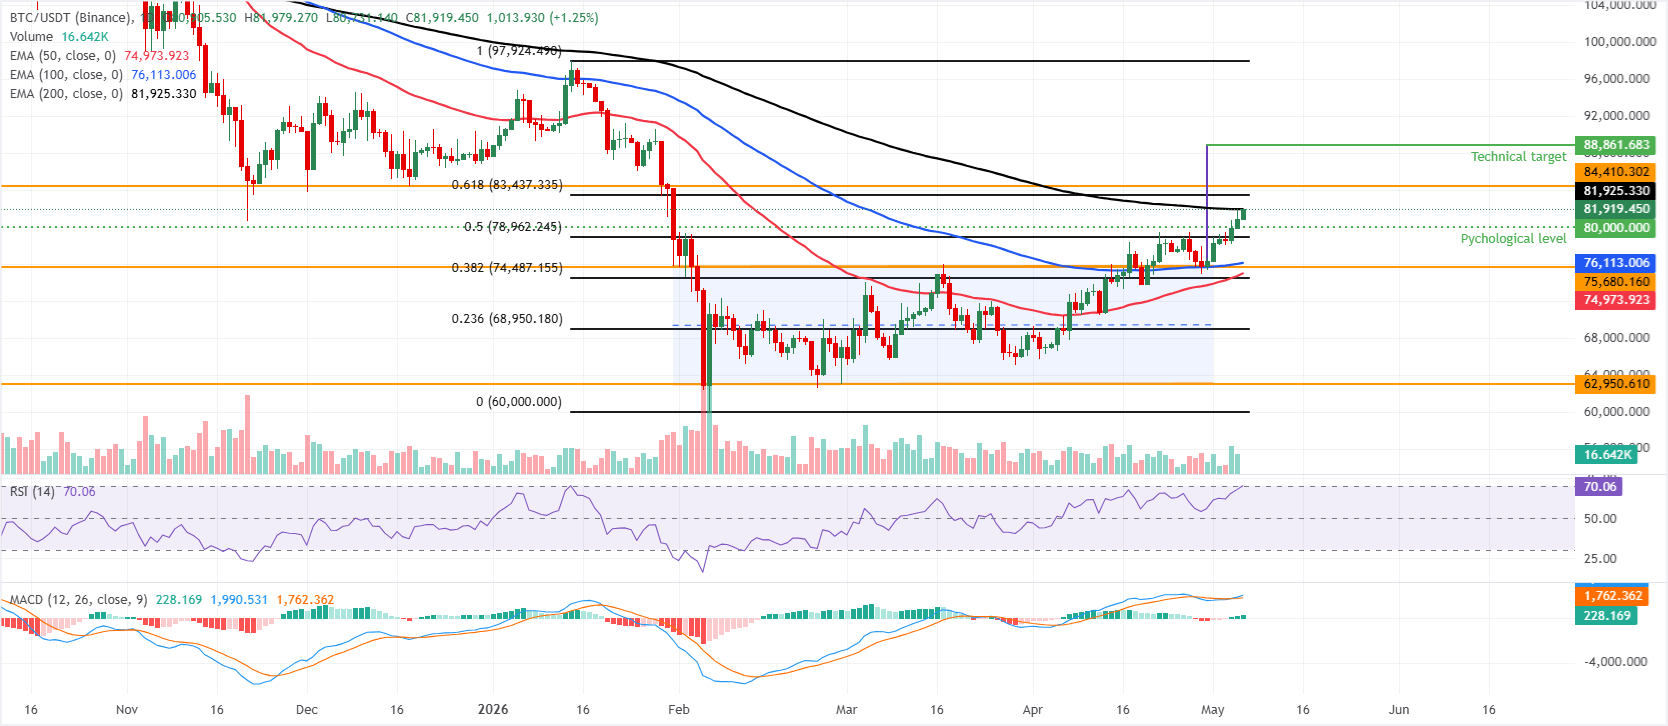
Bitcoin price is trading above $81,900 on Wednesday, maintaining a bullish near-term bias as it holds well above the 50-day and 100-day Exponential Moving Averages (EMAs) at $74,973 and $76,113, respectively, and trades above the upper boundary of the horizontal channel at $75,680.
Upside momentum remains firm, with the Relative Strength Index (RSI) on the daily chart hovering near overbought territory at 70 and the Moving Average Convergence Divergence (MACD) histogram in positive territory, suggesting that buyers still control the tape even as conditions become stretched.
On the topside, immediate resistance aligns just overhead at the 200-day EMA near $81,925, followed by the 61.8% Fibonacci retracement at $83,437 (drawn from the January high to February low), while a stronger barrier is seen at the horizontal resistance around $84,410 and before the channel breakout target at $88,861, measured as the channel’s width projected from the breakout point.
On the downside, initial support emerges at the psychologically important $80,000 level, ahead of the 50% retracement at $78,962; a deeper pullback would expose the 100-day EMA at $76,113 and the upper boundary of the horizontal channel together at $75,680, where buyers would be expected to reappear on first test.
(The technical analysis of this story was written with the help of an AI tool.)
Bitcoin, altcoins, stablecoins FAQs
Bitcoin is the largest cryptocurrency by market capitalization, a virtual currency designed to serve as money. This form of payment cannot be controlled by any one person, group, or entity, which eliminates the need for third-party participation during financial transactions.
Altcoins are any cryptocurrency apart from Bitcoin, but some also regard Ethereum as a non-altcoin because it is from these two cryptocurrencies that forking happens. If this is true, then Litecoin is the first altcoin, forked from the Bitcoin protocol and, therefore, an “improved” version of it.
Stablecoins are cryptocurrencies designed to have a stable price, with their value backed by a reserve of the asset it represents. To achieve this, the value of any one stablecoin is pegged to a commodity or financial instrument, such as the US Dollar (USD), with its supply regulated by an algorithm or demand. The main goal of stablecoins is to provide an on/off-ramp for investors willing to trade and invest in cryptocurrencies. Stablecoins also allow investors to store value since cryptocurrencies, in general, are subject to volatility.
Bitcoin dominance is the ratio of Bitcoin's market capitalization to the total market capitalization of all cryptocurrencies combined. It provides a clear picture of Bitcoin’s interest among investors. A high BTC dominance typically happens before and during a bull run, in which investors resort to investing in relatively stable and high market capitalization cryptocurrency like Bitcoin. A drop in BTC dominance usually means that investors are moving their capital and/or profits to altcoins in a quest for higher returns, which usually triggers an explosion of altcoin rallies.

Higit sa isang milyong user ang umaasa sa FXStreet para sa real-time market data, charting tools, expert insights, at Forex news. Ang komprehensibong economic calendar at educational webinars nito ay tumutulong sa mga trader na manatiling may alam at gumawa ng kalkuladong mga desisyon. Sinusuportahan ang FXStreet ng humigit-kumulang 60 propesyonal sa pagitan ng Barcelona HQ at iba’t ibang rehiyon sa buong mundo.
Magbasa pa


