
Bitcoin Price Forecast: BTC surges above $78,000 amid US-Iran ceasefire extension, US Treasury buyback plan
Ni Manish Chhetri
Na-update: 22 Apr 2026


Sikat na Artikulo
Bitcoin (BTC) extends its gains, trading above $78,000 on Wednesday after surging by more than 6% this week.
- Bitcoin price extends gains, trading above $78,000 on Wednesday after surging nearly 6% so far this week.
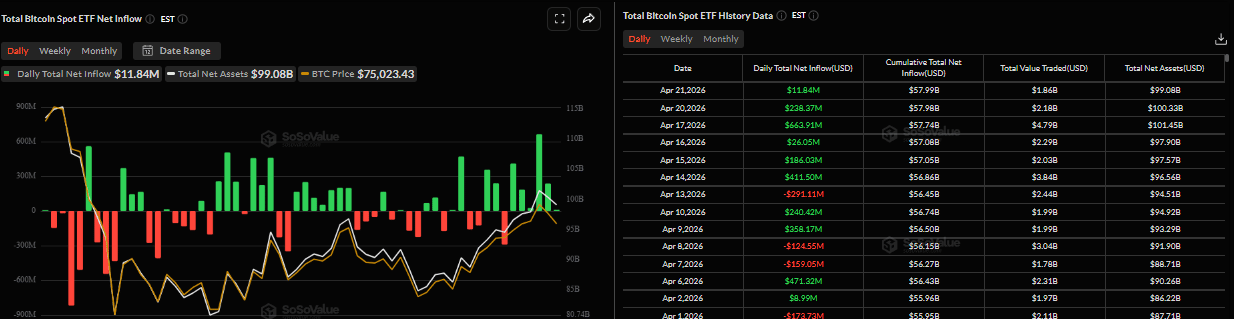
- US-listed spot ETF recorded a mild inflow of $11.84 million on Tuesday amid uncertainty over US-Iran peace talks.
- The US Treasury is projected to buy back $15 billion of its own debt this week, a move that could inject additional liquidity into markets.
Bitcoin (BTC) extends its gains, trading above $78,000 on Wednesday after surging by more than 6% this week. Institutional demand remained relatively muted on Tuesday, with US-listed Bitcoin spot Exchange Traded Funds (ETFs) recording a mild inflow amid uncertainty surrounding the second round of US-Iran peace talks, keeping investors cautious. Meanwhile, the US Treasury's buyback plan this week could inject additional liquidity into markets and boost the Crypto King price.
Ceasefire extension further lifts Bitcoin price
Bitcoin price started the week on a positive note, fully recovering its weekend losses by mid-week and climbing to a high of $78,452 on Wednesday, levels not seen since February 3.
The price was further boosted after US President Donald Trump announced late Tuesday that he had extended the two-week ceasefire, which was set to expire on April 22, upon Pakistan’s request, until Washington receives a unified proposal from Tehran. However, Trump clarified that the US blockade of Iranian sea ports will remain intact, a move that is restricting the usual business of Iran and crippling its economy.
The announcement of a ceasefire extension resulted in a broad risk rally.
Liquidity injection could boost BTC
According to Barchart’s X post on Tuesday, the US Treasury is projected to buy back $15 billion of its own debt this week — matching the largest Treasury buyback in history. This move could inject fresh and additional liquidity into the markets, which is bullish for Bitcoin. As BTC remains a highly liquidity-driven asset, excess capital often flows into risk assets and alternative stores of value, which could boost the BTC price.
Institutional demand records mild inflows
Institutional demand shows early signs of caution. SoSoValue data showed that the spot Bitcoin spot ETFs recorded a mild inflow of $11.84 million on Tuesday, following an inflow of $238.37 million the previous day. This shows that investors’ cautious stance amid uncertainty surrounding the second round of US-Iran peace talks. However, if ETF inflows continue and intensify, BTC could see a further rally.
Short squeeze scenario in play
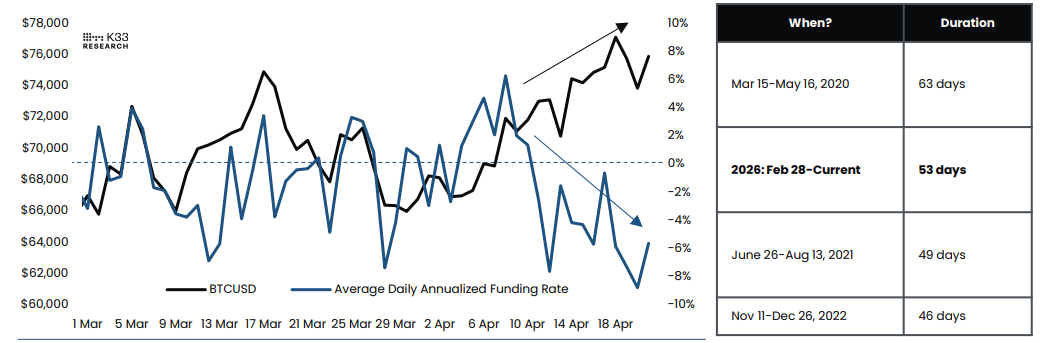
A K33 Research report on Tuesday highlighted that gradually rising leverage alongside deeply negative funding rates shown below suggests that short positions are steadily building in the perpetual market, increasing both the likelihood and the potential magnitude of a short squeeze ahead.
The analyst noted, “The derivatives regime remains defensive, with 53 consecutive days of negative 30 day average funding, one of the longest streaks on record. Such persistent risk aversion has historically aligned with market bottoms and subsequent recoveries. Despite structurally positive institutional developments, positioning remains skewed to the downside, with traders paying to short BTC.”
Bitcoin Price Forecast: Bullish technical breakout
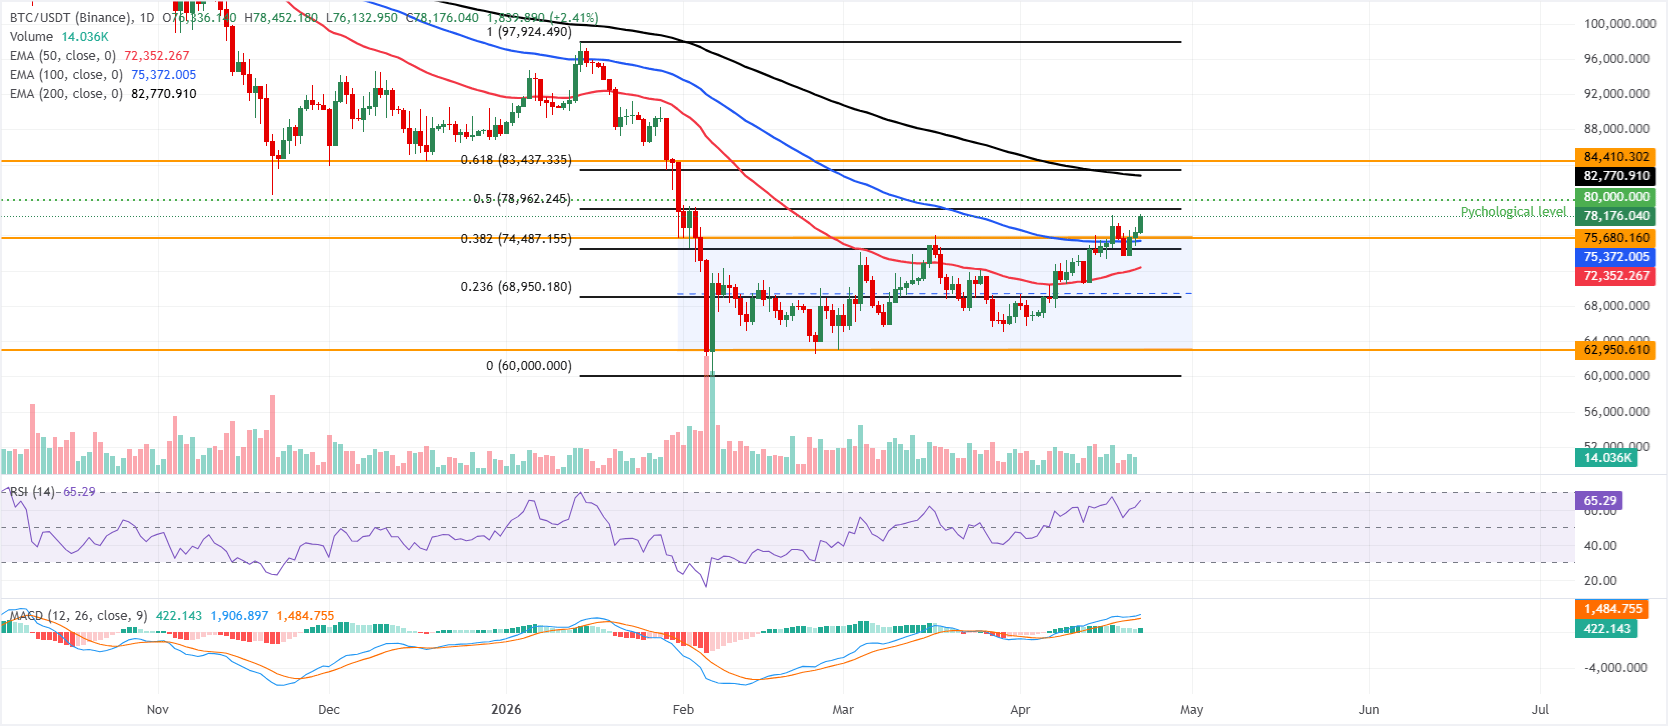
Bitcoin price is trading above $78,000 on Wednesday, extending its advance within an upward parallel channel and maintaining a clear bullish near-term bias, as it sits above the 50-day and 100-day Exponential Moving Averages (EMAs) at $72,345 and $75,368, respectively.
BTC has also reclaimed the 38.2% Fibonacci retracement at $74,487 as support (drawn from the January high of $97,924 to the February low of $60,000), while momentum remains constructive, with the Relative Strength Index (RSI) on the daily chart near 64 and the Moving Average Convergence Divergence (MACD) staying in positive territory, hinting that buyers retain control while the longer-term 200-day EMA at $82,769 still looms overhead as a medium-term cap.
On the topside, immediate resistance lies at the 50% retracement at $78,962, ahead of the psychological $80,000 level and the 200-day EMA at $82,769; above there, the 61.8% Fibonacci retracement at $83,437 and the horizontal barrier at $84,410 form a broader supply zone.
On the downside, initial support lies around the prior channel top at $75,680, followed by the 100-day EMA at $75,368 and the 38.2% Fibonacci level at $74,487, with deeper protection from the 50-day EMA at $72,345 and the lower channel boundary near $62,950.
(The technical analysis of this story was written with the help of an AI tool.)
Bitcoin, altcoins, stablecoins FAQs
Bitcoin is the largest cryptocurrency by market capitalization, a virtual currency designed to serve as money. This form of payment cannot be controlled by any one person, group, or entity, which eliminates the need for third-party participation during financial transactions.
Altcoins are any cryptocurrency apart from Bitcoin, but some also regard Ethereum as a non-altcoin because it is from these two cryptocurrencies that forking happens. If this is true, then Litecoin is the first altcoin, forked from the Bitcoin protocol and, therefore, an “improved” version of it.
Stablecoins are cryptocurrencies designed to have a stable price, with their value backed by a reserve of the asset it represents. To achieve this, the value of any one stablecoin is pegged to a commodity or financial instrument, such as the US Dollar (USD), with its supply regulated by an algorithm or demand. The main goal of stablecoins is to provide an on/off-ramp for investors willing to trade and invest in cryptocurrencies. Stablecoins also allow investors to store value since cryptocurrencies, in general, are subject to volatility.
Bitcoin dominance is the ratio of Bitcoin's market capitalization to the total market capitalization of all cryptocurrencies combined. It provides a clear picture of Bitcoin’s interest among investors. A high BTC dominance typically happens before and during a bull run, in which investors resort to investing in relatively stable and high market capitalization cryptocurrency like Bitcoin. A drop in BTC dominance usually means that investors are moving their capital and/or profits to altcoins in a quest for higher returns, which usually triggers an explosion of altcoin rallies.

Higit sa isang milyong user ang umaasa sa FXStreet para sa real-time market data, charting tools, expert insights, at Forex news. Ang komprehensibong economic calendar at educational webinars nito ay tumutulong sa mga trader na manatiling may alam at gumawa ng kalkuladong mga desisyon. Sinusuportahan ang FXStreet ng humigit-kumulang 60 propesyonal sa pagitan ng Barcelona HQ at iba’t ibang rehiyon sa buong mundo.
Magbasa pa


