
Bitcoin Weekly Forecast: Another month of losses, and it’s been five
Ni Manish Chhetri
Petsa ng Pag-publish: 27 Feb 2026 | Petsa ng Pag-edit: 27 Feb 2026


Sikat na Artikulo

Bitcoin (BTC) price is stabilizing around $68,000 at the time of writing on Friday, but the Crypto King is poised to close February on a fragile footing, marking its fifth consecutive month of losses since October and a rare start to the year with back-to-back monthly corrections.
- Bitcoin steadies at $67,300 on Friday, consolidating around the 200-week EMA at $68,000.
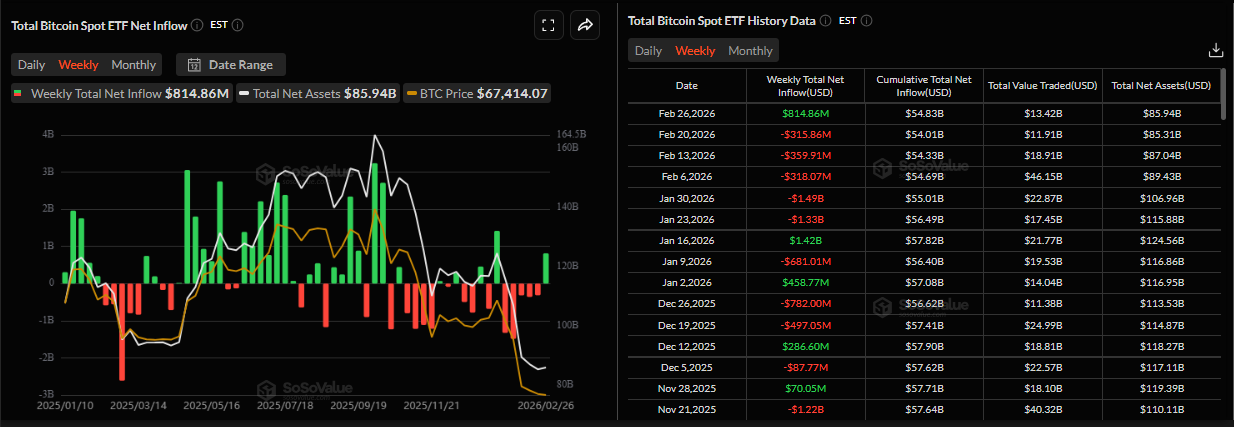
- US-listed ETFs record an inflow of $814.86 million through Thursday, pointing to the first weekly positive flows since January 23.
- Historical data show a rare occurrence as BTC posted two consecutive monthly losses to start the year.
Bitcoin (BTC) price is stabilizing around $68,000 at the time of writing on Friday, but the Crypto King is poised to close February on a fragile footing, marking its fifth consecutive month of losses since October and a rare start to the year with back-to-back monthly corrections.
A rare occurrence
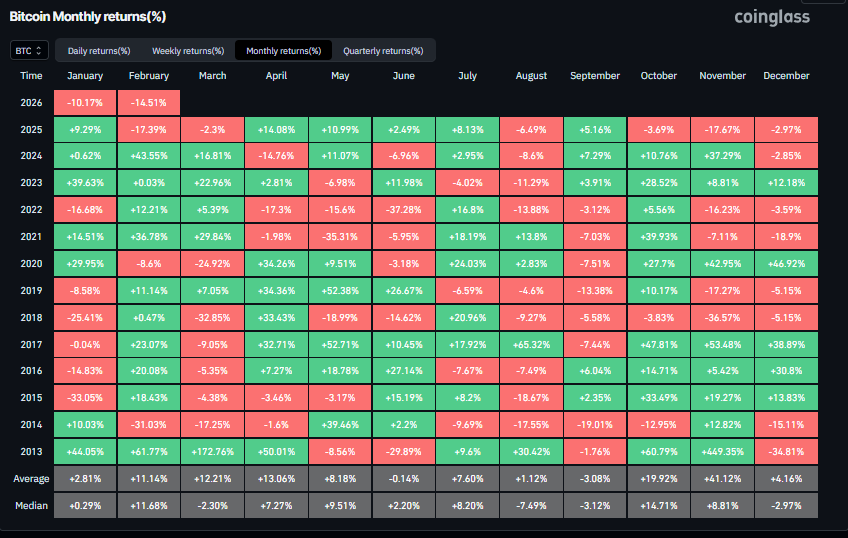
Bitcoin is on track to close February with double-digit losses as of Friday, standing around -14.51%. According to data from Coinglass, BTC has posted two consecutive monthly declines at the start of the year, down 10.17% and 14.51%, respectively — a relatively rare occurrence when looking at its historical performance. If February finally ends in negative territory, which very much looks like it, it would mark the fifth consecutive month of correction since October 2025. Such a streak of consecutive losses hadn't been seen since 2018, when BTC declined from August to December.
However, monthly trends indicate some signs of optimism. Historically, March has delivered positive returns for Bitcoin, averaging gains of 12.21%. This rebound thesis would play in if institutional inflows resume and regulatory developments turn supportive for the broader crypto market, restoring investor confidence and risk appetite.
Institutional demand returns
Institutional demand shows some signs of optimism so far this week. According to SoSoValue data, spot Bitcoin ETFs have recorded an inflow of $814.86 million through Thursday. If this trend continues through Friday, it would break a streak of five straight weeks of outflows since January 23. If these inflows continue and intensify, BTC could see a recovery in the upcoming weeks.
On the corporate front, Michael Saylor announced on X on Monday that Strategy (MSTR) purchased another 592 BTC, following the purchase of 2,486 BTC in the previous week. Monday’s purchase brings the firm’s total holdings to 717,722 BTC, highlighting its continued aggressive accumulation strategy and long-term conviction in Bitcoin despite the ongoing market correction. Strategy's average purchase price of all its holdings stands at $76,020, above current market prices.
Tariff uncertainty weighs on BTC recovery
Bitcoin started the week on a negative note, as investors assessed the latest headlines surrounding tariffs, with US President Donald Trump announcing a fresh round of levies after the Supreme Court struck down most of the old ones.
The new customs duties took effect on Tuesday at a rate of 10%, with the White House threatening to raise them to 15%. FedEx is suing the US government, seeking a full tariff refund, and other major companies have also filed claims, including Costco, Revlon and eyewear maker EssilorLuxottica. These tariff uncertainties weighed on risk sentiment, with the Crypto King reaching a two-week low of $62,510 so far this week.
US-Iran to continue nuclear talks next week
Rising geopolitical tensions between the United States and Iran entered a new phase this week as the two nations met in Geneva on Thursday for the third round of nuclear talks.
Oman’s Foreign Minister, Badr al-Busaidi, said on Thursday that talks between the US and Iran on nuclear issues have made “significant progress.” Negotiations will resume at a technical level in Vienna next week after an initial consultation period. Before the technical meeting in Vienna, each delegation will consult internally with its respective governments to evaluate the operational details of a possible agreement.
So far, these developments have eased global tensions, supporting a slight risk-on sentiment with Bitcoin stabilizing around the $67,000 as of Friday.
However, any sour events or negative comments from either side over the weekend could dampen risk appetite, weighing on the BTC price.
On-chain data signals cooling market conditions, not the bottom
CryptoQuant’s weekly report released on Thursday notes that the current Bitcoin market structure suggests deleveraging and cooling conditions, but not a market bottom.
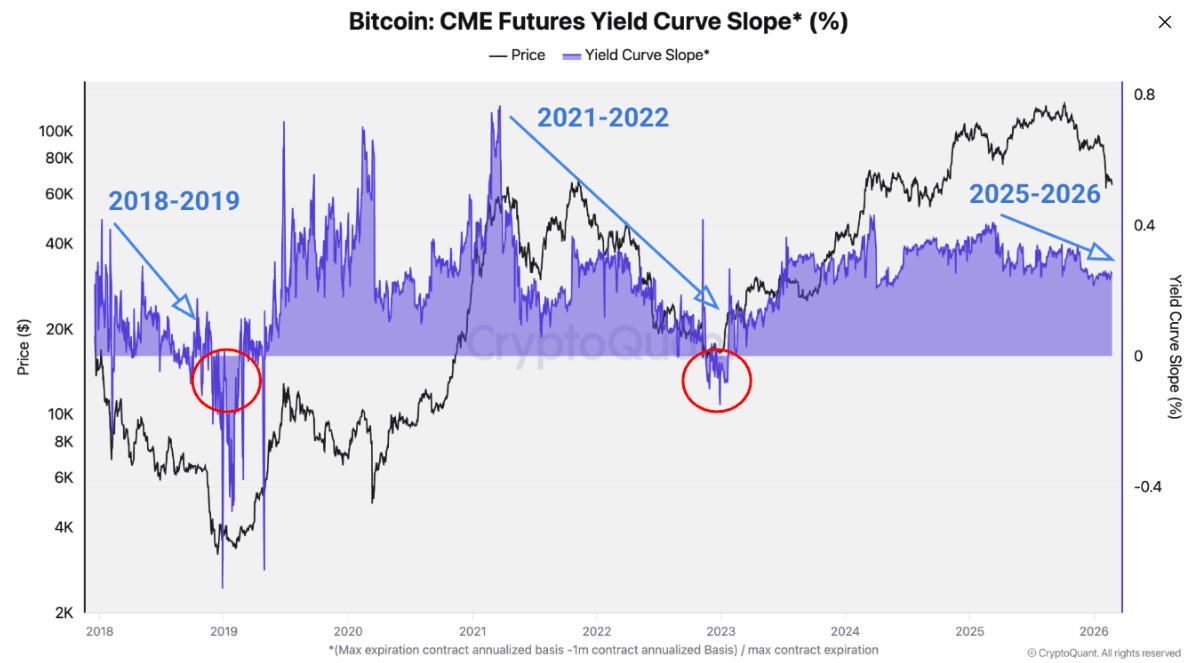
The chart below shows that the Bitcoin Chicago Mercantile Exchange (CME) futures yield curve slope has been trending lower since early 2025, mirroring the pattern observed before the 2018-2019 and 2021-2022 bear-market cycles.
This falling slope indicates weakening leverage demand and declining forward risk appetite, with the cycle bottoming only once the slope turned negative. The current market slope compression points to a cooling market, but its continued positive reading suggests that positioning stress has not reached capitulation levels yet.
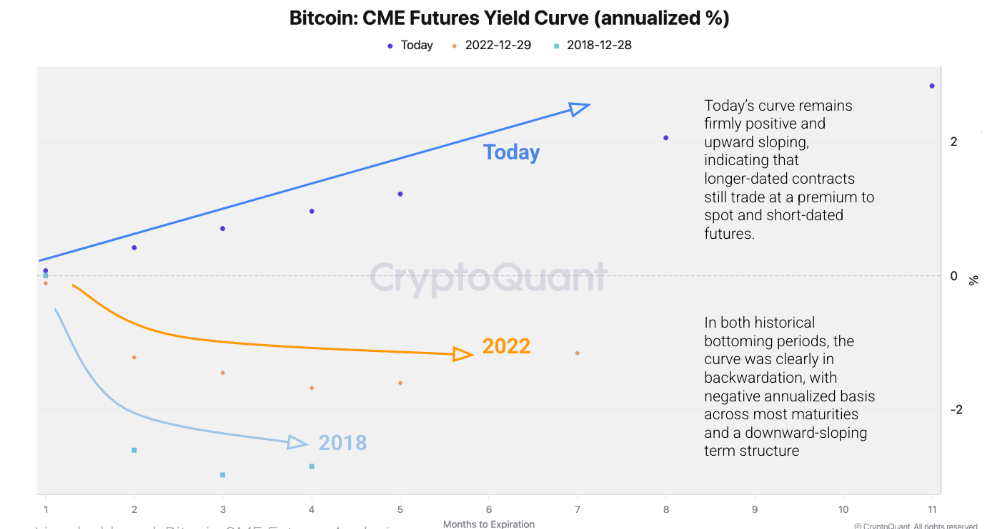
Despite recent basis compression and curve flattening, BTC market conditions have not reached the stress levels historically associated with Bitcoin bear-market bottoms, the report added.
“In both historical bottoming periods, the curve was clearly in backwardation, with negative annualized basis across most maturities and a downward-sloping term structure, reflecting forced deleveraging, hedging pressure, and distressed positioning typical of capitulation phases. By contrast, today’s curve remains firmly positive and upward sloping, indicating that longer-dated contracts still trade at a premium to spot and short-dated futures,” reported the CryptoQuant analyst.
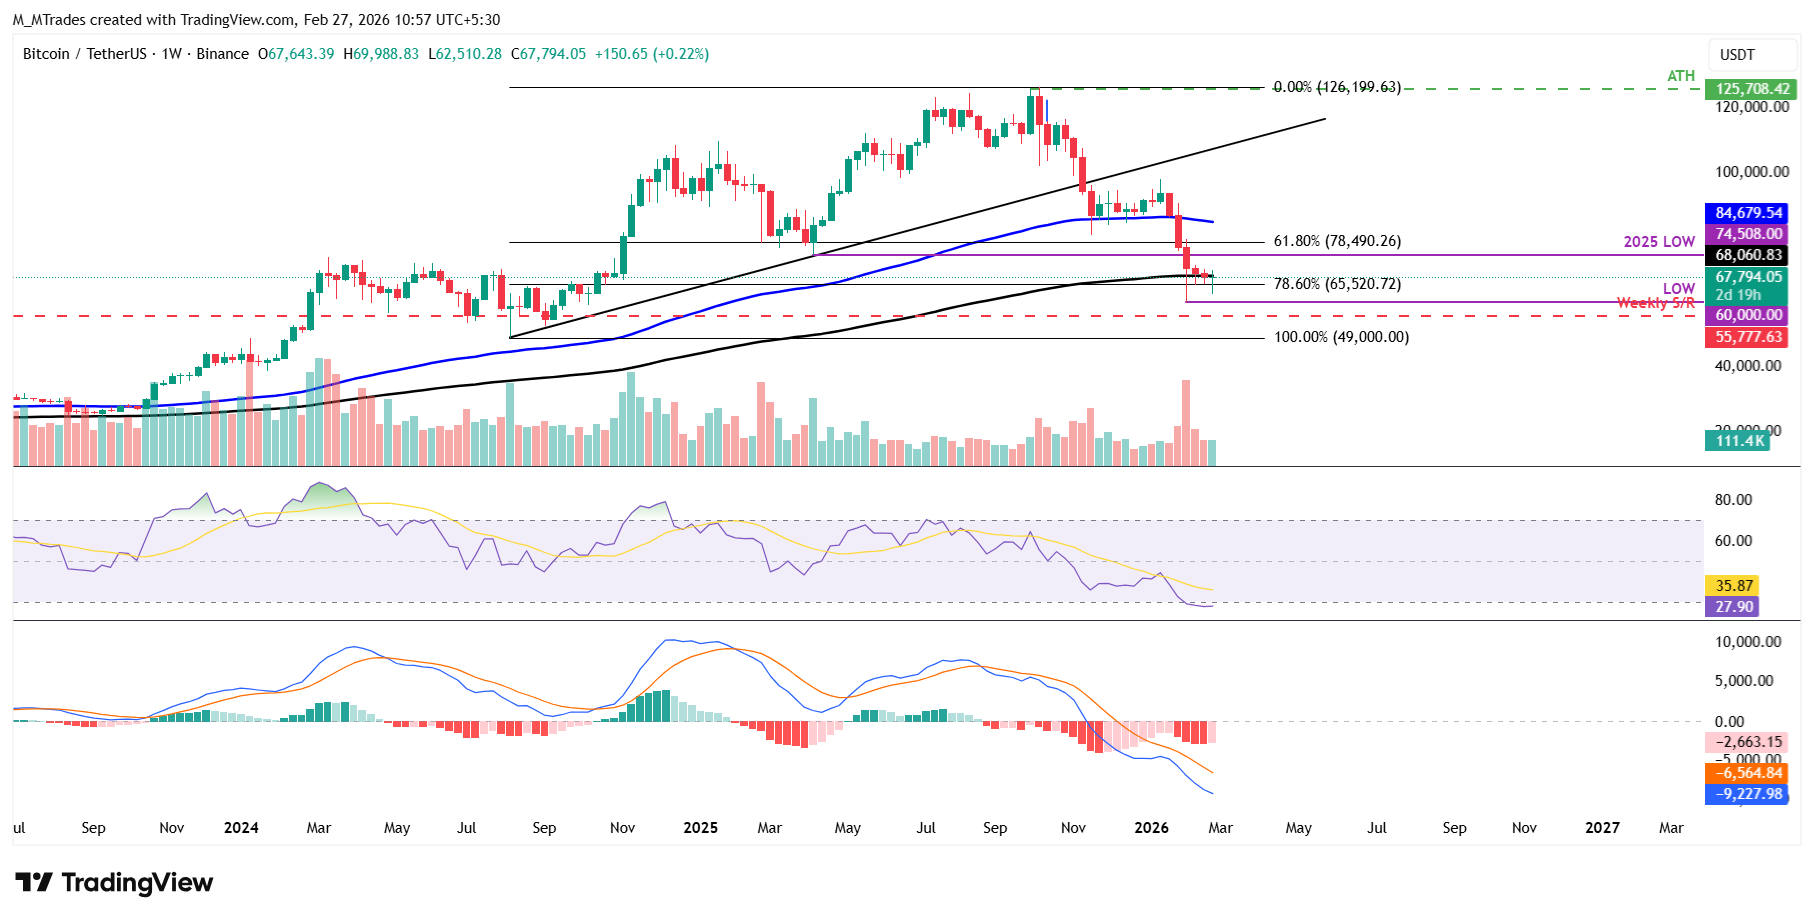
Technical Analysis: Bitcoin clings to 200-week EMA near $68,000
On the weekly chart, the largest cryptocurrency by market capitalization is hovering around the 200-week Exponential Moving Average (EMA) at $68,068 as of Friday, following a rebound from Tuesday’s two-week low of $62,510. The 78.6% Fibonacci retracement level at $65,520 (drawn from the August 2024 low of $49,000 to the October 2025 all-time high of $126,199) is acting as immediate support.
If the 200-week EMA at $68,068 holds as resistance and BTC closes below $65,520 on a weekly basis, it could extend the losses toward the $60,000 key psychological level , with the next support level around $55,777, the weekly support level.
The Relative Strength Index (RSI) reads 27 on the weekly chart, within oversold area, indicating strong bearish momentum. Additionally, the Moving Average Convergence Divergence (MACD) indicator also showed a bearish crossover in mid-August, which remains intact, further supporting the negative outlook.
On the daily chart, BTC moved back into the consolidation range between $65,729 and $71,746 after failing to break below a technical downside target below $60,000 earlier this week. BTC is stabilizing within this consolidation range.
If BTC recovers, the first significant resistance area emerges at the upper boundary of the consolidation range at $71,746.
The RSI is at 42, rebounding from oversold territory earlier this week, indicating fading bearish momentum. For the recovery rally to be sustained, the RSI must move above the 50 neutral level. The MACD showed a bullish crossover that remains intact, suggesting a positive outlook.
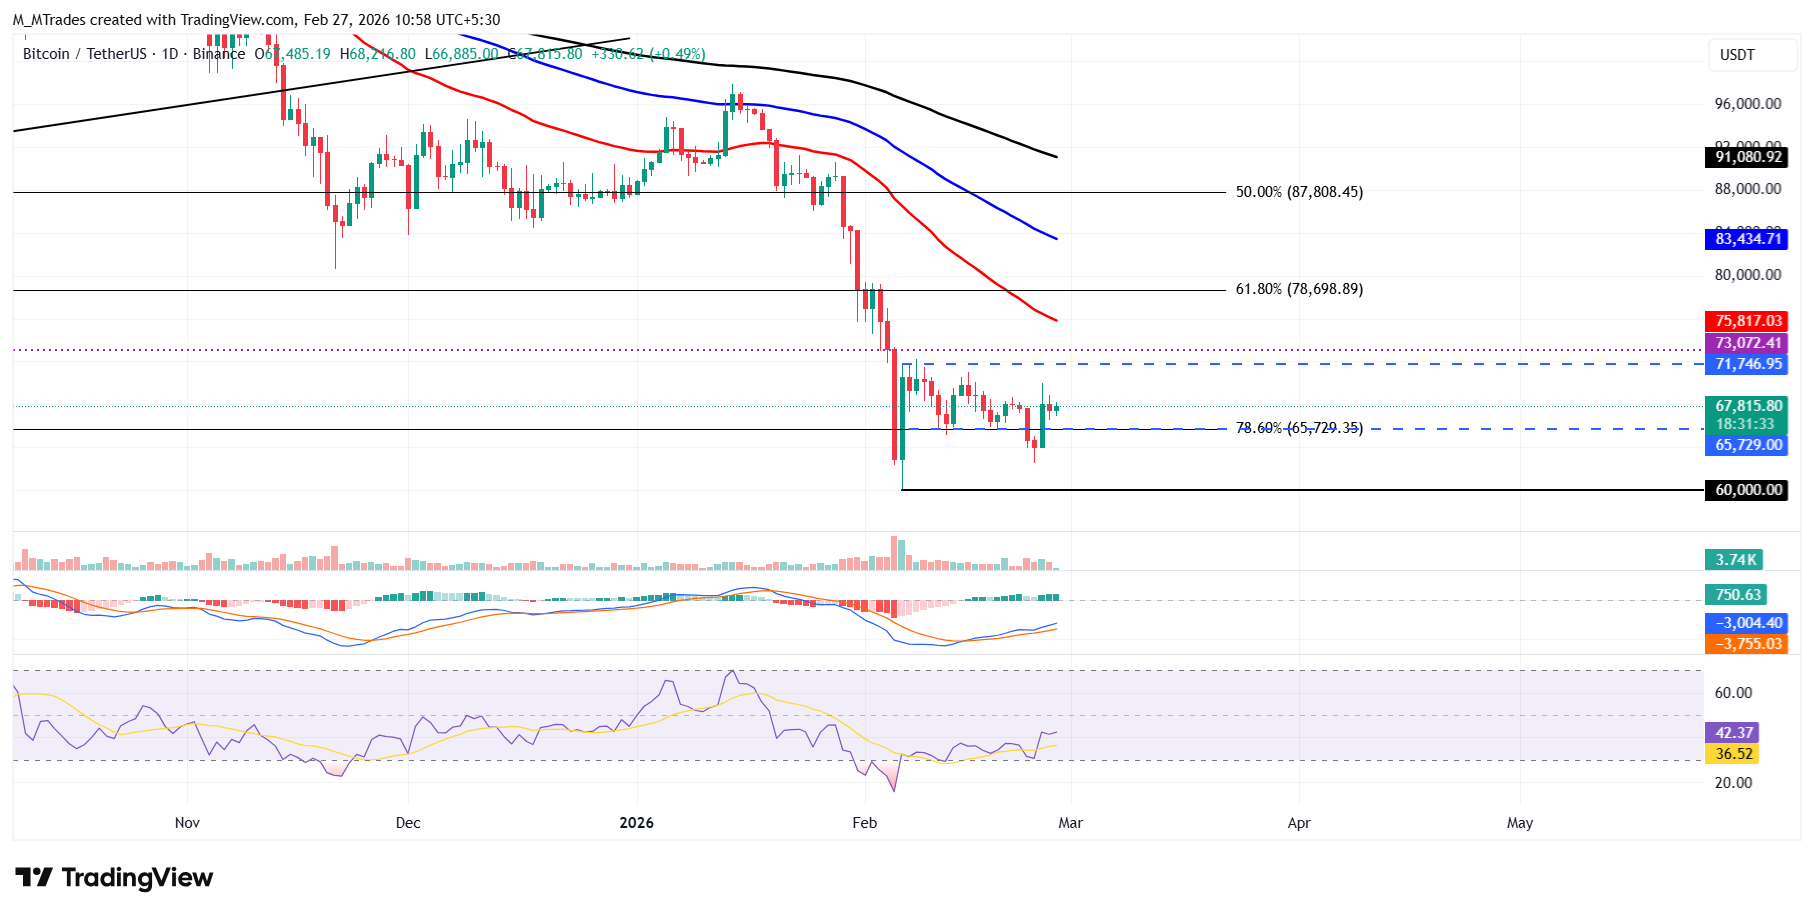
However, if BTC fails to close above the lower consolidation range at $65,729, it could extend the decline toward Tuesday’s low at $62,510. A close below this level could extend losses toward the key support at $60,000.
Bitcoin, altcoins, stablecoins FAQs
Bitcoin is the largest cryptocurrency by market capitalization, a virtual currency designed to serve as money. This form of payment cannot be controlled by any one person, group, or entity, which eliminates the need for third-party participation during financial transactions.
Altcoins are any cryptocurrency apart from Bitcoin, but some also regard Ethereum as a non-altcoin because it is from these two cryptocurrencies that forking happens. If this is true, then Litecoin is the first altcoin, forked from the Bitcoin protocol and, therefore, an “improved” version of it.
Stablecoins are cryptocurrencies designed to have a stable price, with their value backed by a reserve of the asset it represents. To achieve this, the value of any one stablecoin is pegged to a commodity or financial instrument, such as the US Dollar (USD), with its supply regulated by an algorithm or demand. The main goal of stablecoins is to provide an on/off-ramp for investors willing to trade and invest in cryptocurrencies. Stablecoins also allow investors to store value since cryptocurrencies, in general, are subject to volatility.
Bitcoin dominance is the ratio of Bitcoin's market capitalization to the total market capitalization of all cryptocurrencies combined. It provides a clear picture of Bitcoin’s interest among investors. A high BTC dominance typically happens before and during a bull run, in which investors resort to investing in relatively stable and high market capitalization cryptocurrency like Bitcoin. A drop in BTC dominance usually means that investors are moving their capital and/or profits to altcoins in a quest for higher returns, which usually triggers an explosion of altcoin rallies.

Higit sa isang milyong user ang umaasa sa FXStreet para sa real-time market data, charting tools, expert insights, at Forex news. Ang komprehensibong economic calendar at educational webinars nito ay tumutulong sa mga trader na manatiling may alam at gumawa ng kalkuladong mga desisyon. Sinusuportahan ang FXStreet ng humigit-kumulang 60 propesyonal sa pagitan ng Barcelona HQ at iba’t ibang rehiyon sa buong mundo.
Magbasa pa


