
AUD/USD Price Forecast: Rally pauses as RSI (14) struggles to extend above 60.00
Ni Sagar Dua
Na-update: 10 Apr 2026


Sikat na Artikulo

The AUD/USD pair is down 0.23% to near 0.7065 in the late Asian trading session, struggling to extend its winning streak for the fifth trading day on Friday.
- AUD/USD corrects to near 0.7065 after a four-day winning streak.
- Investors await the outcome of US-Iran ceasefire talks in Pakistan.
- The US headline CPI is expected to have risen at a faster pace of 3.3% YoY in March.
The AUD/USD pair is down 0.23% to near 0.7065 in the late Asian trading session, struggling to extend its winning streak for the fifth trading day on Friday. The Aussie pair comes under pressure as the Australian Dollar (AUD) underperforms amid uncertainty surrounding the first round of talks between the United States (US) and Iran in Pakistan over the weekend regarding the permanent ceasefire.
Australian Dollar Price Today
The table below shows the percentage change of Australian Dollar (AUD) against listed major currencies today. Australian Dollar was the weakest against the US Dollar.
| USD | EUR | GBP | JPY | CAD | AUD | NZD | CHF | |
|---|---|---|---|---|---|---|---|---|
| USD | 0.09% | 0.15% | 0.16% | 0.08% | 0.23% | 0.25% | 0.02% | |
| EUR | -0.09% | 0.05% | 0.09% | -0.03% | 0.12% | 0.16% | -0.08% | |
| GBP | -0.15% | -0.05% | 0.04% | -0.06% | 0.09% | 0.11% | -0.14% | |
| JPY | -0.16% | -0.09% | -0.04% | -0.09% | 0.07% | 0.04% | -0.18% | |
| CAD | -0.08% | 0.03% | 0.06% | 0.09% | 0.13% | 0.16% | -0.07% | |
| AUD | -0.23% | -0.12% | -0.09% | -0.07% | -0.13% | 0.02% | -0.22% | |
| NZD | -0.25% | -0.16% | -0.11% | -0.04% | -0.16% | -0.02% | -0.24% | |
| CHF | -0.02% | 0.08% | 0.14% | 0.18% | 0.07% | 0.22% | 0.24% |
The heat map shows percentage changes of major currencies against each other. The base currency is picked from the left column, while the quote currency is picked from the top row. For example, if you pick the Australian Dollar from the left column and move along the horizontal line to the US Dollar, the percentage change displayed in the box will represent AUD (base)/USD (quote).
Market participants doubt that US-Iran talks will go on smoothly amid continued military attacks in Lebanon between Iran-backed Houthis and the Israeli army.
Israeli Prime Minister (PM) Benjamin Netanyahu has pushed back hopes of a ceasefire in Lebanon, stating that Tel Aviv would continue “to strike Hezbollah with full force” as the country’s military launched fresh strikes.
On Thursday, Israeli PM Netanyahu stated, through a tweet on X, that he is open to direct negotiations with Lebanon after repeated requests from the nation.
On the macro front, investors await the US Consumer Price Index (CPI) data for March, which will be published at 12:30 GMT. The US headline inflation is expected to arrive significantly higher at 3.3% from 2.4% in February.
AUD/USD technical analysis
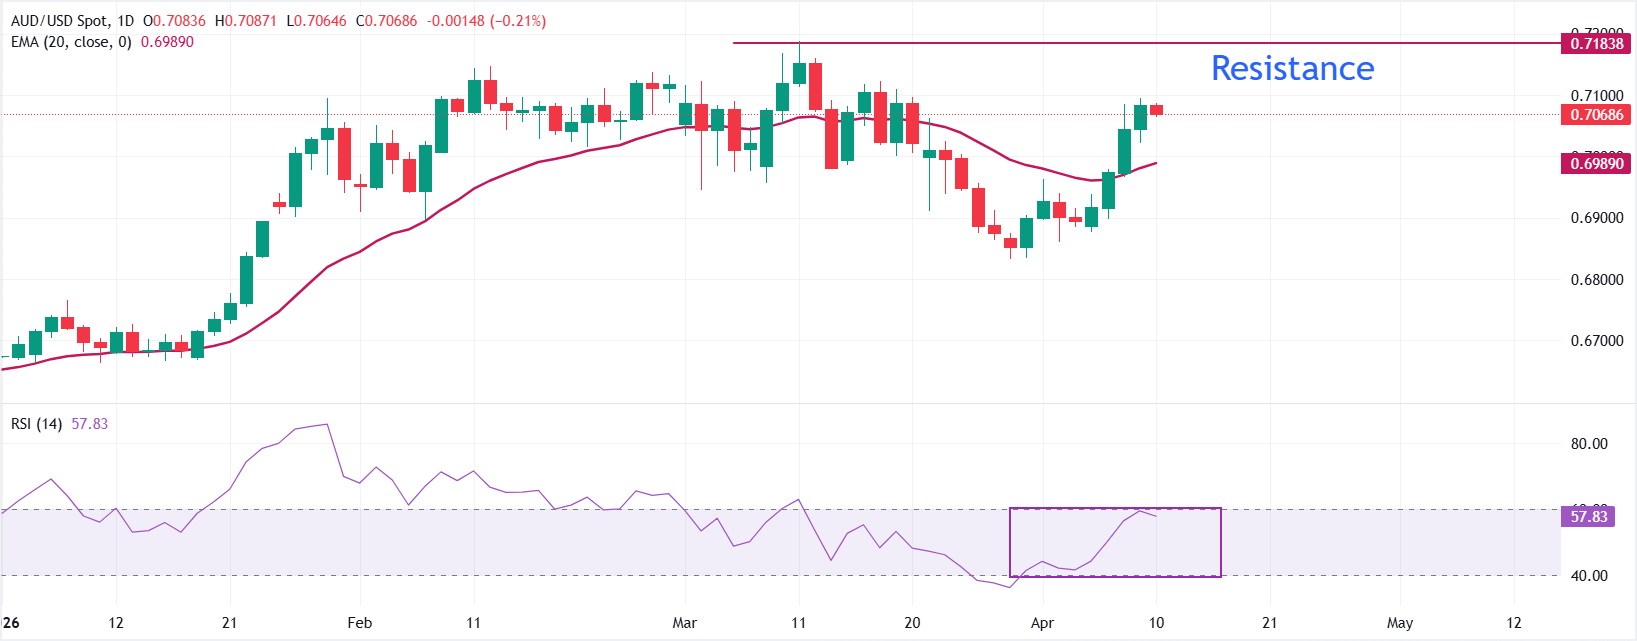
AUD/USD trades lower at around 0.7065 as of writing. However, the pair maintains a constructive bullish bias as spot holds above the 20-day exponential moving average (EMA) at 0.6989. The pair has rebounded from last month’s lows and is stabilizing near recent highs.
However, the price needs a fresh trigger to extend its upside, with the Relative Strength Index (RSI) struggling to break into the 60.00s zone.
On the downside, initial support is provided by the 20-day EMA at 0.6989, which reinforces the short-term bullish structure as long as it holds on closing bases. A daily close below this dynamic floor would signal fading upward momentum and expose a deeper correction towards the April 7 low around 0.6900.
Looking up, the April 9 high around 0.7100 is the immediate resistance; a decisive break above the same would allow the price to extend its rebound towards the March high at 0.7187.
(The technical analysis of this story was written with the help of an AI tool.)
Economic Indicator
Consumer Price Index (YoY)
Inflationary or deflationary tendencies are measured by periodically summing the prices of a basket of representative goods and services and presenting the data as The Consumer Price Index (CPI). CPI data is compiled on a monthly basis and released by the US Department of Labor Statistics. The YoY reading compares the prices of goods in the reference month to the same month a year earlier.The CPI is a key indicator to measure inflation and changes in purchasing trends. Generally speaking, a high reading is seen as bullish for the US Dollar (USD), while a low reading is seen as bearish.
Read more.Next release: Fri Apr 10, 2026 12:30
Frequency: Monthly
Consensus: 3.3%
Previous: 2.4%
Source: US Bureau of Labor Statistics
The US Federal Reserve (Fed) has a dual mandate of maintaining price stability and maximum employment. According to such mandate, inflation should be at around 2% YoY and has become the weakest pillar of the central bank’s directive ever since the world suffered a pandemic, which extends to these days. Price pressures keep rising amid supply-chain issues and bottlenecks, with the Consumer Price Index (CPI) hanging at multi-decade highs. The Fed has already taken measures to tame inflation and is expected to maintain an aggressive stance in the foreseeable future.

Higit sa isang milyong user ang umaasa sa FXStreet para sa real-time market data, charting tools, expert insights, at Forex news. Ang komprehensibong economic calendar at educational webinars nito ay tumutulong sa mga trader na manatiling may alam at gumawa ng kalkuladong mga desisyon. Sinusuportahan ang FXStreet ng humigit-kumulang 60 propesyonal sa pagitan ng Barcelona HQ at iba’t ibang rehiyon sa buong mundo.
Magbasa pa


