
Chainlink Price Forecast: LINK vulnerable to deeper losses amid waning retail demand, staking outflows
Ni John Isige
Petsa ng Pag-publish: 23 Jan 2026 | Petsa ng Pag-edit: 23 Jan 2026


Sikat na Artikulo

Chainlink (LINK) is trading under pressure at $12.20, reflecting heightened volatility in the broader cryptocurrency market at the time of writing on Thursday. The oracle token faces deepening bearish pressure as technical indicators deteriorate and market sentiment weakens.
- Chainlink braces for extended downside pressure amid a weakening technical structure.
- LINK derivatives market weakens further, with futures Open Interest dropping to $599 million.
- Investors withdraw from Chainlink staking contracts amid deteriorating confidence in the oracle token.
Chainlink (LINK) is trading under pressure at $12.20, reflecting heightened volatility in the broader cryptocurrency market at the time of writing on Thursday. The oracle token faces deepening bearish pressure as technical indicators deteriorate and market sentiment weakens.
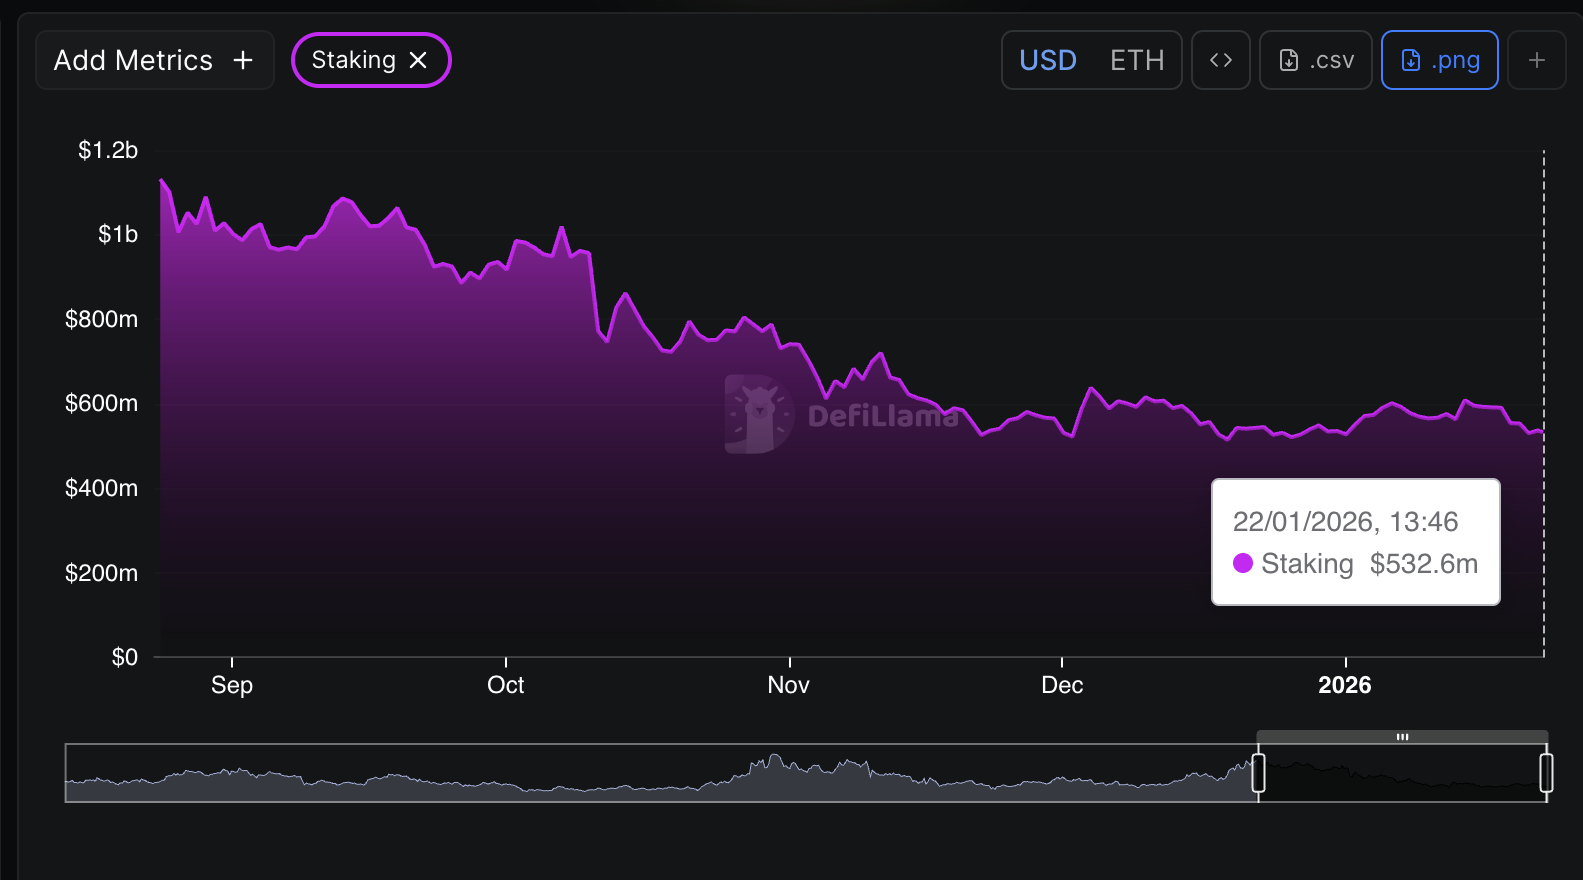
Chainlink staking outflows accelerate as retail traders exit positions
Demand for Chainlink staking solutions has remained largely subdued since August. Continued outflows have drained the staking balance, which is averaging $532 million on Thursday, down from $601 million on January 6.
The Chainlink staking balance exceeded the $1 billion mark in August, underscoring the significant decline in investor confidence.
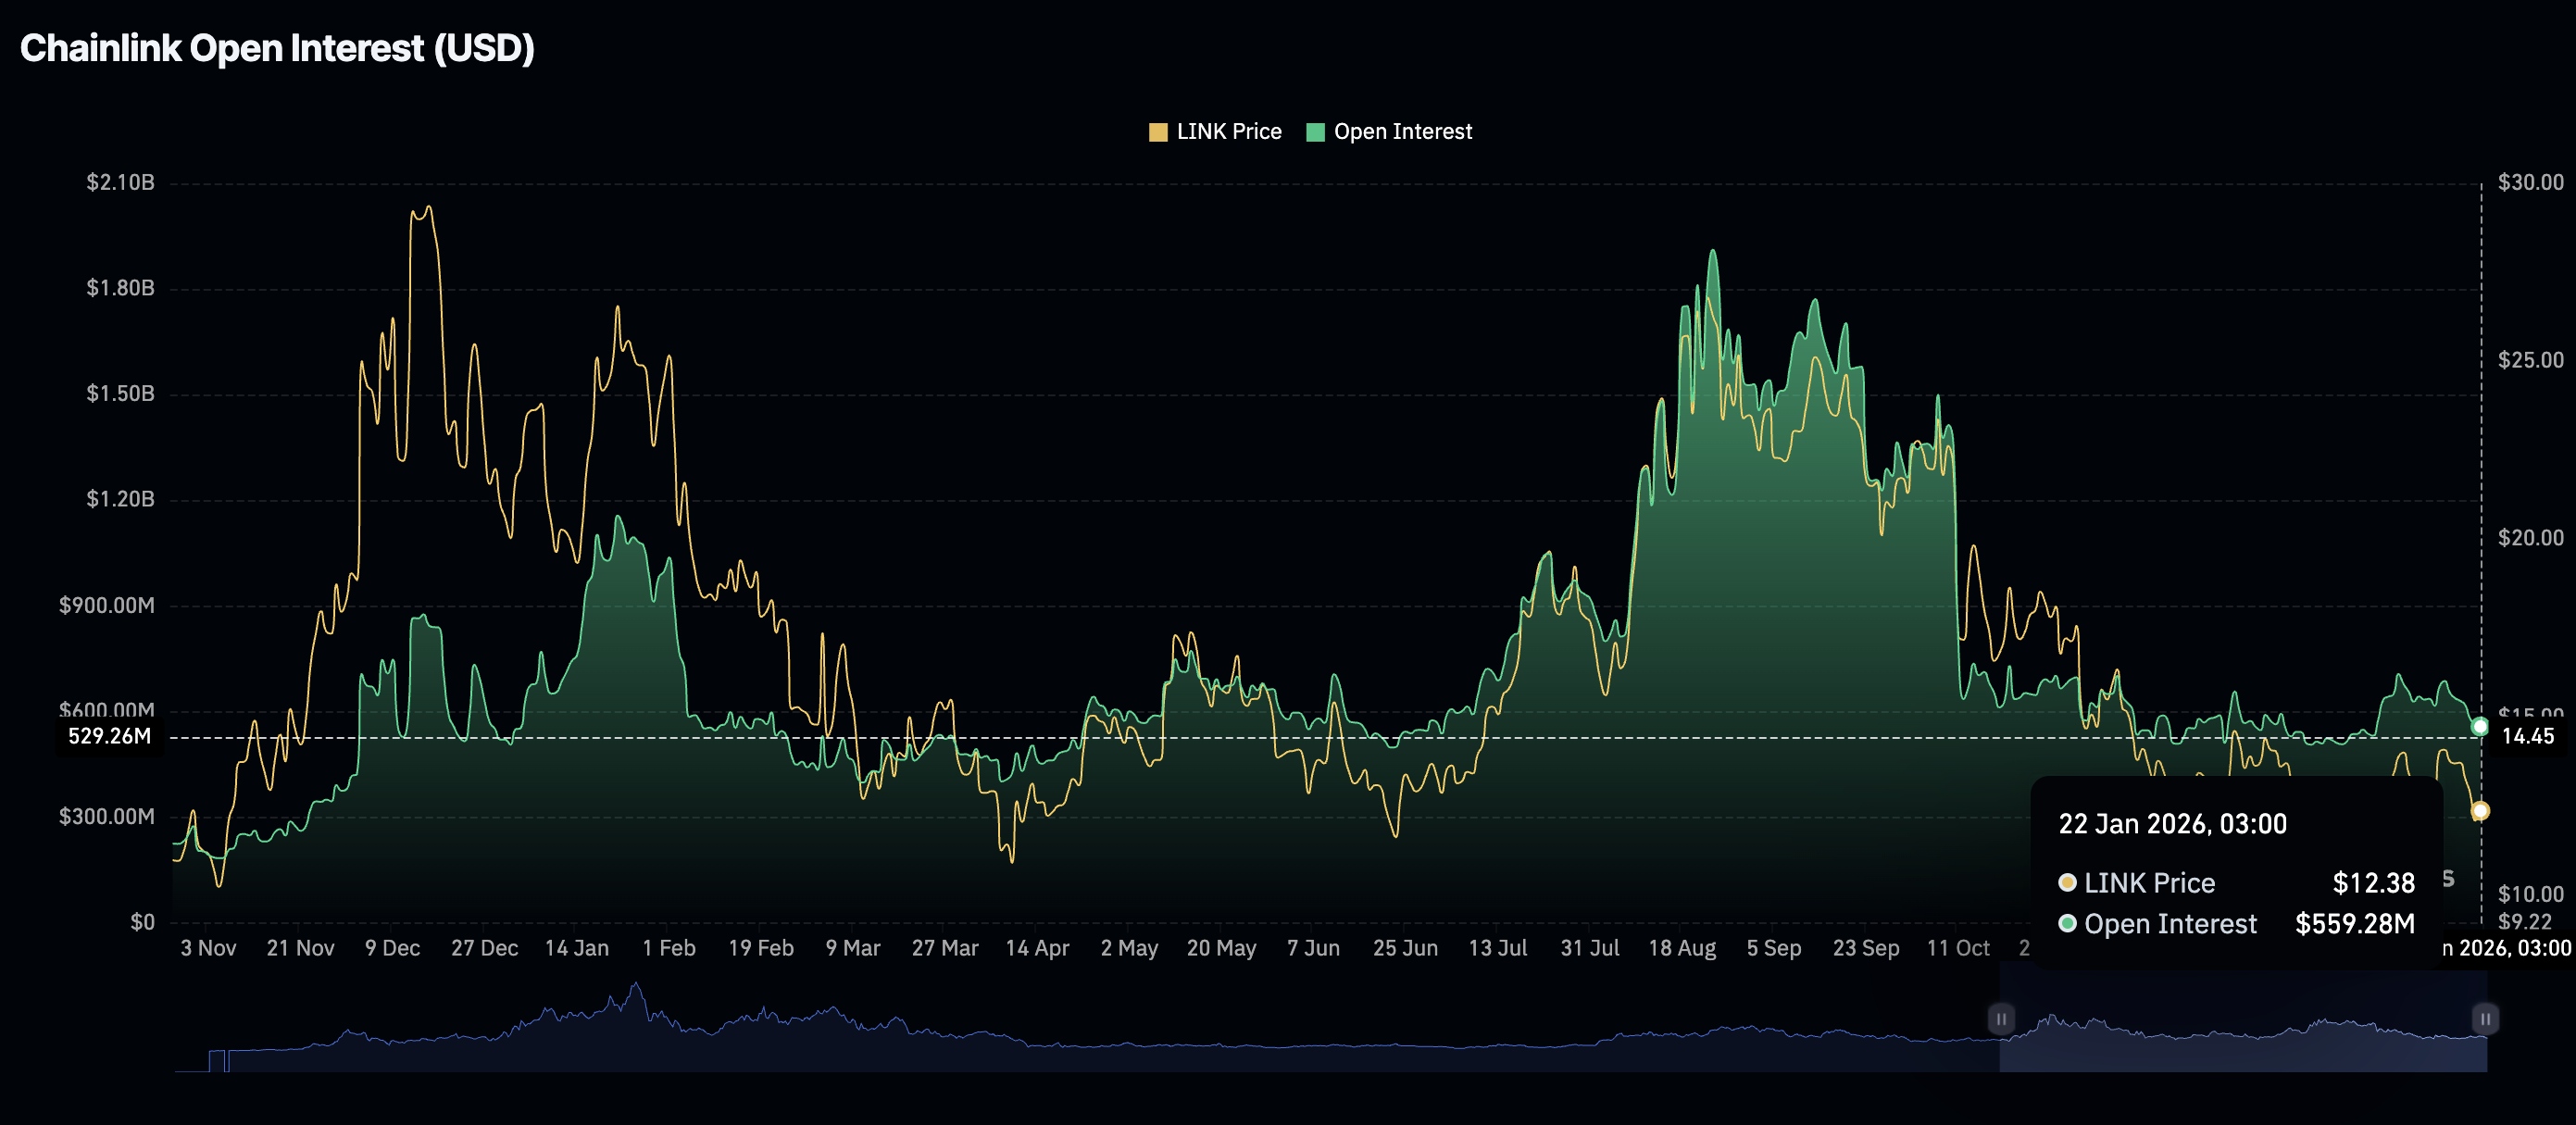
Chainlink’s derivatives market has similarly experienced significant drawdowns, as futures Open Interest (OI) has declined to $559 million on Thursday, from $566 million the previous day and $708 million on January 6.
OI represents the notional value of outstanding futures contracts, which gauges investor interest in the token. CoinGlass data shows that OI hit a record $1.91 billion in August before declining as sentiment across the crypto market deteriorated.
Technical outlook: LINK risks a 10% drawdown
Chainlink’s downside woes stem from fading retail interest and a lack of investor confidence, which could explain the drop in the protocol’s staking balance and Open Interest. The token sits on a weakening technical structure, with the 50-day Exponential Moving Average (EMA) at $13.39, the 100-day EMA at $14.51, and the 200-day EMA at $15.77.
The Relative Strength Index (RSI) is at 39 and pointing downward, indicating a bearish momentum buildup. Further decline in this indicator could see LINK fall 10% from its current level, testing support at $10.94.
The Moving Average Convergence Divergence (MACD) remains below its signal line, reinforcing the overall bearish outlook. Investors will be prompted to reduce exposure if the histogram bars continue expanding below the zero line.
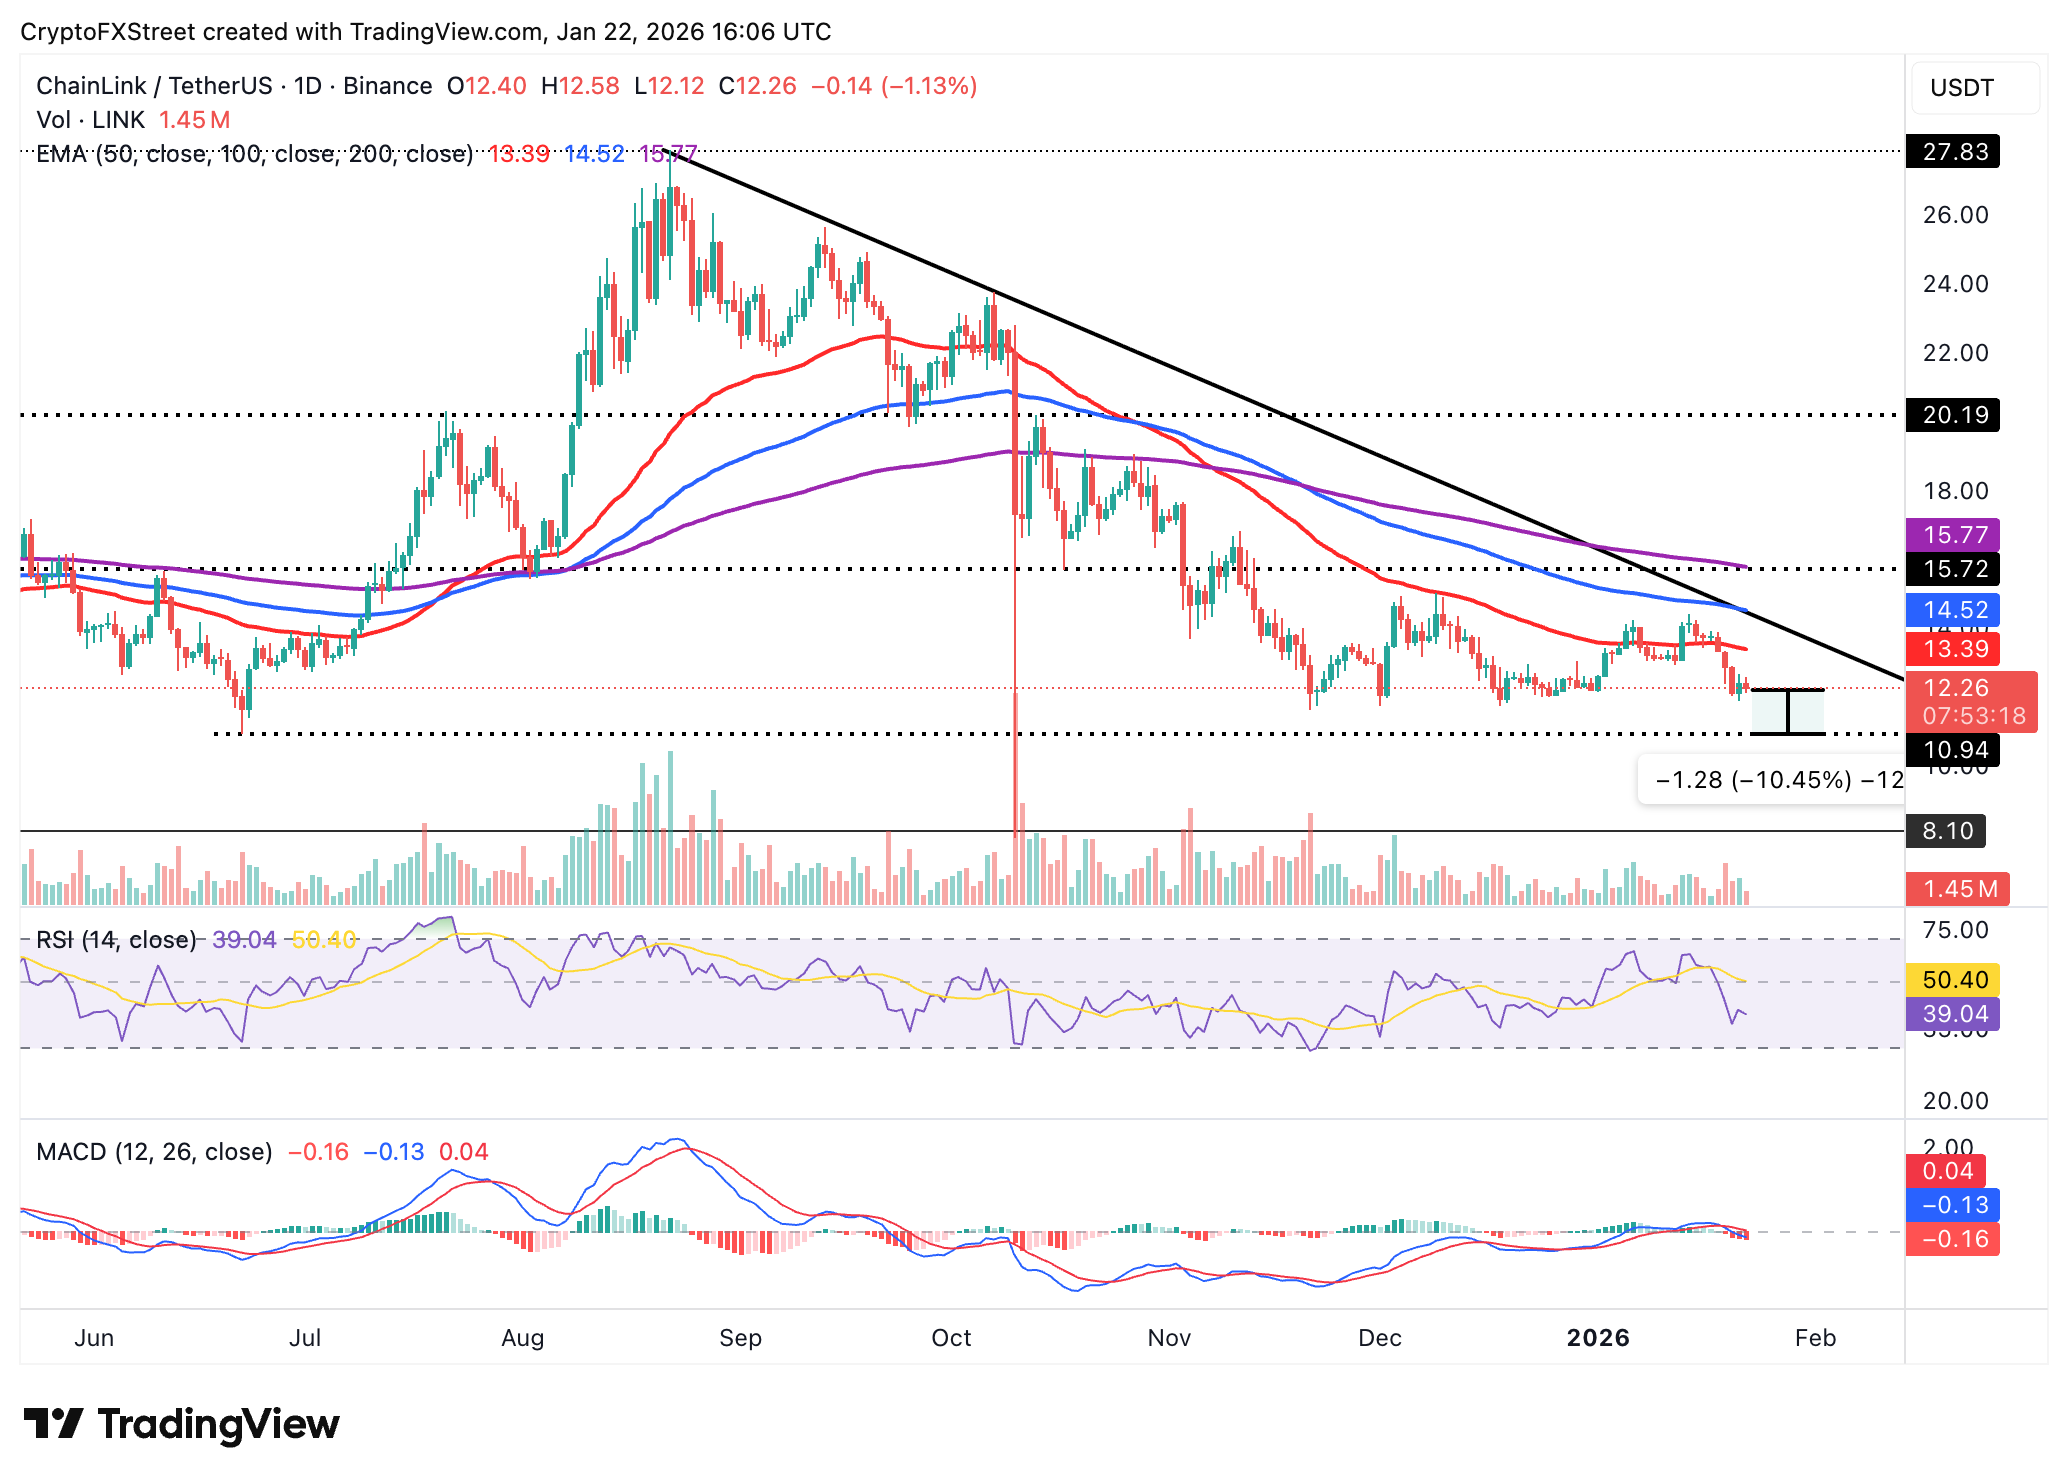
Still, if bulls buy the dip and add to the tailwind, LINK may change its course, eyeing to break the 50-day EMA hurdle at $13.39. A decisive move above this level would encourage more investors to increase exposure while anticipating a larger breakout above the remaining moving average cluster between $14.51 and $15.77.
Cryptocurrency metrics FAQs
The developer or creator of each cryptocurrency decides on the total number of tokens that can be minted or issued. Only a certain number of these assets can be minted by mining, staking or other mechanisms. This is defined by the algorithm of the underlying blockchain technology. On the other hand, circulating supply can also be decreased via actions such as burning tokens, or mistakenly sending assets to addresses of other incompatible blockchains.
Market capitalization is the result of multiplying the circulating supply of a certain asset by the asset’s current market value.
Trading volume refers to the total number of tokens for a specific asset that has been transacted or exchanged between buyers and sellers within set trading hours, for example, 24 hours. It is used to gauge market sentiment, this metric combines all volumes on centralized exchanges and decentralized exchanges. Increasing trading volume often denotes the demand for a certain asset as more people are buying and selling the cryptocurrency.
Funding rates are a concept designed to encourage traders to take positions and ensure perpetual contract prices match spot markets. It defines a mechanism by exchanges to ensure that future prices and index prices periodic payments regularly converge. When the funding rate is positive, the price of the perpetual contract is higher than the mark price. This means traders who are bullish and have opened long positions pay traders who are in short positions. On the other hand, a negative funding rate means perpetual prices are below the mark price, and hence traders with short positions pay traders who have opened long positions.

Higit sa isang milyong user ang umaasa sa FXStreet para sa real-time market data, charting tools, expert insights, at Forex news. Ang komprehensibong economic calendar at educational webinars nito ay tumutulong sa mga trader na manatiling may alam at gumawa ng kalkuladong mga desisyon. Sinusuportahan ang FXStreet ng humigit-kumulang 60 propesyonal sa pagitan ng Barcelona HQ at iba’t ibang rehiyon sa buong mundo.
Magbasa pa


